Glass Forming Machine Market Size and Share Forecast Outlook 2025 to 2035

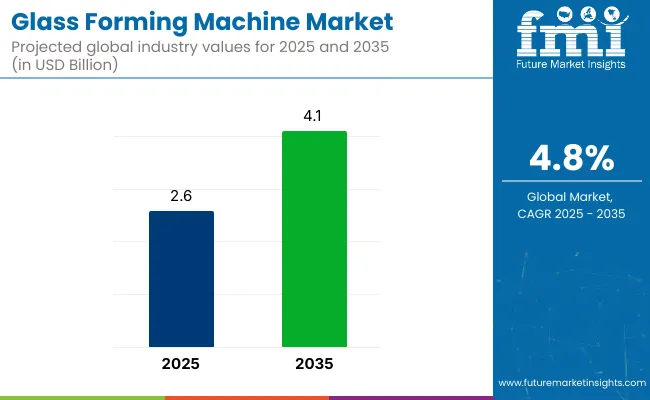
The global glass forming machine market is valued at USD 2.6 billion in 2025 and is slated to be worth USD 4.1 billion by 2035, reflecting a CAGR of 4.8%. Growth is anticipated due to rising demand for sustainable glass packaging in food, beverage, and pharmaceutical sectors, as well as increasing automation across glass manufacturing lines.
Quick Stats - Glass Forming Machine Market

  • Market Value (2025): USD 2.6 billion
  • Forecast Value (2035): USD 4.1 billion
  • Forecast CAGR: 4.8%
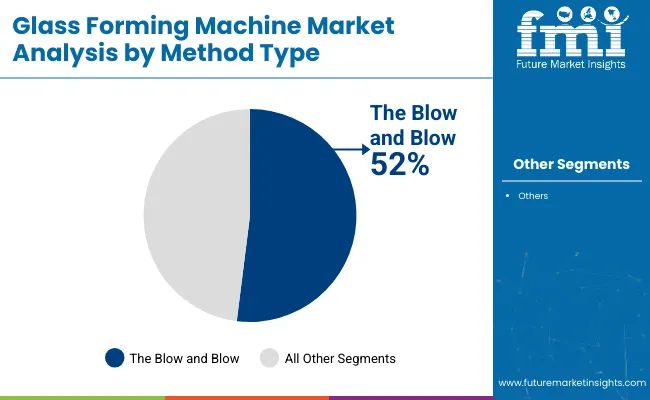
  • Method Leader in 2025: Blow and Blow (52% Market Share)
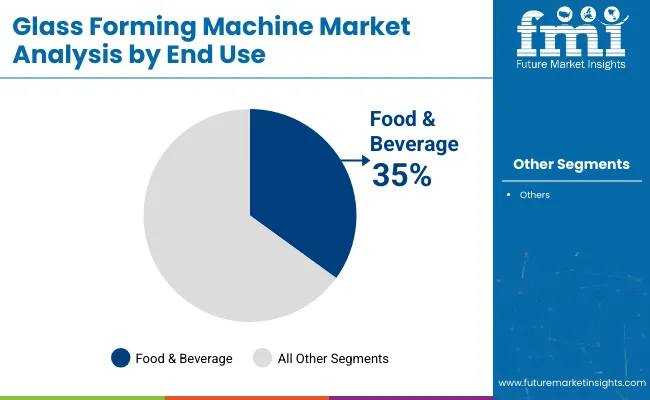
  • Top End-Use Industry: Food & Beverage (35% Market Share)
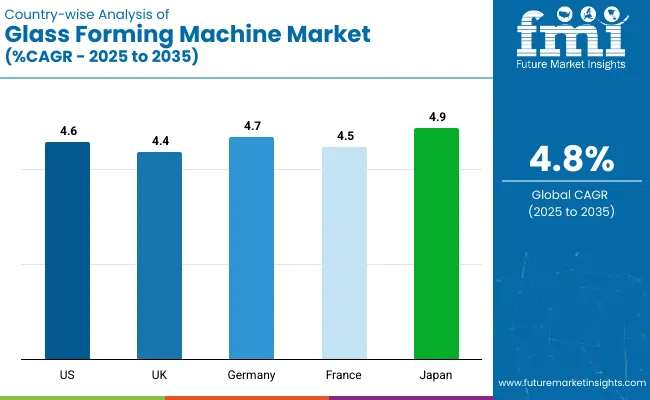
  • Fastest-growing Region: Asia Pacific (fastest-growing market in Japan with 4.9% CAGR)

Glass Forming Machine Market

Additionally, the integration of Industry 4.0 technologies like AI, IoT, and predictive maintenance has significantly enhanced forming accuracy, reduced downtime, and improved energy efficiency, further reinforcing market momentum through 2035.

North America accounted for the largest share in 2025, supported by automation investments and strict sustainability mandates, with the USA growing at a CAGR of 4.6%. Meanwhile, Japan is anticipated to register the fastest growth with a CAGR of 4.9% closely followed by Germany with 4.7% CAGR. By method type, the Blow and Blow segment held a prominent market share of 52% in 2025. Meanwhile, the food and beverage sector remained the top contributor among end users due to the rising shift away from plastic packaging in developed economies, accounting for a share of 35%.

Heye International and Bottero S.P.A. have recorded robust gains through their investment in AI-integrated high-speed forming machines. Conversely, small and medium manufacturers in emerging economies continue to face financial constraints due to high capital and maintenance costs and slow adoption rates. Companies operating in regions with volatile raw material pricing and weak infrastructure, such as parts of Africa and Latin America, have reported sluggish returns, despite growing demand.

Looking ahead, the market is expected to witness notable innovation in sustainable manufacturing. Companies are actively developing electric and hybrid glass forming machines to reduce their carbon footprints. Integration of digital twins and cloud-based diagnostics is also being scaled. Countries such as Japan and Germany are leading in smart glass technologies and R&D efforts aimed at producing lightweight, shatterproof, and recyclable glass. These trends are likely to define the next growth phase of the glass forming machine market through 2035.

Analyzing Glass Forming Machine Market by Top Investment Segments

The global glass forming machine market is segmented based on method type, end use and region. By method type, it is segmented as blow and blow method and press and blow method, by end use it includes healthcare, chemical, food & beverages, laboratories, and others (which includes cosmetics, industrial, and household glassware), and by region North America, Latin America, Western Europe, South Asia, East Asia, Eastern Europe, and Middle East & Africa.

By Method Type, the Blow and Blow Method Accounts for 52% of the Market Share

The blow and blow method is expected to retain dominance with 52% of the market share in 2025, largely due to its effectiveness in manufacturing premium glass bottles for beverages, cosmetics, and pharmaceuticals. The method’s precision and strength make it ideal for high-value packaging, especially in developed markets.
  • High adoption in cosmetic and liquor packaging
  • Preferred for thin-walled, durable containers
  • Expanding in pharmaceutical glass vial production
  • Strong usage in North America and Europe

Glass Forming Machine Market Analysis By Method Type

By End Use, Food & Beverage Accounts for 35% of the Market Share

Food & beverages will lead the end-use segment with approximately 35% market share in 2025. Glass packaging demand is rising sharply due to the global shift from plastics to recyclable materials, especially for sauces, beverages, and dairy products. The growing popularity of artisanal and small-batch products has further accelerated the need for aesthetically appealing and durable glass containers.
  • Surge in eco-friendly packaging mandates
  • Premium glass bottle demand in the alcohol segment
  • Lightweight glass technologies are gaining traction
  • High consumption in Europe and North America

Glass Forming Machine Market Analysis By End Use

Top Glass Forming Machine Market Dynamics

Recent Trends in the Glass Forming Machine Market

  • Integration of AI and IoT for predictive maintenance and real-time monitoring is accelerating.
  • Rise in demand for lightweight and recyclable glass containers across the FMCG sector.
  • Increased investments in electric and hybrid glass forming machines to reduce emissions.
  • The growing use of smart glass in architecture and the automotive industries is reshaping machine design.

Key Challenges Facing the Glass Forming Machine Market
  • High initial investment and operational maintenance costs limit adoption among SMEs.
  • Shortage of skilled labor for operating and maintaining advanced forming equipment.
  • Volatility in raw material prices disrupts production planning and supply chain stability.
  • Compliance with stringent environmental and energy regulations increases manufacturing complexity.

Analyzing Top Countries Manufacturing and Supplying Glass Forming Machines

Country Wise Analysis Of Glass Forming Machine Market

USA Glass Forming Machine Market Analysis

The glass forming machine sales in the USA is anticipated to grow at a CAGR of 4.6% from 2025 to 2035, driven by surging demand in the food, beverage, and pharmaceutical packaging sectors. Automation and AI integration in forming machines have seen widespread adoption, reducing waste and improving throughput. Regulatory emphasis on energy efficiency and sustainability is pushing manufacturers to upgrade existing systems with cleaner, smarter technologies.

  • Growing demand for precision-formed glass in the pharma and beverage industries.
  • Regulatory support for energy-efficient and recyclable packaging.
  • Rapid integration of Industry 4.0 technologies in production facilities.

Glass Forming Machine Sales Analysis in the UK

The glass forming machine market revenue in the UK is projected to expand at a CAGR of 4.4% during the forecast period, propelled by the country’s robust packaging sector and increasing demand for sustainable glass solutions. Premium liquor and high-end food brands are opting for custom glass containers, boosting machine demand. Additionally, investments in eco-friendly production technologies are growing, spurred by stringent UK environmental mandates.

  • Rising preference for eco-conscious packaging in premium markets.
  • Government-backed sustainability initiatives are boosting green machinery.
  • Demand growth in the luxury beverage and architectural glass segments.

Germany Glass Forming Machine Market Analysis

The glass forming machine sales in Germany is forecasted to witness a CAGR of 4.7% between 2025 and 2035, anchored by its leadership in industrial automation and sustainable engineering. Advanced R&D, especially in smart manufacturing, is fostering the development of efficient and adaptive glass forming systems. Germany’s automotive and construction sectors are also key demand contributors for durable and lightweight glass applications.

  • Strong industrial base supporting high-precision manufacturing technologies.
  • Leading role in R&D for energy-efficient machinery.
  • Surge in glass demand from automotive and infrastructure projects.

Glass Forming Machine Demand Analysis in France

The glass forming machine market in France is expected to register a CAGR of 4.5% from 2025 to 2035, supported by a shift toward recyclable packaging and high-performance architectural glass. With rising consumer awareness and government regulations phasing out plastics, glass manufacturers are investing in modern forming equipment. France is also witnessing the adoption of forming technologies in the pharmaceutical and cosmetic industries.

  • Increasing the replacement of plastics with recyclable glass in consumer goods.
  • Investments in automation and digital transformation of glass plants.
  • Growing demand for high-quality cosmetic and pharma-grade glass containers.

Japan Glass Forming Machine Market Analysis

The glass forming machine sales in Japan is poised to grow at a CAGR of 4.9% through 2035, led by its world-class electronics and automotive sectors. Demand for ultra-thin, high-strength, and smart glass has spurred innovation in forming machines. Government sustainability policies and rapid deployment of robotics in manufacturing continue to enhance operational precision and energy efficiency across the glass forming industry.

  • High demand for specialty glass in displays, EVs, and semiconductors.
  • The government focuses on low-emission and sustainable manufacturing solutions.
  • Rapid integration of robotics and AI in precision glass forming lines.

Leading Glass Forming Machine Suppliers

The glass forming machine market is moderately consolidated, with top-tier companies like Bucher Emhart Glass, Bottero S.p.A., and Heye International commanding substantial global market share. These firms are actively competing on the fronts of precision engineering, automation capabilities, energy efficiency, and AI-driven monitoring technologies. In contrast, regional players such as China Glass Machinery and Tianjin Jingpeng are focusing on cost-effective solutions and expanding presence in emerging economies like India, Brazil, and Southeast Asia.

Strategic priorities across the industry include smart manufacturing integration, digitization of forming lines, sustainability-focused retrofits, and turnkey automation services. Leading companies are increasingly entering technology partnerships and regional joint ventures to scale up local production, enhance service capabilities, and adhere to tightening energy and emission regulations.

For example, Bottero S.p.A has been investing in fully automated forming machines with AI-based control systems, while BDF Industries has strengthened its product range through strategic alliances and energy-efficient machine upgrades.

Recent Glass Forming Machine Market News

In June 2024, Bucher Emhart Glass announced its upgrade to IFS Cloud software across 13 international sites, aiming to drive efficiency, process automation, and predictive maintenance as part of its servitization strategy.

Glass Forming Machine Market Report Scope

Report Attributes                     Details                                                             
Current Total Market Size (2025) USD 2.6 billion
Projected Market Size (2035) USD 4.1 billion
CAGR (2025 to 2035) 4.8%
Base Year for Estimation 2024
Historical Period 2020 to 2024
Projections Period 2025 to 2035
Market Analysis Parameters Revenue in USD billions/Volume in Units
By Method Type Blow and Blow Method, Press and Blow Method
By End Use Health Care, Chemical, Food & Beverages, Laboratories, Others (cosmetics, industrial, household)
Regions Covered North America, Latin America, Western Europe, Eastern Europe, South Asia, East Asia, Middle East & Africa
Countries Covered United States, Canada, United Kingdom, Germany, France, China, Japan, South Korea, Brazil, Australia
Key Players Bucher Emhart Glass, Bottero S.p.A, Heye International, Sklostroj, BDF Industries, China Glass Machinery, Kanger Glass Technologies, Tianjin Jingpeng, Horn Glass Industries, and Olivotto Glass Technologies
Additional Attributes Dollar sales by value, market share analysis by region, and country-wise analysis

Key Segments

By Method Type:

In terms of Structure Type, the industry is divided into Blow and Blow Method, Press and Blow Method

By End Use:

In terms of End Use, the industry is divided into Health Care, Chemical, Food & Beverages, Laboratories, Others

By Region:

The report covers key regions, including North America, Latin America, Western Europe, Eastern Europe, East Asia, South Asia, and the Middle East and Africa (MEA).

Table of Content

  1. Executive Summary
    • Global Market Outlook
    • Demand-side Trends
    • Supply-side Trends
    • Technology Roadmap Analysis
    • Analysis and Recommendations
  2. Market Overview
    • Market Coverage / Taxonomy
    • Market Definition / Scope / Limitations
  3. Market Background
    • Market Dynamics
      • Drivers
      • Restraints
      • Opportunity
      • Trends
    • Scenario Forecast
      • Demand in Optimistic Scenario
      • Demand in Likely Scenario
      • Demand in Conservative Scenario
    • Opportunity Map Analysis
    • Product Life Cycle Analysis
    • Supply Chain Analysis
      • Supply Side Participants and their Roles
        • Producers
        • Mid-Level Participants (Traders/ Agents/ Brokers)
        • Wholesalers and Distributors
      • Value Added and Value Created at Node in the Supply Chain
      • List of Raw Material Suppliers
      • List of Existing and Potential Buyer’s
    • Investment Feasibility Matrix
    • Value Chain Analysis
      • Profit Margin Analysis
      • Wholesalers and Distributors
      • Retailers
    • PESTLE and Porter’s Analysis
    • Regulatory Landscape
      • By Key Regions
      • By Key Countries
    • Regional Parent Market Outlook
    • Production and Consumption Statistics
    • Import and Export Statistics
  4. Global Market Analysis 2020 to 2024 and Forecast, 2025 to 2035
    • Historical Market Size Value (USD Billion) & Volume (Units) Analysis, 2020 to 2024
    • Current and Future Market Size Value (USD Billion) & Volume (Units) Projections, 2025 to 2035
      • Y-o-Y Growth Trend Analysis
      • Absolute $ Opportunity Analysis
  5. Global Market Pricing Analysis 2020 to 2024 and Forecast 2025 to 2035
  6. Global Market Analysis 2020 to 2024 and Forecast 2025 to 2035, By Method Type
    • Introduction / Key Findings
    • Historical Market Size Value (USD Billion) & Volume (Units) Analysis By Method Type, 2020 to 2024
    • Current and Future Market Size Value (USD Billion) & Volume (Units) Analysis and Forecast By Method Type, 2025 to 2035
      • Blow and Blow Method
      • Press and Blow Method
    • Y-o-Y Growth Trend Analysis By Method Type, 2020 to 2024
    • Absolute $ Opportunity Analysis By Method Type, 2025 to 2035
  7. Global Market Analysis 2020 to 2024 and Forecast 2025 to 2035, By End Use
    • Introduction / Key Findings
    • Historical Market Size Value (USD Billion) & Volume (Units) Analysis By End Use, 2020 to 2024
    • Current and Future Market Size Value (USD Billion) & Volume (Units) Analysis and Forecast By End Use, 2025 to 2035
      • Health Care
      • Chemical
      • Food & Beverages
      • Laboratories
      • Others
    • Y-o-Y Growth Trend Analysis By End Use, 2020 to 2024
    • Absolute $ Opportunity Analysis By End Use, 2025 to 2035
  8. Global Market Analysis 2020 to 2024 and Forecast 2025 to 2035, By Region
    • Introduction
    • Historical Market Size Value (USD Billion) & Volume (Units) Analysis By Region, 2020 to 2024
    • Current Market Size Value (USD Billion) & Volume (Units) Analysis and Forecast By Region, 2025 to 2035
      • North America
      • Latin America
      • Western Europe
      • Eastern Europe
      • East Asia
      • South Asia & Pacific
      • Middle East and Africa
    • Market Attractiveness Analysis By Region
  9. North America Market Analysis 2020 to 2024 and Forecast 2025 to 2035, By Country
    • Historical Market Size Value (USD Billion) & Volume (Units) Trend Analysis By Market Taxonomy, 2020 to 2024
    • Market Size Value (USD Billion) & Volume (Units) Forecast By Market Taxonomy, 2025 to 2035
      • By Country
        • USA
        • Canada
        • Mexico
      • By Method Type
      • By End Use
    • Market Attractiveness Analysis
      • By Country
      • By Method Type
      • By End Use
    • Key Takeaways
  10. Latin America Market Analysis 2020 to 2024 and Forecast 2025 to 2035, By Country
    • Historical Market Size Value (USD Billion) & Volume (Units) Trend Analysis By Market Taxonomy, 2020 to 2024
    • Market Size Value (USD Billion) & Volume (Units) Forecast By Market Taxonomy, 2025 to 2035
      • By Country
        • Brazil
        • Argentina
        • Rest of LATAM
      • By Method Type
      • By End Use
    • Market Attractiveness Analysis
      • By Country
      • By Method Type
      • By End Use
    • Key Takeaways
  11. Western Europe Market Analysis 2020 to 2024 and Forecast 2025 to 2035, By Country
    • Historical Market Size Value (USD Billion) & Volume (Units) Trend Analysis By Market Taxonomy, 2020 to 2024
    • Market Size Value (USD Billion) & Volume (Units) Forecast By Market Taxonomy, 2025 to 2035
      • By Country
        • Germany
        • Italy
        • France
        • UK
        • Spain
        • BENELUX
        • Nordic
        • Rest of W.Europe
      • By Method Type
      • By End Use
    • Market Attractiveness Analysis
      • By Country
      • By Method Type
      • By End Use
    • Key Takeaways
  12. Eastern Europe Market Analysis 2020 to 2024 and Forecast 2025 to 2035, By Country
    • Historical Market Size Value (USD Billion) & Volume (Units) Trend Analysis By Market Taxonomy, 2020 to 2024
    • Market Size Value (USD Billion) & Volume (Units) Forecast By Market Taxonomy, 2025 to 2035
      • By Country
        • Russia
        • Hungary
        • Poland
        • Balkan & Baltics
        • Rest of E. Europe
      • By Method Type
      • By End Use
    • Market Attractiveness Analysis
      • By Country
      • By Method Type
      • By End Use
    • Key Takeaways
  13. East Asia Market Analysis 2020 to 2024 and Forecast 2025 to 2035, By Country
    • Historical Market Size Value (USD Billion) & Volume (Units) Trend Analysis By Market Taxonomy, 2020 to 2024
    • Market Size Value (USD Billion) & Volume (Units) Forecast By Market Taxonomy, 2025 to 2035
      • By Country
        • China
        • Japan
        • South Korea
      • By Method Type
      • By End Use
    • Market Attractiveness Analysis
      • By Country
      • By Method Type
      • By End Use
    • Key Takeaways
  14. South Asia & Pacific Market Analysis 2020 to 2024 and Forecast 2025 to 2035, By Country
    • Historical Market Size Value (USD Billion) & Volume (Units) Trend Analysis By Market Taxonomy, 2020 to 2024
    • Market Size Value (USD Billion) & Volume (Units) Forecast By Market Taxonomy, 2025 to 2035
      • By Country
        • India
        • Australia & New Zealand
        • ASEAN
        • Rest of SAP
      • By Method Type
      • By End Use
    • Market Attractiveness Analysis
      • By Country
      • By Method Type
      • By End Use
    • Key Takeaways
  15. Middle East and Africa Market Analysis 2020 to 2024 and Forecast 2025 to 2035, By Country
    • Historical Market Size Value (USD Billion) & Volume (Units) Trend Analysis By Market Taxonomy, 2020 to 2024
    • Market Size Value (USD Billion) & Volume (Units) Forecast By Market Taxonomy, 2025 to 2035
      • By Country
        • GCC Countries
        • Northern Africa
        • South Africa
        • Turkiye
        • Rest of MEA
      • By Method Type
      • By End Use
    • Market Attractiveness Analysis
      • By Country
      • By Method Type
      • By End Use
    • Key Takeaways
  16. Key Countries Market Analysis
    • USA
      • Pricing Analysis
      • Market Share Analysis, 2024
        • By Method Type
        • By End Use
    • Canada
      • Pricing Analysis
      • Market Share Analysis, 2024
        • By Method Type
        • By End Use
    • Brazil
      • Pricing Analysis
      • Market Share Analysis, 2024
        • By Method Type
        • By End Use
    • Mexico
      • Pricing Analysis
      • Market Share Analysis, 2024
        • By Method Type
        • By End Use
    • Argentina
      • Pricing Analysis
      • Market Share Analysis, 2024
        • By Method Type
        • By End Use
  17. Market Structure Analysis
    • Competition Dashboard
    • Competition Benchmarking
    • Market Share Analysis of Top Players
      • By Regional
      • By Method Type
      • By End Use
  18. Competition Analysis
    • Competition Deep Dive
      • Bucher Emhart Glass
        • Overview
        • Product Portfolio
        • Profitability by Market Segments (Product/Age /Sales Channel/Region)
        • Sales Footprint
        • Strategy Overview
          • Marketing Strategy
          • Product Strategy
          • Channel Strategy
      • Bottero S.p.A
        • Overview
        • Product Portfolio
        • Profitability by Market Segments (Product/Age /Sales Channel/Region)
        • Sales Footprint
        • Strategy Overview
          • Marketing Strategy
          • Product Strategy
          • Channel Strategy
      • Heye International
        • Overview
        • Product Portfolio
        • Profitability by Market Segments (Product/Age /Sales Channel/Region)
        • Sales Footprint
        • Strategy Overview
          • Marketing Strategy
          • Product Strategy
          • Channel Strategy
      • Sklostroj
        • Overview
        • Product Portfolio
        • Profitability by Market Segments (Product/Age /Sales Channel/Region)
        • Sales Footprint
        • Strategy Overview
          • Marketing Strategy
          • Product Strategy
          • Channel Strategy
      • BDF Industries
        • Overview
        • Product Portfolio
        • Profitability by Market Segments (Product/Age /Sales Channel/Region)
        • Sales Footprint
        • Strategy Overview
          • Marketing Strategy
          • Product Strategy
          • Channel Strategy
      • China Glass Machinery
        • Overview
        • Product Portfolio
        • Profitability by Market Segments (Product/Age /Sales Channel/Region)
        • Sales Footprint
        • Strategy Overview
          • Marketing Strategy
          • Product Strategy
          • Channel Strategy
      • Kanger Glass Technologies
        • Overview
        • Product Portfolio
        • Profitability by Market Segments (Product/Age /Sales Channel/Region)
        • Sales Footprint
        • Strategy Overview
          • Marketing Strategy
          • Product Strategy
          • Channel Strategy
      • Tianjin Jingpeng
        • Overview
        • Product Portfolio
        • Profitability by Market Segments (Product/Age /Sales Channel/Region)
        • Sales Footprint
        • Strategy Overview
          • Marketing Strategy
          • Product Strategy
          • Channel Strategy
      • Horn Glass Industries
        • Overview
        • Product Portfolio
        • Profitability by Market Segments (Product/Age /Sales Channel/Region)
        • Sales Footprint
        • Strategy Overview
          • Marketing Strategy
          • Product Strategy
          • Channel Strategy
      • Olivotto Glass Technologies
        • Overview
        • Product Portfolio
        • Profitability by Market Segments (Product/Age /Sales Channel/Region)
        • Sales Footprint
        • Strategy Overview
          • Marketing Strategy
          • Product Strategy
          • Channel Strategy
  19. Assumptions & Acronyms Used
  20. Research Methodology

List of Tables

  • Table 1: Global Market Value (USD Billion) Forecast by Region, 2020 to 2035
  • Table 2: Global Market Volume (Units) Forecast by Region, 2020 to 2035
  • Table 3: Global Market Value (USD Billion) Forecast by Method Type, 2020 to 2035
  • Table 4: Global Market Volume (Units) Forecast by Method Type, 2020 to 2035
  • Table 5: Global Market Value (USD Billion) Forecast by End Use, 2020 to 2035
  • Table 6: Global Market Volume (Units) Forecast by End Use, 2020 to 2035
  • Table 7: North America Market Value (USD Billion) Forecast by Country, 2020 to 2035
  • Table 8: North America Market Volume (Units) Forecast by Country, 2020 to 2035
  • Table 9: North America Market Value (USD Billion) Forecast by Method Type, 2020 to 2035
  • Table 10: North America Market Volume (Units) Forecast by Method Type, 2020 to 2035
  • Table 11: North America Market Value (USD Billion) Forecast by End Use, 2020 to 2035
  • Table 12: North America Market Volume (Units) Forecast by End Use, 2020 to 2035
  • Table 13: Latin America Market Value (USD Billion) Forecast by Country, 2020 to 2035
  • Table 14: Latin America Market Volume (Units) Forecast by Country, 2020 to 2035
  • Table 15: Latin America Market Value (USD Billion) Forecast by Method Type, 2020 to 2035
  • Table 16: Latin America Market Volume (Units) Forecast by Method Type, 2020 to 2035
  • Table 17: Latin America Market Value (USD Billion) Forecast by End Use, 2020 to 2035
  • Table 18: Latin America Market Volume (Units) Forecast by End Use, 2020 to 2035
  • Table 19: Western Europe Market Value (USD Billion) Forecast by Country, 2020 to 2035
  • Table 20: Western Europe Market Volume (Units) Forecast by Country, 2020 to 2035
  • Table 21: Western Europe Market Value (USD Billion) Forecast by Method Type, 2020 to 2035
  • Table 22: Western Europe Market Volume (Units) Forecast by Method Type, 2020 to 2035
  • Table 23: Western Europe Market Value (USD Billion) Forecast by End Use, 2020 to 2035
  • Table 24: Western Europe Market Volume (Units) Forecast by End Use, 2020 to 2035
  • Table 25: Eastern Europe Market Value (USD Billion) Forecast by Country, 2020 to 2035
  • Table 26: Eastern Europe Market Volume (Units) Forecast by Country, 2020 to 2035
  • Table 27: Eastern Europe Market Value (USD Billion) Forecast by Method Type, 2020 to 2035
  • Table 28: Eastern Europe Market Volume (Units) Forecast by Method Type, 2020 to 2035
  • Table 29: Eastern Europe Market Value (USD Billion) Forecast by End Use, 2020 to 2035
  • Table 30: Eastern Europe Market Volume (Units) Forecast by End Use, 2020 to 2035
  • Table 31: East Asia Market Value (USD Billion) Forecast by Country, 2020 to 2035
  • Table 32: East Asia Market Volume (Units) Forecast by Country, 2020 to 2035
  • Table 33: East Asia Market Value (USD Billion) Forecast by Method Type, 2020 to 2035
  • Table 34: East Asia Market Volume (Units) Forecast by Method Type, 2020 to 2035
  • Table 35: East Asia Market Value (USD Billion) Forecast by End Use, 2020 to 2035
  • Table 36: East Asia Market Volume (Units) Forecast by End Use, 2020 to 2035
  • Table 37: South Asia & Pacific Market Value (USD Billion) Forecast by Country, 2020 to 2035
  • Table 38: South Asia & Pacific Market Volume (Units) Forecast by Country, 2020 to 2035
  • Table 39: South Asia & Pacific Market Value (USD Billion) Forecast by Method Type, 2020 to 2035
  • Table 40: South Asia & Pacific Market Volume (Units) Forecast by Method Type, 2020 to 2035
  • Table 41: South Asia & Pacific Market Value (USD Billion) Forecast by End Use, 2020 to 2035
  • Table 42: South Asia & Pacific Market Volume (Units) Forecast by End Use, 2020 to 2035
  • Table 43: Middle East and Africa Market Value (USD Billion) Forecast by Country, 2020 to 2035
  • Table 44: Middle East and Africa Market Volume (Units) Forecast by Country, 2020 to 2035
  • Table 45: Middle East and Africa Market Value (USD Billion) Forecast by Method Type, 2020 to 2035
  • Table 46: Middle East and Africa Market Volume (Units) Forecast by Method Type, 2020 to 2035
  • Table 47: Middle East and Africa Market Value (USD Billion) Forecast by End Use, 2020 to 2035
  • Table 48: Middle East and Africa Market Volume (Units) Forecast by End Use, 2020 to 2035

List of Figures

  • Figure 1: Global Market Volume (Units) Forecast 2020 to 2035
  • Figure 2: Global Market Pricing Analysis
  • Figure 3: Global Market Value (USD Billion) Forecast 2020 to 2035
  • Figure 4: Global Market Value Share and BPS Analysis by Method Type, 2025 and 2035
  • Figure 5: Global Market Y-o-Y Growth Comparison by Method Type, 2025 to 2035
  • Figure 6: Global Market Attractiveness Analysis by Method Type
  • Figure 7: Global Market Value Share and BPS Analysis by End Use, 2025 and 2035
  • Figure 8: Global Market Y-o-Y Growth Comparison by End Use, 2025 to 2035
  • Figure 9: Global Market Attractiveness Analysis by End Use
  • Figure 10: Global Market Value (USD Billion) Share and BPS Analysis by Region, 2025 and 2035
  • Figure 11: Global Market Y-o-Y Growth Comparison by Region, 2025 to 2035
  • Figure 12: Global Market Attractiveness Analysis by Region
  • Figure 13: North America Market Incremental $ Opportunity, 2025 to 2035
  • Figure 14: Latin America Market Incremental $ Opportunity, 2025 to 2035
  • Figure 15: Western Europe Market Incremental $ Opportunity, 2025 to 2035
  • Figure 16: Eastern Europe Market Incremental $ Opportunity, 2025 to 2035
  • Figure 17: East Asia Market Incremental $ Opportunity, 2025 to 2035
  • Figure 18: South Asia & Pacific Market Incremental $ Opportunity, 2025 to 2035
  • Figure 19: Middle East and Africa Market Incremental $ Opportunity, 2025 to 2035
  • Figure 20: North America Market Value Share and BPS Analysis by Country, 2025 and 2035
  • Figure 21: North America Market Value Share and BPS Analysis by Method Type, 2025 and 2035
  • Figure 22: North America Market Y-o-Y Growth Comparison by Method Type, 2025 to 2035
  • Figure 23: North America Market Attractiveness Analysis by Method Type
  • Figure 24: North America Market Value Share and BPS Analysis by End Use, 2025 and 2035
  • Figure 25: North America Market Y-o-Y Growth Comparison by End Use, 2025 to 2035
  • Figure 26: North America Market Attractiveness Analysis by End Use
  • Figure 27: Latin America Market Value Share and BPS Analysis by Country, 2025 and 2035
  • Figure 28: Latin America Market Value Share and BPS Analysis by Method Type, 2025 and 2035
  • Figure 29: Latin America Market Y-o-Y Growth Comparison by Method Type, 2025 to 2035
  • Figure 30: Latin America Market Attractiveness Analysis by Method Type
  • Figure 31: Latin America Market Value Share and BPS Analysis by End Use, 2025 and 2035
  • Figure 32: Latin America Market Y-o-Y Growth Comparison by End Use, 2025 to 2035
  • Figure 33: Latin America Market Attractiveness Analysis by End Use
  • Figure 34: Western Europe Market Value Share and BPS Analysis by Country, 2025 and 2035
  • Figure 35: Western Europe Market Value Share and BPS Analysis by Method Type, 2025 and 2035
  • Figure 36: Western Europe Market Y-o-Y Growth Comparison by Method Type, 2025 to 2035
  • Figure 37: Western Europe Market Attractiveness Analysis by Method Type
  • Figure 38: Western Europe Market Value Share and BPS Analysis by End Use, 2025 and 2035
  • Figure 39: Western Europe Market Y-o-Y Growth Comparison by End Use, 2025 to 2035
  • Figure 40: Western Europe Market Attractiveness Analysis by End Use
  • Figure 41: Eastern Europe Market Value Share and BPS Analysis by Country, 2025 and 2035
  • Figure 42: Eastern Europe Market Value Share and BPS Analysis by Method Type, 2025 and 2035
  • Figure 43: Eastern Europe Market Y-o-Y Growth Comparison by Method Type, 2025 to 2035
  • Figure 44: Eastern Europe Market Attractiveness Analysis by Method Type
  • Figure 45: Eastern Europe Market Value Share and BPS Analysis by End Use, 2025 and 2035
  • Figure 46: Eastern Europe Market Y-o-Y Growth Comparison by End Use, 2025 to 2035
  • Figure 47: Eastern Europe Market Attractiveness Analysis by End Use
  • Figure 48: East Asia Market Value Share and BPS Analysis by Country, 2025 and 2035
  • Figure 49: East Asia Market Value Share and BPS Analysis by Method Type, 2025 and 2035
  • Figure 50: East Asia Market Y-o-Y Growth Comparison by Method Type, 2025 to 2035
  • Figure 51: East Asia Market Attractiveness Analysis by Method Type
  • Figure 52: East Asia Market Value Share and BPS Analysis by End Use, 2025 and 2035
  • Figure 53: East Asia Market Y-o-Y Growth Comparison by End Use, 2025 to 2035
  • Figure 54: East Asia Market Attractiveness Analysis by End Use
  • Figure 55: South Asia & Pacific Market Value Share and BPS Analysis by Country, 2025 and 2035
  • Figure 56: South Asia & Pacific Market Value Share and BPS Analysis by Method Type, 2025 and 2035
  • Figure 57: South Asia & Pacific Market Y-o-Y Growth Comparison by Method Type, 2025 to 2035
  • Figure 58: South Asia & Pacific Market Attractiveness Analysis by Method Type
  • Figure 59: South Asia & Pacific Market Value Share and BPS Analysis by End Use, 2025 and 2035
  • Figure 60: South Asia & Pacific Market Y-o-Y Growth Comparison by End Use, 2025 to 2035
  • Figure 61: South Asia & Pacific Market Attractiveness Analysis by End Use
  • Figure 62: Middle East and Africa Market Value Share and BPS Analysis by Country, 2025 and 2035
  • Figure 63: Middle East and Africa Market Value Share and BPS Analysis by Method Type, 2025 and 2035
  • Figure 64: Middle East and Africa Market Y-o-Y Growth Comparison by Method Type, 2025 to 2035
  • Figure 65: Middle East and Africa Market Attractiveness Analysis by Method Type
  • Figure 66: Middle East and Africa Market Value Share and BPS Analysis by End Use, 2025 and 2035
  • Figure 67: Middle East and Africa Market Y-o-Y Growth Comparison by End Use, 2025 to 2035
  • Figure 68: Middle East and Africa Market Attractiveness Analysis by End Use
  • Figure 69: Global Market - Tier Structure Analysis
  • Figure 70: Global Market - Company Share Analysis

Frequently Asked Questions

What is the projected size of the glass forming machine market in 2025?

The market is valued at USD 2.6 billion in 2025.

What is the outlook on glass forming machine demand by 2035?

The market is forecasted to reach USD 4.1 billion by 2035, reflecting a CAGR of 4.8%.

Which method type will lead the glass forming machine market in 2025?

The blow and blow method is expected to lead with 52% of the market share in 2025.

What is the projected share of the food & beverage industry in end-use applications by 2025?

The food & beverage segment is anticipated to hold a 35% market share in 2025.

Which country is projected to have the fastest-growing glass forming machine market?

Japan is expected to be the fastest-growing country with a CAGR of 4.9% from 2025 to 2035.

Explore Similar Insights

Future Market Insights

Glass Forming Machine Market