

- Market Size (2026)
- USD 45.25 Bn
- Forecast (2036)
- USD 127.07 Bn
- CAGR (2026 to 2036)
- 4.5%
Glass Tempering System Market Outlook for 2026 to 2036
Summary of the Glass Tempering System Market
- Demand and Growth Drivers
- Sustained construction activity and architectural glazing demand across commercial and residential building segments is driving procurement of flat and bent glass tempering systems.
- Automotive safety glass requirements and growing vehicle production in East Asia are maintaining demand for automotive-grade tempering equipment.
- Solar panel manufacturing expansion is creating new demand for glass tempering systems capable of processing solar cover glass with precise flatness and strength specifications.
- Product and Segment View
- Flat glass tempering holds 33.8% of the application segment in 2026, reflecting the dominant volume of flat tempered glass used in architectural glazing, interior partitions, and automotive applications.
- Automotive window accounts for 26.7% of the end use segment, driven by safety glass requirements and vehicle production volumes across global automotive manufacturing.
- Fully automatic systems represent 48.0% of the automation level segment, reflecting glass processor preference for high-throughput, consistent-quality production capability.
- Geography and Competitive Outlook
- South Korea leads at 4.2% CAGR through 2036, driven by electronics display glass processing, automotive glass production, and construction sector demand.
- Japan follows at 4.1%, reflecting advanced automotive glass manufacturing, electronics display processing, and solar glass production.
- Glaston Corporation and LiSEC Austria GmbH maintain competitive leadership through comprehensive tempering system portfolios, advanced automation, and global service infrastructure.
- Analyst Opinion
- The glass tempering system market is evolving toward higher automation, energy efficiency, and precision control as glass processors seek to reduce operating costs and meet tighter quality specifications.
- Adoption is increasing due to expanding safety glass regulations in construction and automotive sectors, which mandate tempered glass in applications where human safety is a consideration.
- Demand is also shaped by the growth of solar panel manufacturing, where tempered cover glass must meet stringent flatness, transmittance, and mechanical strength requirements.
- Companies that can deliver fully automated systems with advanced convection heating, precise quench control, and digital process monitoring are positioned to capture upgrade demand from glass processors seeking to improve yield and energy efficiency.
Key Takeaways
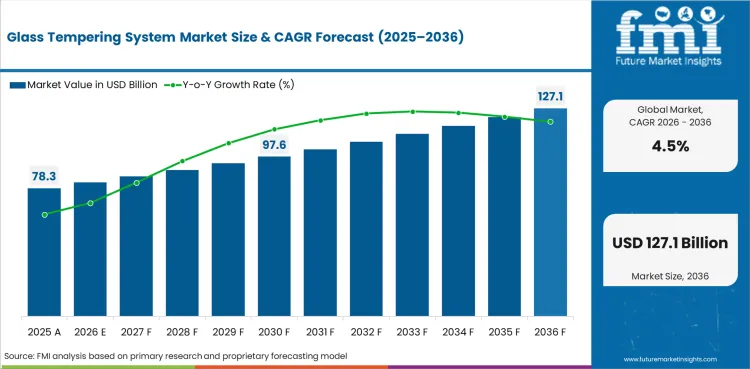
- The glass tempering system market was valued at USD 78.30 billion in 2025.
- By 2036, the Glass Tempering System Market is expected to be worth USD 127.07 billion.
- From 2026 to 2036, the market is projected to expand at a CAGR of 4.5%.
- The market is projected to create an incremental opportunity of USD 45.25 billion between 2026 and 2036.
- In 2026, flat glass tempering is expected to account for 33.8% of the application segment, driven by sustained demand from architectural glazing, facade construction, and automotive windshield and side glass production.
- South Korea (4.2%) and Japan (4.1%) are two of the fastest growing markets in the world.
Glass Tempering System Market Definition
The glass tempering system market encompasses industrial equipment and production systems used to heat-treat flat, bent, and specialty glass to create tempered safety glass for automotive, architectural, furniture, electronics, and solar applications. This includes horizontal and vertical tempering furnaces, convection heating quench exchange (CHQE) systems, chemical tempering equipment, and associated automation and control systems used by glass processors and manufacturers.
Glass Tempering System Market Inclusions
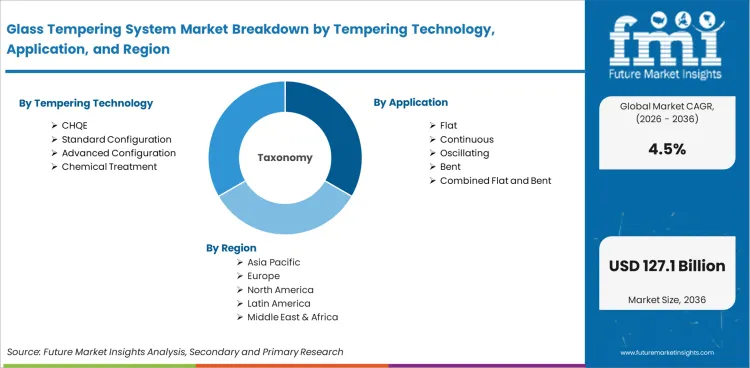
Market scope covers all commercially traded glass tempering systems categorized by tempering technology (CHQE, standard configuration, advanced configuration, chemical treatment), application (flat, continuous, oscillating, bent, combined flat and bent), end use (automotive window, architectural, furniture, electronics, solar applications, others), and automation level (fully automatic, semi-automatic, manual). Revenue is tracked from 2026 to 2036.
Glass Tempering System Market Exclusions
The scope does not include glass melting furnaces, float glass production lines, laminated glass processing equipment, or glass coating and surface treatment systems without integrated tempering capability.
Glass Tempering System Market Research Methodology
- Primary Research: Interviews with industry practitioners, product specialists, and procurement managers across key markets.
- Desk Research: Compilation of regulatory filings, industry association data, and manufacturer disclosures.
- Market Sizing and Forecasting: Bottom-up aggregation across segments and regions with adoption curve modeling.
- Data Validation: Quarterly reconciliation against industry production data and manufacturer reported figures.
Why is the Glass Tempering System Market Growing?
- Safety glass regulations in construction and automotive sectors are creating sustained compliance-driven demand for glass tempering equipment.
- Solar panel manufacturing expansion is generating new application demand for tempering systems capable of processing large-format, high-specification solar cover glass.
Growth reflects the structural demand for tempered safety glass across construction, automotive, electronics, and solar applications. Building codes in developed markets mandate tempered glass for overhead glazing, shower enclosures, balustrades, and facades, creating compliance-driven procurement of flat and bent glass tempering systems. The automotive sector requires tempered side and rear glass for all vehicle platforms, sustaining equipment demand tied to global vehicle production volumes.
Adoption is increasing due to the transition toward fully automated tempering systems that improve production consistency, reduce energy consumption, and enable digital process control. Fully automatic systems, which account for 48.0% of the automation level segment, incorporate automated loading, heating, quenching, and unloading sequences with integrated quality inspection. These systems reduce operator dependency and improve yield rates in high-volume glass processing operations.
The competitive landscape includes European system manufacturers with global presence, Chinese equipment producers with competitive pricing, and specialist companies focused on specific application segments. Glaston Corporation leads through its comprehensive tempering and heat treatment product portfolio, while LiSEC Austria GmbH competes through integrated glass processing lines. Chinese manufacturers Luoyang Landglass and Luoyang North Glass Technology have gained market share through competitive pricing and expanding international distribution.
Market Segmentation Analysis
- CHQE leads the tempering technology segment with 33.8% share in 2026.
- Flat leads the application segment at 33.8%,reflecting concentrated demand in this category.
The glass tempering system market is segmented by tempering technology (CHQE, Standard Configuration, Advanced Configuration, Chemical Treatment); application (Flat, Continuous, Oscillating, Bent, Combined Flat and Bent); end use (Automotive Window, Architectural, Furniture, Electronics, Solar Applications, Others); automation level (Fully Automatic, Semi-Automatic, Manual).
Insights into the CHQE tempering Technology Segment
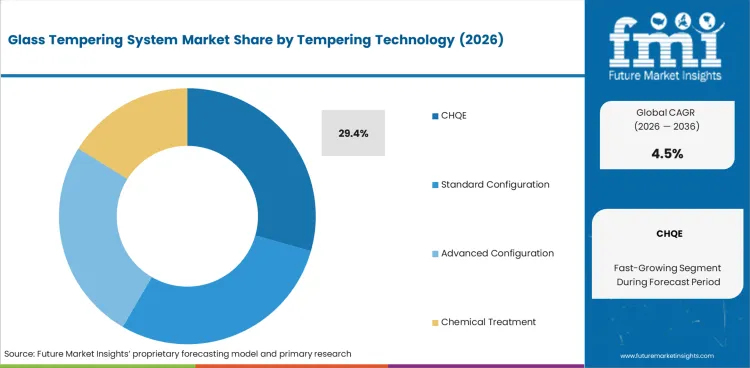
In 2026, chqe is expected to lead the tempering technology segment. Demand is shaped by sustained demand from architectural glazing, facade construction, and automotive windshield and side glass production. This segment maintains its position through established procurement channels and performance requirements aligned with end user operational standards.
Insights into the Flat application Segment
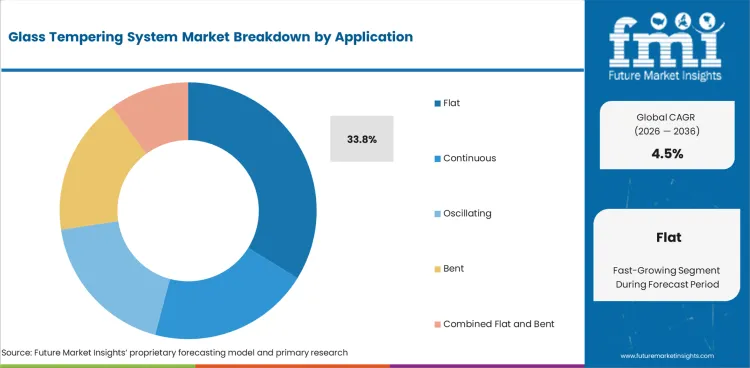
Flat leads the application segment with 33.8% share in 2026. Adoption in this segment reflects concentration of demand across established verticals where product performance, regulatory compliance, and procurement scale influence purchasing decisions.
Glass Tempering System Market Drivers, Restraints, and Opportunities
- Building safety codes and automotive safety glass regulations create compliance-driven demand for glass tempering equipment across all major construction and vehicle markets.
- High capital cost of fully automated tempering systems constrains procurement to established glass processors with sufficient production volume to justify equipment investment.
- Solar panel manufacturing growth is creating a new equipment demand channel with distinct glass processing specifications.
The glass tempering system market is shaped by safety glass regulations, construction and automotive industry cycles, and the emerging demand from solar glass manufacturing. Equipment replacement and automation upgrade cycles provide incremental growth beyond new capacity additions.
Safety Glass Regulation as a Compliance Driver
Demand is shaped by building codes and automotive safety regulations that mandate tempered glass in applications where breakage could cause injury. These regulatory requirements create non-discretionary demand for tempering capability among glass processors serving construction and automotive supply chains.
Capital Intensity and Automation Upgrade Cycles
Adoption is influenced by the high capital cost of glass tempering systems, particularly fully automated lines with advanced convection heating and process control. Glass processors evaluate equipment purchases based on production volume requirements, energy efficiency improvements, and quality yield enhancement relative to existing equipment.
Solar Glass Manufacturing Expansion
Growth reflects the expansion of solar panel manufacturing, where tempered cover glass must meet precise specifications for flatness, light transmittance, and mechanical strength. Solar glass tempering requires specific process parameters and equipment configurations, creating a differentiated demand segment for tempering system manufacturers.
Analysis of Glass Tempering System Market By Key Countries
.webp "Top Country Growth Comparison Glass Tempering System Market Cagr (2026 2036)")
| Country | CAGR |
|---|---|
| South Korea | 4.2% |
| Japan | 4.1% |
| USA | 3.9% |
| European Union | 3.7% |
| UK | 3.5% |
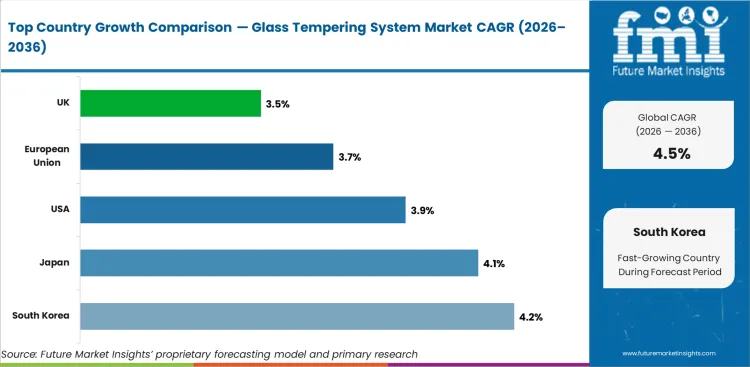
- South Korea leads at 4.2% CAGR through 2036, driven by electronics display glass, automotive glass production, and construction sector investment.
- Japan at 4.1% reflects advanced automotive glass manufacturing, electronics display processing, and solar glass production demand.
- The USA at 3.9% is shaped by commercial construction activity, automotive safety glass requirements, and solar manufacturing investment.
- The European Union at 3.7% and the UK at 3.5% maintain growth through architectural glazing demand and automotive production.
The global glass tempering system market is projected to expand at a CAGR of 4.5% from 2026 to 2036. Growth across regions reflects differences in construction activity, automotive production volumes, and solar manufacturing investment.
Demand Outlook for Glass Tempering System Market in South Korea
South Korea is projected to grow at 4.2% CAGR through 2036, driven by electronics display glass processing demand, automotive glass production, and construction sector investment.
- Electronics display glass processing generates demand for precision tempering equipment.
- Automotive glass production sustains procurement of automotive-grade tempering systems.
- Construction sector investment is driving architectural glass tempering demand.
Future Outlook for Glass Tempering System Market in Japan
Japan is expected to grow at 4.1% CAGR through 2036, supported by advanced automotive glass manufacturing, electronics display processing, and growing solar panel glass production.
- Advanced automotive glass manufacturing sustains demand for high-specification tempering systems.
- Electronics display processing requires precision glass heat treatment capability.
- Solar panel glass production is expanding the application base for tempering equipment.
Opportunity Analysis of Glass Tempering System Market in the United States
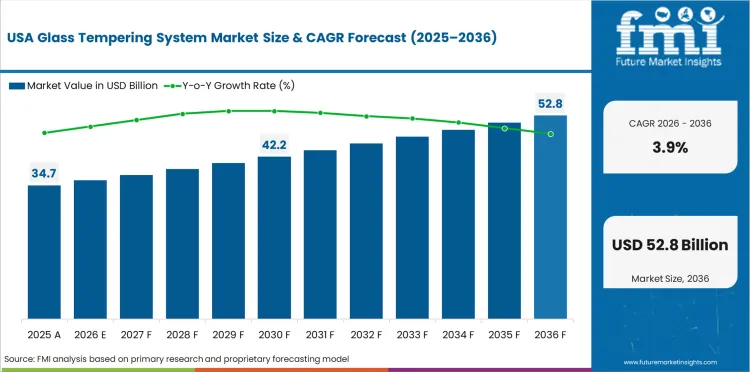
The USA is projected to grow at 3.9% CAGR through 2036, driven by commercial construction activity, automotive safety glass requirements, and domestic solar manufacturing investment.
- Commercial construction drives demand for architectural tempered glass processing capacity.
- Automotive safety glass requirements sustain equipment demand tied to vehicle production.
- Solar manufacturing investment is creating new demand for solar glass tempering capability.
In-depth Analysis of Glass Tempering System Market in the European Union
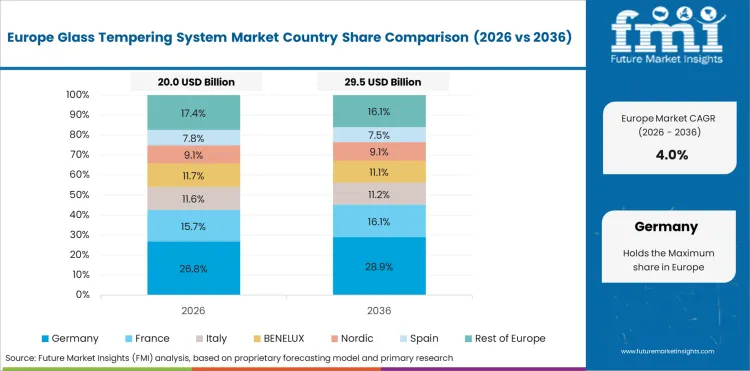
The European Union is expected to register 3.7% CAGR through 2036, shaped by energy-efficient building regulations, automotive production, and solar glass manufacturing expansion.
- Energy-efficient building regulations drive demand for high-performance architectural glazing.
- Automotive production sustains equipment demand for safety glass processing.
- Solar glass manufacturing expansion creates new tempering equipment procurement.
Sales Analysis of Glass Tempering System Market in the United Kingdom
The UK is projected to grow at 3.5% CAGR through 2036, supported by construction sector activity, facade renovation demand, and automotive glass processing requirements.
- Construction sector activity generates demand for architectural glass tempering capacity.
- Facade renovation and retrofit programs sustain tempered glass processing volumes.
- Automotive glass processing requirements maintain baseline equipment demand.
Competitive Landscape and Strategic Positioning
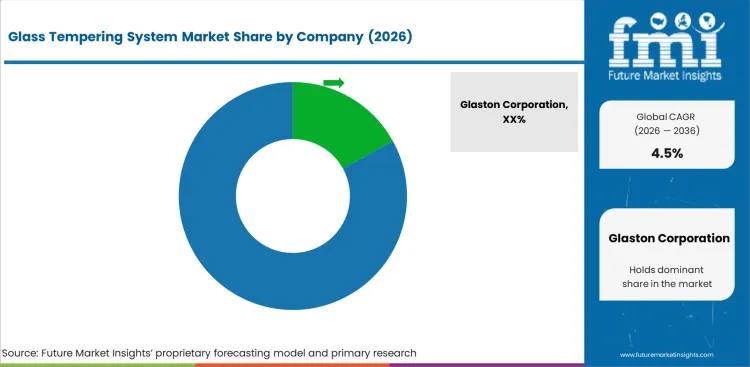
- Glaston Corporation leads through the most comprehensive glass tempering and heat treatment system portfolio globally, with strong service network and digital process control capabilities.
- LiSEC Austria GmbH competes through integrated glass processing line solutions and strong European market presence.
- Chinese manufacturers Luoyang Landglass and Luoyang North Glass Technology are gaining global share through competitive pricing and expanding international distribution.
Glaston Corporation holds the leading position through its broad portfolio of flat, bent, and automotive glass tempering systems with advanced convection heating technology. The company's digital process monitoring and control capabilities provide differentiation in quality-critical applications.
LiSEC Austria GmbH competes through integrated glass processing lines that combine cutting, edging, and tempering in unified production workflows. The company's strong European installed base and service infrastructure support competitive positioning.
Chinese manufacturers have expanded beyond domestic markets, with Luoyang Landglass and Luoyang North Glass Technology offering competitively priced tempering systems for international glass processors. Saint-Gobain S.A. participates as both a glass manufacturer and equipment technology provider.
Entry barriers include the engineering complexity of high-temperature furnace design, the need for precise quench control systems, established relationships with glass processors, and the importance of global service and spare parts infrastructure.
Key Companies in the Glass Tempering System Market
Key global companies leading the glass tempering system market include:
- Glaston Corporation (Finland), LiSEC Austria GmbH (Austria), Saint-Gobain S.A. (France) lead the market through broad product portfolios, established customer relationships, and global manufacturing and distribution capabilities.
- Luoyang Landglass Technology Co. Ltd. (China), Luoyang North Glass Technology Co. Ltd. (China), Keraglass Industries Srl (Italy) maintain strong regional positions through specialized expertise and localized service capabilities.
- SAS VILUX (France), CoolTemper Ltd (UK), Lambert GT Services Ltd (UK), IGE Glass Technologies Inc. (USA) are gaining traction through focused product innovation and targeted market positioning.
Competitive Benchmarking: Glass Tempering System Market
| Company | System Product Range | Automation Capability | Service Network | Geographic Footprint |
|---|---|---|---|---|
| Glaston Corporation | High | Strong | Strong | Global |
| LiSEC Austria GmbH | High | Strong | Strong | Europe, Global |
| Saint-Gobain S.A. | High | Strong | Strong | Global |
| Luoyang Landglass Technology | High | Strong | Medium | Asia, Global |
| Luoyang North Glass Technology | High | Strong | Medium | Asia, Global |
| Keraglass Industries Srl | Medium | Strong | Medium | Europe |
| SAS VILUX | Medium | Medium | Medium | Europe |
| CoolTemper Ltd | Medium | Medium | Low | Europe |
| Lambert GT Services | Low | Medium | Low | Europe |
| IGE Glass Technologies | Medium | Medium | Medium | North America |
Source: Future Market Insights competitive analysis, 2026.
Key Players in the Glass Tempering System Market
Major Global Players
- Glaston Corporation
- LiSEC Austria GmbH
- Luoyang Landglass Technology Co. Ltd.
- Luoyang North Glass Technology Co. Ltd.
- Keraglass Industries Srl
- SAS VILUX
- CoolTemper Ltd
Emerging Players/Startups
- Lambert GT Services Ltd
- IGE Glass Technologies Inc.
- Saint-Gobain S.A.
Report Scope and Coverage
| Parameter | Details |
|---|---|
| Quantitative Units | USD 81.82 billion to USD 127.07 billion, at a CAGR of 4.5% |
| Market Definition | The glass tempering system market encompasses industrial equipment and production systems used to heat-treat flat, bent, and specialty glass to create tempered safety glass for automotive, architectural, furniture, electronics, and solar applications. This includes horizontal and vertical tempering furnaces, convection heating quench exchange (CHQE) systems, chemical tempering equipment, and associated automation and control systems used by glass processors and manufacturers. |
| Regions Covered | North America, Latin America, Europe, East Asia, South Asia and Pacific, Middle East and Africa |
| Countries Covered | South Korea, Japan, USA, European Union, UK, 30 plus countries |
| Key Companies Profiled | Glaston Corporation, LiSEC Austria GmbH, Luoyang Landglass Technology Co. Ltd., Luoyang North Glass Technology Co. Ltd., Keraglass Industries Srl, SAS VILUX, CoolTemper Ltd, Lambert GT Services Ltd, IGE Glass Technologies Inc., Saint-Gobain S.A. |
| Forecast Period | 2026 to 2036 |
| Approach | Hybrid bottom-up and top-down methodology starting with verified transaction data, projecting adoption velocity across segments and regions. |
Market Segmentation Analysis
Glass Tempering System Market Segmented by Tempering Technology:
- CHQE
- Standard Configuration
- Advanced Configuration
- Chemical Treatment
Glass Tempering System Market Segmented by Application:
- Flat
- Continuous
- Oscillating
- Bent
- Combined Flat and Bent
Glass Tempering System Market Segmented by End Use:
- Automotive Window
- Architectural
- Windows And Façade
- Mirror & Partitions
- Furniture
- Electronics
- Smartphone
- Appliances
- Solar Applications
- Others
Glass Tempering System Market Segmented by Automation Level:
- Fully Automatic
- Semi-Automatic
- Manual
Glass Tempering System Market by Region:
- North America
- USA
- Canada
- Mexico
- Latin America
- Brazil
- Chile
- Rest of Latin America
- Western Europe
- Germany
- UK
- Italy
- Spain
- France
- Nordic
- BENELUX
- Rest of Western Europe
- Eastern Europe
- Russia
- Poland
- Hungary
- Balkan & Baltic
- Rest of Eastern Europe
- East Asia
- China
- Japan
- South Korea
- South Asia and Pacific
- India
- ASEAN
- Australia & New Zealand
- Rest of South Asia and Pacific
- Middle East & Africa
- Kingdom of Saudi Arabia
- Other GCC Countries
- Turkiye
- South Africa
- Other African Union
- Rest of Middle East & Africa
Research Sources and Bibliography
- 1. International Organization for Standardization. (2024). ISO 12150: Glass in Building, Thermally Toughened Soda Lime Silicate Safety Glass. ISO.
- 2. European Committee for Standardization. (2025). EN 12150: Glass in Building, Thermally Toughened Soda Lime Silicate Safety Glass Requirements. CEN.
- 3. National Glass Association. (2025). NGA Technical Standards: Tempered Glass Processing and Quality Requirements. NGA.
- 4. International Energy Agency. (2025). IEA Solar PV Manufacturing Outlook: Solar Glass Specifications and Production Trends. IEA.
- 5. World Bank. (2025). World Bank Global Construction Industry Activity Report. World Bank.
This bibliography is provided for reader reference.
This Report Answers
- Estimating the size of the market and revenue projections from 2026 to 2036.
- Segmentation analysis across all product, application, and end use categories.
- Regional and country level insights covering more than 30 markets.
- Technology analysis across key product and process categories.
- Competitive landscape assessment and company benchmarking.
- Investment opportunity identification across high-growth segments and regions.
- Supply chain and distribution channel analysis.
- Data delivery in PDF and Excel formats.
Frequently Asked Questions
What is the global market demand for Glass Tempering System in 2026?
In 2026, the global glass tempering system market is expected to be worth USD 81.82 billion.
How big will the Glass Tempering System Market be in 2036?
By 2036, the glass tempering system market is expected to be worth USD 127.07 billion.
How much is demand for Glass Tempering System expected to grow between 2026 and 2036?
Between 2026 and 2036, the demand for glass tempering system is expected to grow at a CAGR of 4.5%.
Which application segment is likely to lead in 2026?
Flat glass tempering is expected to account for 33.8% of the application segment in 2026, reflecting sustained demand from architectural glazing, facade construction, and automotive windshield and side glass production.
What is causing demand to rise in South Korea?
South Korea is projected to grow at 4.2% CAGR through 2036, reflecting strong sector investment and regulatory support for market adoption.
What is causing demand to rise in Japan?
Japan is projected to grow at 4.1% CAGR through 2036, supported by industry expansion and increasing adoption across key application segments.
What does this report mean by 'Glass Tempering System Market definition'?
The glass tempering system market encompasses industrial equipment and production systems used to heat-treat flat, bent, and specialty glass to create tempered safety glass for automotive, architectural, furniture, electronics, and solar applications. This includes horizontal and vertical tempering furnaces, convection heating quench exchange (CHQE) systems, chemical tempering equipment, and associated automation and control systems used by glass processors and manufacturers.
How does FMI make the Glass Tempering System forecast and validate it?
Forecasting models use a hybrid bottom-up and top-down approach, starting with verified transaction data and checking it against industry production statistics and manufacturer disclosures.
Preview the report firsthand - request a free sample
Get SampleGet the brochure for pricing and purchase details.
Get PDFTable of Content
- Executive Summary
- Global Market Outlook
- Demand-side Trends
- Supply-side Trends
- Technology Roadmap Analysis
- Analysis and Recommendations
- Market Overview
- Market Coverage / Taxonomy
- Market Definition / Scope / Limitations
- Research Methodology
- Chapter Orientation
- Analytical Lens and Working Hypotheses
- Market Structure, Signals, and Trend Drivers
- Benchmarking and Cross-market Comparability
- Market Sizing, Forecasting, and Opportunity Mapping
- Research Design and Evidence Framework
- Desk Research Programme (Secondary Evidence)
- Company Annual and Sustainability Reports
- Peer-reviewed Journals and Academic Literature
- Corporate Websites, Product Literature, and Technical Notes
- Earnings Decks and Investor Briefings
- Statutory Filings and Regulatory Disclosures
- Technical White Papers and Standards Notes
- Trade Journals, Industry Magazines, and Analyst Briefs
- Conference Proceedings, Webinars, and Seminar Materials
- Government Statistics Portals and Public Data Releases
- Press Releases and Reputable Media Coverage
- Specialist Newsletters and Curated Briefings
- Sector Databases and Reference Repositories
- FMI Internal Proprietary Databases and Historical Market Datasets
- Subscription Datasets and Paid Sources
- Social Channels, Communities, and Digital Listening Inputs
- Additional Desk Sources
- Expert Input and Fieldwork (Primary Evidence)
- Primary Modes
- Qualitative Interviews and Expert Elicitation
- Quantitative Surveys and Structured Data Capture
- Blended Approach
- Why Primary Evidence is Used
- Field Techniques
- Interviews
- Surveys
- Focus Groups
- Observational and In-context Research
- Social and Community Interactions
- Stakeholder Universe Engaged
- C-suite Leaders
- Board Members
- Presidents and Vice Presidents
- R&D and Innovation Heads
- Technical Specialists
- Domain Subject-matter Experts
- Scientists
- Physicians and Other Healthcare Professionals
- Governance, Ethics, and Data Stewardship
- Research Ethics
- Data Integrity and Handling
- Primary Modes
- Tooling, Models, and Reference Databases
- Desk Research Programme (Secondary Evidence)
- Data Engineering and Model Build
- Data Acquisition and Ingestion
- Cleaning, Normalisation, and Verification
- Synthesis, Triangulation, and Analysis
- Quality Assurance and Audit Trail
- Market Background
- Market Dynamics
- Drivers
- Restraints
- Opportunity
- Trends
- Scenario Forecast
- Demand in Optimistic Scenario
- Demand in Likely Scenario
- Demand in Conservative Scenario
- Opportunity Map Analysis
- Product Life Cycle Analysis
- Supply Chain Analysis
- Investment Feasibility Matrix
- Value Chain Analysis
- PESTLE and Porter’s Analysis
- Regulatory Landscape
- Regional Parent Market Outlook
- Production and Consumption Statistics
- Import and Export Statistics
- Market Dynamics
- Global Market Analysis 2021 to 2025 and Forecast, 2026 to 2036
- Historical Market Size Value (USD Million) Analysis, 2021 to 2025
- Current and Future Market Size Value (USD Million) Projections, 2026 to 2036
- Y-o-Y Growth Trend Analysis
- Absolute $ Opportunity Analysis
- Global Market Pricing Analysis 2021 to 2025 and Forecast 2026 to 2036
- Global Market Analysis 2021 to 2025 and Forecast 2026 to 2036, By Tempering Technology
- Introduction / Key Findings
- Historical Market Size Value (USD Million) Analysis By Tempering Technology , 2021 to 2025
- Current and Future Market Size Value (USD Million) Analysis and Forecast By Tempering Technology , 2026 to 2036
- CHQE
- Standard Configuration
- Advanced Configuration
- Chemical Treatment
- CHQE
- Y-o-Y Growth Trend Analysis By Tempering Technology , 2021 to 2025
- Absolute $ Opportunity Analysis By Tempering Technology , 2026 to 2036
- Global Market Analysis 2021 to 2025 and Forecast 2026 to 2036, By Application
- Introduction / Key Findings
- Historical Market Size Value (USD Million) Analysis By Application, 2021 to 2025
- Current and Future Market Size Value (USD Million) Analysis and Forecast By Application, 2026 to 2036
- Flat
- Continuous
- Oscillating
- Bent
- Combined Flat and Bent
- Flat
- Y-o-Y Growth Trend Analysis By Application, 2021 to 2025
- Absolute $ Opportunity Analysis By Application, 2026 to 2036
- Global Market Analysis 2021 to 2025 and Forecast 2026 to 2036, By End Use
- Introduction / Key Findings
- Historical Market Size Value (USD Million) Analysis By End Use, 2021 to 2025
- Current and Future Market Size Value (USD Million) Analysis and Forecast By End Use, 2026 to 2036
- Automotive Window
- Architectural
- Windows And Façade
- Mirror & Partitions
- Furniture
- Electronics
- Smartphone
- Appliances
- Solar Applications
- Others
- Automotive Window
- Y-o-Y Growth Trend Analysis By End Use, 2021 to 2025
- Absolute $ Opportunity Analysis By End Use, 2026 to 2036
- Global Market Analysis 2021 to 2025 and Forecast 2026 to 2036, By Automation Level
- Introduction / Key Findings
- Historical Market Size Value (USD Million) Analysis By Automation Level, 2021 to 2025
- Current and Future Market Size Value (USD Million) Analysis and Forecast By Automation Level, 2026 to 2036
- Fully Automatic
- Semi-Automatic
- Manual
- Fully Automatic
- Y-o-Y Growth Trend Analysis By Automation Level, 2021 to 2025
- Absolute $ Opportunity Analysis By Automation Level, 2026 to 2036
- Global Market Analysis 2021 to 2025 and Forecast 2026 to 2036, By Region
- Introduction
- Historical Market Size Value (USD Million) Analysis By Region, 2021 to 2025
- Current Market Size Value (USD Million) Analysis and Forecast By Region, 2026 to 2036
- North America
- Latin America
- Western Europe
- Eastern Europe
- East Asia
- South Asia and Pacific
- Middle East & Africa
- Market Attractiveness Analysis By Region
- North America Market Analysis 2021 to 2025 and Forecast 2026 to 2036, By Country
- Historical Market Size Value (USD Million) Trend Analysis By Market Taxonomy, 2021 to 2025
- Market Size Value (USD Million) Forecast By Market Taxonomy, 2026 to 2036
- By Country
- USA
- Canada
- Mexico
- By Tempering Technology
- By Application
- By End Use
- By Automation Level
- By Country
- Market Attractiveness Analysis
- By Country
- By Tempering Technology
- By Application
- By End Use
- By Automation Level
- Key Takeaways
- Latin America Market Analysis 2021 to 2025 and Forecast 2026 to 2036, By Country
- Historical Market Size Value (USD Million) Trend Analysis By Market Taxonomy, 2021 to 2025
- Market Size Value (USD Million) Forecast By Market Taxonomy, 2026 to 2036
- By Country
- Brazil
- Chile
- Rest of Latin America
- By Tempering Technology
- By Application
- By End Use
- By Automation Level
- By Country
- Market Attractiveness Analysis
- By Country
- By Tempering Technology
- By Application
- By End Use
- By Automation Level
- Key Takeaways
- Western Europe Market Analysis 2021 to 2025 and Forecast 2026 to 2036, By Country
- Historical Market Size Value (USD Million) Trend Analysis By Market Taxonomy, 2021 to 2025
- Market Size Value (USD Million) Forecast By Market Taxonomy, 2026 to 2036
- By Country
- Germany
- UK
- Italy
- Spain
- France
- Nordic
- BENELUX
- Rest of Western Europe
- By Tempering Technology
- By Application
- By End Use
- By Automation Level
- By Country
- Market Attractiveness Analysis
- By Country
- By Tempering Technology
- By Application
- By End Use
- By Automation Level
- Key Takeaways
- Eastern Europe Market Analysis 2021 to 2025 and Forecast 2026 to 2036, By Country
- Historical Market Size Value (USD Million) Trend Analysis By Market Taxonomy, 2021 to 2025
- Market Size Value (USD Million) Forecast By Market Taxonomy, 2026 to 2036
- By Country
- Russia
- Poland
- Hungary
- Balkan & Baltic
- Rest of Eastern Europe
- By Tempering Technology
- By Application
- By End Use
- By Automation Level
- By Country
- Market Attractiveness Analysis
- By Country
- By Tempering Technology
- By Application
- By End Use
- By Automation Level
- Key Takeaways
- East Asia Market Analysis 2021 to 2025 and Forecast 2026 to 2036, By Country
- Historical Market Size Value (USD Million) Trend Analysis By Market Taxonomy, 2021 to 2025
- Market Size Value (USD Million) Forecast By Market Taxonomy, 2026 to 2036
- By Country
- China
- Japan
- South Korea
- By Tempering Technology
- By Application
- By End Use
- By Automation Level
- By Country
- Market Attractiveness Analysis
- By Country
- By Tempering Technology
- By Application
- By End Use
- By Automation Level
- Key Takeaways
- South Asia and Pacific Market Analysis 2021 to 2025 and Forecast 2026 to 2036, By Country
- Historical Market Size Value (USD Million) Trend Analysis By Market Taxonomy, 2021 to 2025
- Market Size Value (USD Million) Forecast By Market Taxonomy, 2026 to 2036
- By Country
- India
- ASEAN
- Australia & New Zealand
- Rest of South Asia and Pacific
- By Tempering Technology
- By Application
- By End Use
- By Automation Level
- By Country
- Market Attractiveness Analysis
- By Country
- By Tempering Technology
- By Application
- By End Use
- By Automation Level
- Key Takeaways
- Middle East & Africa Market Analysis 2021 to 2025 and Forecast 2026 to 2036, By Country
- Historical Market Size Value (USD Million) Trend Analysis By Market Taxonomy, 2021 to 2025
- Market Size Value (USD Million) Forecast By Market Taxonomy, 2026 to 2036
- By Country
- Kingdom of Saudi Arabia
- Other GCC Countries
- Turkiye
- South Africa
- Other African Union
- Rest of Middle East & Africa
- By Tempering Technology
- By Application
- By End Use
- By Automation Level
- By Country
- Market Attractiveness Analysis
- By Country
- By Tempering Technology
- By Application
- By End Use
- By Automation Level
- Key Takeaways
- Key Countries Market Analysis
- USA
- Pricing Analysis
- Market Share Analysis, 2025
- By Tempering Technology
- By Application
- By End Use
- By Automation Level
- Canada
- Pricing Analysis
- Market Share Analysis, 2025
- By Tempering Technology
- By Application
- By End Use
- By Automation Level
- Mexico
- Pricing Analysis
- Market Share Analysis, 2025
- By Tempering Technology
- By Application
- By End Use
- By Automation Level
- Brazil
- Pricing Analysis
- Market Share Analysis, 2025
- By Tempering Technology
- By Application
- By End Use
- By Automation Level
- Chile
- Pricing Analysis
- Market Share Analysis, 2025
- By Tempering Technology
- By Application
- By End Use
- By Automation Level
- Germany
- Pricing Analysis
- Market Share Analysis, 2025
- By Tempering Technology
- By Application
- By End Use
- By Automation Level
- UK
- Pricing Analysis
- Market Share Analysis, 2025
- By Tempering Technology
- By Application
- By End Use
- By Automation Level
- Italy
- Pricing Analysis
- Market Share Analysis, 2025
- By Tempering Technology
- By Application
- By End Use
- By Automation Level
- Spain
- Pricing Analysis
- Market Share Analysis, 2025
- By Tempering Technology
- By Application
- By End Use
- By Automation Level
- France
- Pricing Analysis
- Market Share Analysis, 2025
- By Tempering Technology
- By Application
- By End Use
- By Automation Level
- India
- Pricing Analysis
- Market Share Analysis, 2025
- By Tempering Technology
- By Application
- By End Use
- By Automation Level
- ASEAN
- Pricing Analysis
- Market Share Analysis, 2025
- By Tempering Technology
- By Application
- By End Use
- By Automation Level
- Australia & New Zealand
- Pricing Analysis
- Market Share Analysis, 2025
- By Tempering Technology
- By Application
- By End Use
- By Automation Level
- China
- Pricing Analysis
- Market Share Analysis, 2025
- By Tempering Technology
- By Application
- By End Use
- By Automation Level
- Japan
- Pricing Analysis
- Market Share Analysis, 2025
- By Tempering Technology
- By Application
- By End Use
- By Automation Level
- South Korea
- Pricing Analysis
- Market Share Analysis, 2025
- By Tempering Technology
- By Application
- By End Use
- By Automation Level
- Russia
- Pricing Analysis
- Market Share Analysis, 2025
- By Tempering Technology
- By Application
- By End Use
- By Automation Level
- Poland
- Pricing Analysis
- Market Share Analysis, 2025
- By Tempering Technology
- By Application
- By End Use
- By Automation Level
- Hungary
- Pricing Analysis
- Market Share Analysis, 2025
- By Tempering Technology
- By Application
- By End Use
- By Automation Level
- Kingdom of Saudi Arabia
- Pricing Analysis
- Market Share Analysis, 2025
- By Tempering Technology
- By Application
- By End Use
- By Automation Level
- Turkiye
- Pricing Analysis
- Market Share Analysis, 2025
- By Tempering Technology
- By Application
- By End Use
- By Automation Level
- South Africa
- Pricing Analysis
- Market Share Analysis, 2025
- By Tempering Technology
- By Application
- By End Use
- By Automation Level
- USA
- Market Structure Analysis
- Competition Dashboard
- Competition Benchmarking
- Market Share Analysis of Top Players
- By Regional
- By Tempering Technology
- By Application
- By End Use
- By Automation Level
- Competition Analysis
- Competition Deep Dive
- Glaston Corporation
- Overview
- Product Portfolio
- Profitability by Market Segments (Product/Age /Sales Channel/Region)
- Sales Footprint
- Strategy Overview
- Marketing Strategy
- Product Strategy
- Channel Strategy
- LiSEC Austria GmbH
- Luoyang Landglass Technology Co. Ltd.
- Luoyang North Glass Technology Co., Ltd.
- Keraglass Industries Srl
- SAS VILUX
- CoolTemper Ltd
- Lambert GT Services Ltd
- IGE Glass Technologies, Inc
- Saint-Gobain S.A.
- Glaston Corporation
- Competition Deep Dive
- Assumptions & Acronyms Used


