Glass Cloth Electrical Insulation Tape Market Forecast and Outlook (2025-2035)

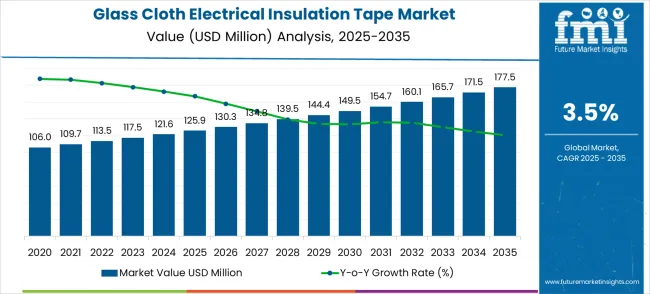
The glass cloth electrical insulation tape market begins its decade journey from a USD 125.9 million foundation in 2025, setting the stage for steady expansion ahead. The first half of the period witnesses consistent momentum building, with market value climbing from USD 130.3 million in 2026 to USD 144.4 million by 2030. This initial phase reflects growing electrical infrastructure development and increasing demand for high-temperature resistant insulation solutions across industrial applications.

The latter half will witness sustained growth dynamics, propelling the market from USD 149.5 million in 2031 to reach USD 177.5 million by 2035. Dollar additions during 2030-2035 maintain steady progression, with annual increments averaging USD 6.6 million compared to USD 3.7 million in the first phase. This progression represents a 41.0% total value increase over the forecast decade.

Market maturation factors include expanding renewable energy infrastructure, aerospace industry growth, and automotive electrification acceleration. The 3.5% compound annual growth rate positions participants to capitalize on USD 51.6 million in additional market value creation. This trajectory signals robust opportunities for specialty tape manufacturers, electrical equipment producers, and industrial insulation suppliers across the global electrical infrastructure landscape.
Quick Stats for Glass Cloth Electrical Insulation Tape Market

  • Glass Cloth Electrical Insulation Tape Market Value (2025): USD 125.9 million
  • Glass Cloth Electrical Insulation Tape Market Forecast Value (2035): USD 177.5 million
  • Glass Cloth Electrical Insulation Tape Market Forecast CAGR: 3.5%
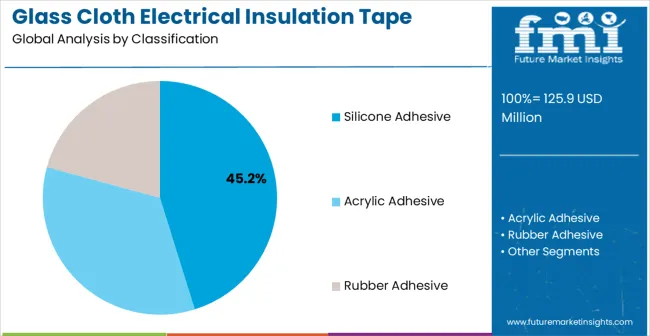
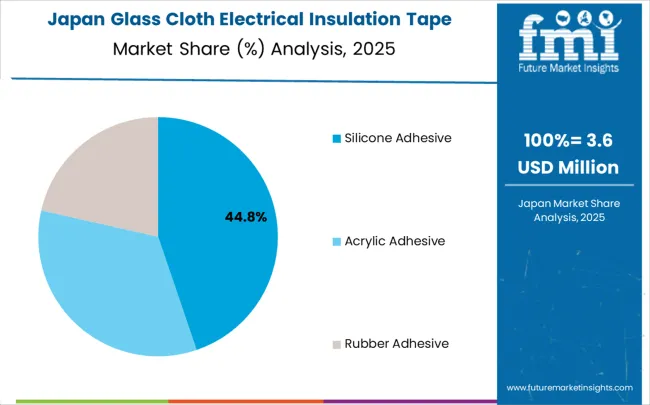
  • Leading Product Type in Glass Cloth Electrical Insulation Tape Market: Silicone Adhesive (45.2%)
  • Key Growth Regions in Glass Cloth Electrical Insulation Tape Market: Asia Pacific, North America, and Europe
  • Top Key Players in Glass Cloth Electrical Insulation Tape Market: 3M, Nitto Denko, IPG, Saint-Gobain, Parafix, Scapa, TERAOKA, Plymouth Rubber, PPI Adhesive Products, Creative Global Services
  • Glass Cloth Electrical Insulation Tape Market Year-over-Year Forecast (2025-2035)

Glass Cloth Electrical Insulation Tape Market Market Value Analysis

Market expansion unfolds through two distinct growth periods with different technological advancement characteristics for each phase. The 2025-2030 foundation period delivers USD 18.5 million in value additions, representing 14.7% growth from the baseline. Market dynamics during this phase center on electrical infrastructure modernization, renewable energy deployment acceleration, and high-temperature application expansion.

The 2030-2035 acceleration period generates USD 33.1 million in incremental value, reflecting 22.9% growth from the 2030 position. This phase exhibits mature market characteristics with enhanced competition, product innovation strategies, and emerging application development initiatives. Dollar contributions shift from foundational infrastructure development to market share optimization and technological advancement.

The competitive landscape evolves from traditional electrical insulation applications to meet advanced high-performance requirements. The first period focuses on improving product quality and expanding the application range. The second period witnesses intensified competition for premium market segments and expansion of geographical territories. Market maturation factors include standardized performance specifications, enhanced temperature resistance capabilities, and cross-industry application development across electrical, automotive, aerospace, and construction sectors.

Why is the Glass Cloth Electrical Insulation Tape Market Growing?

Market expansion rests on four fundamental shifts driving electrical and industrial demand acceleration:

  • Electrical Infrastructure Modernization: Global electrical grid modernization drives demand for high-performance insulation materials capable of withstanding extreme temperatures and electrical stress. Smart grid deployment requires advanced insulation solutions for equipment protection and operational reliability. Power generation facility upgrades necessitate premium insulation tapes for transformer and motor applications.
  • Renewable Energy Expansion: Solar panel installations and wind turbine manufacturing create expanding demand for specialized electrical insulation tapes resistant to environmental exposure. Energy storage system development requires high-temperature insulation materials for battery and inverter applications. Offshore wind power projects demand marine-grade insulation solutions for harsh environment operations.
  • Automotive Electrification: Electric vehicle production acceleration drives demand for specialized insulation tapes capable of high-voltage applications and thermal management. Battery system manufacturing requires fire-resistant insulation materials for safety compliance and performance optimization. Charging infrastructure development creates new application opportunities for electrical insulation solutions.
  • Aerospace Industry Growth: Aircraft manufacturing expansion requires lightweight, high-performance insulation materials meeting stringent aerospace specifications. Space exploration programs demand specialized insulation tapes capable of extreme temperature variations and radiation resistance. Military aerospace applications require certified insulation solutions for critical system protection.

However, growth faces headwinds from raw material price volatility affecting production costs and environmental regulations impacting manufacturing processes. Alternative insulation technology development may create competitive pressure in specific applications. Technical complexity creates adoption barriers requiring specialized expertise for optimal product selection and application.

Segmental Analysis

Primary Classification: Adhesive Type Distribution

  • Silicone Adhesive (45.2% market dominance)
  • Acrylic Adhesive (28.7% market participation)
  • Rubber Adhesive (18.3% market share)
  • Others (7.8% market contribution)

Secondary Breakdown: Application Categories

  • Electrical and Electronics (42.8% application share)
  • Construction (24.1% segment participation)
  • Aerospace (16.4% application focus)
  • Automotive (11.2% segment contribution)
  • Others (5.5% diverse industrial applications)

Geographic Segmentation: Regional Market Distribution
  • Asia Pacific (China leads with 4.7% CAGR, India 4.4% CAGR)
  • Europe (Germany represents 4.0% CAGR market growth)
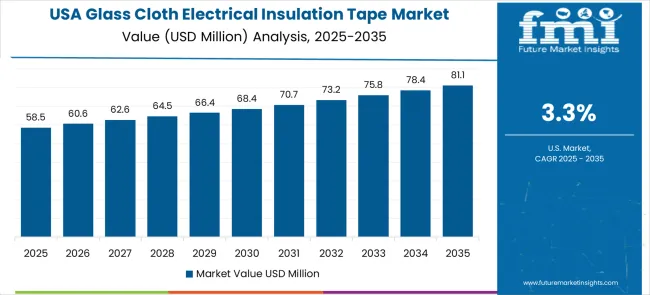
  • North America (USA shows 3.3% CAGR market expansion)
  • Latin America (Brazil contributes 3.7% CAGR market growth)

By Adhesive Type, Silicone Adhesive Segment Accounts for 45.2% Market Share

Glass Cloth Electrical Insulation Tape Market Analysis By Classification

Market Position: Silicone adhesive glass cloth electrical insulation tape establishes clear market leadership through superior high-temperature performance and chemical resistance capabilities. Silicone chemistry provides excellent thermal stability from -65°C to +200°C enabling applications in extreme environment conditions. Adhesive system offers outstanding electrical insulation properties while maintaining flexibility and conformability.

Value Drivers: Advanced silicone formulations extend operational temperature ranges and improve aging resistance for long-term reliability. Chemical resistance properties enable applications in harsh industrial environments with exposure to solvents and chemicals. Flame retardant characteristics meet stringent safety requirements for electrical and aerospace applications.

Competitive Advantages: Silicone adhesive systems offer proven performance history in critical applications reducing qualification time and regulatory approval requirements. Temperature stability enables applications impossible with alternative adhesive chemistries expanding market opportunities. Electrical properties remain stable across temperature ranges ensuring consistent insulation performance.

Market Challenges: Higher material costs compared to acrylic and rubber adhesive alternatives may limit adoption in price-sensitive applications. Processing requirements need specialized equipment and curing conditions increasing manufacturing complexity. Limited recyclability creates disposal challenges in environmentally conscious applications.
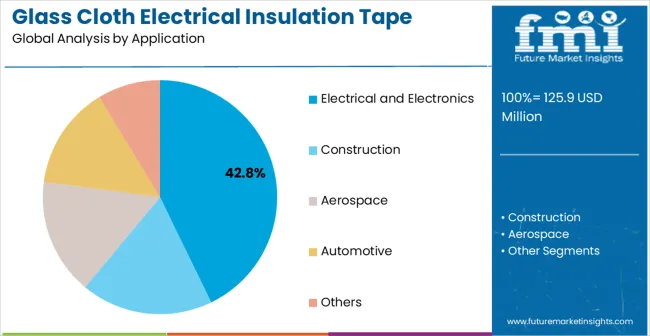
By Application, Electrical and Electronics Segment Accounts for 42.8% Market Share

Glass Cloth Electrical Insulation Tape Market Analysis By Application

Strategic Market Importance: Electrical and electronics applications represent the primary demand driver for glass cloth electrical insulation tape across power generation, transmission, and distribution equipment. Transformer manufacturing, motor winding, and electrical panel assembly require high-performance insulation materials for safety compliance and operational reliability. Quality requirements mandate certified insulation solutions meeting international electrical safety standards.

Market Dynamics Q&A

  • Why dominant? Global electrical infrastructure expansion creates consistent demand for reliable insulation materials across power generation, transmission, and industrial equipment applications.
  • What drives adoption? Safety regulations require certified electrical insulation materials capable of preventing electrical failures and ensuring personnel protection in high-voltage applications.
  • Where is growth? Smart grid deployment and renewable energy integration create expanding opportunities for advanced insulation materials in next-generation electrical equipment.

Business Logic: Electrical applications prioritize safety and reliability, making high-performance insulation tapes essential for equipment protection and regulatory compliance. Performance requirements demand materials providing long-term insulation integrity under electrical stress and environmental exposure. Cost justification occurs through reduced maintenance requirements and extended equipment service life.

Forward-looking Implications: Grid modernization drives demand for advanced insulation materials capable of higher operating temperatures and electrical stress levels. Renewable energy integration creates specialized application requirements for marine and extreme climate environments. Industrial automation expansion sustains insulation material demand across control systems and motor applications.

Analysis of Glass Cloth Electrical Insulation Tape Market by Key Country

Global market dynamics reveal distinct performance tiers reflecting regional electrical infrastructure development and manufacturing capabilities. Growth Leaders including China (4.7% CAGR) and India (4.4% CAGR) demonstrate expanding electrical infrastructure investment with advanced insulation material adoption, while Germany (4.0% CAGR) represents European manufacturing excellence and renewable energy leadership. Steady Performers such as Brazil (3.7% CAGR) and the United States (3.3% CAGR) show consistent demand growth aligned with infrastructure modernization and industrial expansion requirements. Mature Markets including the United Kingdom (3.0% CAGR) and Japan (2.6% CAGR) display moderate growth rates reflecting established infrastructure base and technology advancement focus.

Regional synthesis indicates Asia Pacific dominance through manufacturing concentration and infrastructure development acceleration. North American markets emphasize grid modernization and renewable energy deployment. European regions focus on energy transition and advanced manufacturing applications.
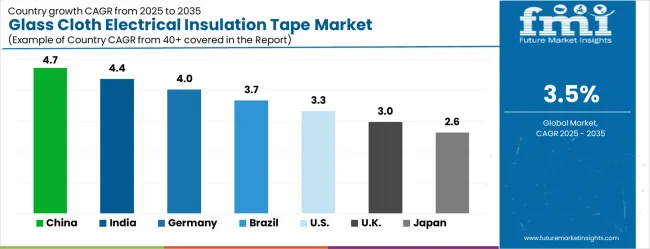
Glass Cloth Electrical Insulation Tape Market Cagr Analysis By Country

Country CAGR (%)
China 4.7
India 4.4
Germany 4.0
Brazil 3.7
USA 3.3
UK 3.0
Japan 2.6

China Market Leadership Profile

China establishes market leadership through expanding electrical infrastructure development and manufacturing capability advancement. A 4.7% CAGR value reflects extensive power generation expansion and export-oriented electrical equipment production requirements. Growth metrics demonstrate sustained expansion supported by government infrastructure investment and renewable energy deployment mandates.

Market dynamics center on smart grid development creating demand for advanced insulation materials and international standard compliance. Manufacturing modernization drives adoption of high-performance electrical insulation solutions for quality improvement and export competitiveness. Belt and Road Initiative projects necessitate certified electrical materials for international infrastructure development.

Manufacturing hub concentration in electrical equipment production zones creates demand density for specialized insulation materials. Industrial development initiatives include advanced electrical infrastructure requiring premium insulation solutions. Foreign technology partnerships bring international electrical standards requiring certified insulation material adoption.

Strategic Market Indicators:

  • Electrical power generation capacity exceeds 2,400 GW requiring extensive insulation material applications
  • Smart grid investment surpasses USD 60 billion annually driving advanced insulation material demand
  • Renewable energy installations create expanding opportunities for specialized electrical insulation solutions
  • High-voltage transmission line construction requires premium insulation materials for reliability and safety
  • Manufacturing export competitiveness demands international standard electrical insulation material adoption
  • Electric vehicle production leadership creates new application opportunities for automotive-grade insulation
  • Industrial automation expansion sustains consistent demand for electrical equipment insulation materials

India Growth Story Analysis

India demonstrates robust growth potential through expanding electrical infrastructure development and manufacturing capability enhancement. A 4.4% CAGR reflects increasing power generation capacity and industrial electrical equipment production supporting economic development objectives. Infrastructure expansion under government initiatives creates consistent demand for reliable electrical insulation solutions across applications.

Power sector growth drives primary demand through generation facility construction and transmission network expansion. Government electrification programs require certified electrical insulation materials for safety compliance and system reliability. Industrial development projects increase electrical equipment production requiring specialized insulation solutions.

Market activity centers on technology transfer agreements bringing international electrical standards to domestic infrastructure projects. Foreign investment in electrical equipment manufacturing introduces advanced insulation material requirements for export competitiveness. Skill development initiatives include training programs for electrical installation and maintenance procedures.

Market Intelligence Brief:

  • Power sector investment exceeds USD 150 billion creating substantial insulation material demand
  • Rural electrification programs drive consistent demand for electrical infrastructure materials
  • Government quality initiatives mandate certified electrical insulation materials for safety compliance
  • Manufacturing expansion creates opportunities for electrical equipment production requiring premium insulation
  • Export market development requires international standard insulation materials for global competitiveness
  • Renewable energy targets support solar and wind power installations requiring specialized insulation solutions

Germany Engineering Excellence and Renewable Leadership

Demand for glass cloth electrical insulation tape in Germany maintains 4.0% CAGR market leadership through engineering excellence and renewable energy technology development. The market demonstrates established industrial base with advanced electrical equipment manufacturing capabilities. Energy transition initiatives create consistent demand for specialized insulation materials across renewable energy and grid modernization applications.

Electrical equipment manufacturing expertise enables production of premium insulation solutions for export markets. Renewable energy leadership drives innovation in insulation materials for offshore wind power and solar energy applications. Technology standard development influences global electrical equipment practices requiring advanced insulation specifications.

Advanced manufacturing research initiatives develop new applications for high-performance electrical insulation materials. Export market leadership necessitates quality certification supporting international sales and regulatory compliance. Industrial automation advancement creates demand for precision electrical insulation solutions.

Performance Metrics:

  • Renewable energy capacity exceeds 130 GW requiring specialized electrical insulation materials
  • Electrical equipment exports surpass EUR 190 billion annually demanding premium insulation solutions
  • Technology standard development influences international electrical insulation material practices
  • Industrial automation leadership creates specialized application opportunities for precision insulation
  • Energy transition investment drives advanced insulation material requirements for grid modernization
  • Research and development initiatives advance electrical insulation material performance and applications

Brazil Infrastructure Development Focus

Brazil represents emerging market growth with a 3.7% CAGR through electrical infrastructure expansion and industrial development acceleration. The market reflects increasing electrical power capacity and manufacturing sector growth supporting economic development requirements. Government infrastructure initiatives create demand for certified electrical insulation materials across power generation and transmission applications.

Electrical power sector expansion drives primary market demand through hydroelectric facility development and transmission line construction. Industrial growth creates opportunities for electrical equipment manufacturing requiring specialized insulation solutions. Mining sector development increases industrial electrical equipment demand requiring reliable insulation materials.

Market development challenges include economic volatility affecting infrastructure investment and import cost fluctuations impacting material pricing. Infrastructure development projects support electrical equipment manufacturing requiring consistent insulation material supply chains.

Strategic Market Considerations:
  • Electrical power capacity expansion creates growing demand for insulation materials in generation and transmission
  • Industrial development drives electrical equipment manufacturing requiring specialized insulation solutions
  • Mining sector growth increases demand for industrial electrical equipment and associated insulation materials
  • Infrastructure investment supports electrical grid modernization requiring advanced insulation technologies
  • Export market potential enables insulation material supply chain development for regional markets

United States Grid Modernization Leadership

Glass Cloth Electrical Insulation Tape Market Country Value Analysis

United States market demonstrates steady growth with a CAGR of 3.3% through electrical grid modernization and renewable energy deployment. The market reflects established infrastructure base with ongoing modernization initiatives requiring advanced electrical insulation solutions. Innovation leadership creates demand for high-performance insulation materials supporting grid reliability and renewable energy integration.

Power grid modernization requires specialized insulation materials for smart grid equipment and advanced transmission systems. Renewable energy sector growth creates opportunities for insulation materials in solar and wind power installations. Aerospace industry leadership maintains consistent demand for certified insulation materials meeting stringent performance requirements.

Infrastructure investment initiatives encourage electrical equipment manufacturing advancement utilizing premium insulation materials. Safety regulation compliance ensures insulation material quality and performance standards. Technology innovation drives development of advanced electrical insulation solutions for emerging applications.

Market Development Indicators:

  • Electrical grid investment exceeds USD 150 billion requiring extensive insulation material applications
  • Renewable energy installations create expanding demand for specialized electrical insulation solutions
  • Aerospace industry maintains consistent demand for high-performance certified insulation materials
  • Industrial automation advancement drives precision electrical equipment requiring premium insulation
  • Infrastructure modernization supports electrical equipment manufacturing with advanced insulation requirements
  • Safety compliance emphasis ensures high-quality insulation material adoption across electrical applications

United Kingdom Energy Transition Focus

United Kingdom demonstrates market stability through energy transition initiatives and electrical infrastructure modernization. A 3.0% CAGR market value reflects established electrical system base with renewable energy integration emphasis. Offshore wind power leadership creates demand for specialized electrical insulation materials capable of marine environment performance.

Electrical infrastructure modernization maintains demand for high-performance insulation materials in grid upgrade and smart meter deployment projects. Renewable energy sector leadership requires specialized insulation solutions for offshore wind installations and energy storage systems. Industrial automation advancement creates opportunities for precision electrical insulation applications.

Energy transition policies emphasize grid flexibility and renewable energy integration requiring advanced electrical equipment with specialized insulation materials. Export market development creates opportunities for electrical equipment manufacturing utilizing premium insulation solutions.

Current Market Observations:
  • Offshore wind capacity exceeds 10 GW creating demand for marine-grade electrical insulation materials
  • Grid modernization projects require advanced electrical insulation solutions for smart grid equipment
  • Energy transition initiatives drive demand for specialized insulation materials in renewable energy applications
  • Industrial automation advancement creates opportunities for precision electrical equipment requiring premium insulation
  • Export market development supports electrical equipment manufacturing with international standard insulation materials

Japan Precision Technology and Manufacturing Excellence

Glass Cloth Electrical Insulation Tape Market Japan Market Share Analysis By Classification

Japan maintains technological leadership through precision manufacturing with a 2.6% CAGR excellence and advanced electrical equipment development. The market value reflects mature industrial base with established electrical insulation material adoption across diverse applications. Technology innovation initiatives create demand for specialized insulation materials supporting advanced electrical system requirements.

Electrical equipment manufacturing excellence requires precision insulation materials for export market competitiveness. Industrial automation leadership utilizes advanced electrical insulation solutions for robotics and control system applications. Quality management system development influences global electrical equipment manufacturing practices.

Manufacturing technology expertise enables production of specialized electrical insulation materials meeting stringent performance requirements. Research and development initiatives advance insulation material performance and application versatility. Consumer electronics industry maintains consistent demand for precision electrical insulation solutions.

Market Status Indicators:
  • Electrical equipment manufacturing maintains global technology leadership requiring premium insulation materials
  • Industrial automation exports include electrical equipment with advanced insulation material requirements
  • Consumer electronics production creates demand for precision electrical insulation applications
  • Quality standard development influences international electrical insulation material manufacturing practices
  • Manufacturing technology expertise enables specialized electrical insulation material production capabilities
  • Research and development initiatives advance electrical insulation material performance and application development

Europe Market Split by Country

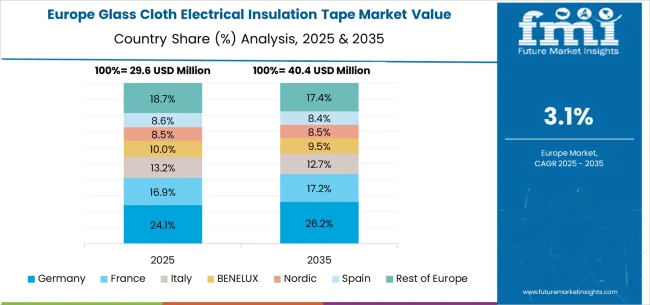
Glass Cloth Electrical Insulation Tape Market Europe Country Market Share Analysis, 2025 & 2035

The European glass cloth electrical insulation tape market totaled USD 42.7 million in 2025, representing 33.9% of global market share. Germany dominates with 32.4% European market share, leading through electrical equipment manufacturing excellence and renewable energy integration capabilities. France contributes USD 9.8 million in specialized electrical insulation manufacturing, emphasizing nuclear power and aerospace applications. The UK market valued at USD 8.2 million shows 3.0% CAGR growth driven by offshore wind power development. Italy holds USD 6.7 million with industrial automation specialization. Netherlands demonstrates USD 4.3 million with electrical infrastructure excellence. Spain projects 3.8% CAGR through renewable energy expansion. Nordic countries show USD 5.1 million with hydroelectric power focus. Market integration enables cross-border electrical standards harmonization with 90-95% certified insulation material adoption in established electrical equipment manufacturing.

Silicone Adhesive Dominates Glass Cloth Electrical Insulation Tape Demand in Germany

Germany's electrical engineering excellence drives silicone adhesive dominance through high-temperature application requirements and renewable energy equipment manufacturing. The 45.2% market share reflects German engineering principles emphasizing reliability and performance under extreme conditions. Electrical equipment production utilizes silicone adhesive systems for proven thermal stability in transformer and motor applications.

Renewable energy sector creates demand for silicone-based insulation materials accommodating offshore wind power environmental requirements. Industrial automation manufacturing produces precision electrical equipment requiring temperature-stable insulation solutions. Engineering services sector benefits from silicone reliability enabling comprehensive electrical system development.

Secondary segments including acrylic and rubber adhesive systems maintain combined 54.8% share through applications requiring specific performance characteristics or cost optimization. Standard electrical applications utilize alternative adhesive systems for proven performance at competitive pricing. Specialized applications select adhesive chemistry based on specific environmental and performance requirements.

Market Characteristics:

  • Engineering excellence culture supports advanced electrical insulation material technology adoption
  • Renewable energy leadership drives silicone adhesive preference for marine environment applications
  • Export market competitiveness requires certified electrical insulation materials meeting international standards
  • Technology innovation focus drives continuous advancement in electrical insulation material performance

Electrical and Electronics Sector Leads Glass Cloth Electrical Insulation Tape Applications in France

France's electrical equipment sector demonstrates application leadership through integrated power generation and aerospace manufacturing operations supporting nuclear power and defense requirements. Service provider landscape includes comprehensive electrical insulation solutions addressing power generation, aerospace, and industrial automation needs across diverse applications. Market share distribution reflects established relationships between insulation material suppliers and major electrical equipment manufacturers.

Nuclear power industry concentration creates demand for specialized electrical insulation services including high-temperature applications, radiation resistance, and long-term reliability programs. Aerospace manufacturing requires comprehensive insulation support for aircraft electrical systems and space applications. Industrial automation integration creates technical support opportunities for precision electrical equipment applications.

Provider evolution trends indicate movement toward comprehensive solution offerings beyond traditional insulation material supply. Service integration includes application engineering support, performance testing programs, and regulatory compliance assistance. Technology advancement requires continuous technical support and specialized application development for competitive differentiation.

Channel Insights:

  • Nuclear power industry concentration creates specialized electrical insulation material demand
  • Aerospace manufacturing requires high-performance certified electrical insulation solutions
  • Industrial automation advancement creates comprehensive technical support opportunities for precision applications
  • Technology leadership drives advanced electrical insulation material application development and innovation

Competitive Landscape of Glass Cloth Electrical Insulation Tape Market

Market structure reflects moderate concentration with established specialty tape manufacturers maintaining significant market positions while regional suppliers serve localized segments. Competition style emphasizes product performance differentiation, technical service capability development, and industry certification compliance. Industry dynamics favor companies combining manufacturing excellence with comprehensive technical support offerings.

Tier 1 - Global Market Leaders: 3M, Nitto Denko, and similar multinational specialty tape corporations dominate through comprehensive electrical insulation portfolios, global manufacturing networks, and technical expertise capabilities. Competitive advantages include research and development resources, established customer relationships, and manufacturing scale economies. Market positions reflect brand recognition and quality reputation across diverse electrical and industrial applications.

Tier 2 - Specialized Technology Providers: Companies like IPG, Saint-Gobain, and Scapa focus on specific application segments or regional markets through specialized product offerings. Competitive advantages include application expertise, technical service flexibility, and industry certification compliance. Market positioning emphasizes technical specialization and customer relationship development.

Tier 3 - Regional and Application Specialists: Smaller companies including TERAOKA, Plymouth Rubber, and regional suppliers serve local markets and specialized applications. Competitive advantages include cost competitiveness, local service capabilities, and customization flexibility. Market participation focuses on price-sensitive segments and specialized performance requirements.

Global Glass Cloth Electrical Insulation Tape Market - Stakeholder Contribution Framework

The glass cloth electrical insulation tape market is central to electrical safety, industrial reliability, renewable energy deployment, and technological advancement. With grid modernization demands, electrification trends, and stringent safety requirements, the sector faces pressure to balance performance excellence, cost efficiency, and environmental compliance. Coordinated action from governments, industry bodies, equipment manufacturers, suppliers, and investors is essential to transition toward high-performance, environmentally sustainable, and digitally integrated electrical insulation solutions.

How Governments Could Spur Local Production and Adoption?

  • Standards & Certification: Establish harmonized electrical safety standards and certification programs for insulation materials, ensuring consistent quality across domestic manufacturing and reducing dependency on imports through local compliance capabilities.
  • R&D Investment: Fund research programs on advanced adhesive chemistries, temperature-resistant materials, and eco-friendly insulation solutions to support domestic innovation and competitive positioning in global markets.
  • Infrastructure Incentives: Provide tax credits for electrical equipment manufacturers adopting certified domestic insulation materials and incentivize utilities upgrading grid infrastructure with premium insulation solutions.
  • Export Promotion: Facilitate international market access through mutual recognition agreements on electrical safety standards and support participation in global electrical equipment trade exhibitions and certification processes.
  • Green Manufacturing: Integrate electrical insulation tape manufacturing into national environmental strategies by promoting solvent-free production processes and recyclable substrate materials supporting circular economy objectives.

How Industry Bodies Could Support Market Development?

  • Technical Standardization: Develop comprehensive guidelines on temperature ratings, adhesive performance specifications, and testing protocols to ensure consistent product quality and enable interoperability across global electrical equipment applications.
  • Quality Certification: Create industry-wide certification programs for high-performance electrical insulation tapes meeting aerospace, automotive, and renewable energy specifications, enhancing market credibility and customer confidence.
  • Technical Education: Establish training programs on proper insulation tape selection, application techniques, and safety compliance for electrical contractors, maintenance technicians, and equipment manufacturers.
  • Market Intelligence: Provide comprehensive market data on emerging applications, regulatory updates, and technology trends to support strategic planning across manufacturers, distributors, and end-users.
  • Regulatory Advocacy: Engage with safety authorities and standards organizations on electrical equipment regulations, environmental compliance requirements, and international trade facilitation for specialized insulation materials.

How Equipment Manufacturers and Technology Players Could Strengthen the Ecosystem?

  • Smart Integration: Develop IoT-enabled electrical equipment incorporating intelligent insulation monitoring systems, predictive maintenance capabilities, and real-time performance tracking for enhanced operational reliability.
  • Application Engineering: Collaborate with insulation tape manufacturers to develop application-specific solutions optimized for transformer winding, motor insulation, and high-voltage cable applications with enhanced performance characteristics.
  • Advanced Materials: Invest in next-generation adhesive technologies, nanocomposite substrates, and hybrid insulation systems providing superior electrical properties, thermal stability, and environmental resistance.
  • Digital Tools: Provide comprehensive selection software, thermal modeling platforms, and performance simulation tools enabling optimal insulation tape specification for diverse electrical applications and operating conditions.
  • Technical Support: Establish application laboratories and field engineering teams supporting customers with insulation system design, performance optimization, and regulatory compliance documentation.

How Suppliers Could Navigate the Shift?

  • Performance Portfolio: Expand from standard electrical applications into specialized segments including aerospace-grade, automotive EV, renewable energy, and industrial automation applications requiring enhanced performance specifications.
  • Sustainable Manufacturing: Adopt eco-friendly production processes using bio-based adhesives, recyclable substrates, and closed-loop manufacturing systems meeting environmental compliance and customer sustainability requirements.
  • Quality Excellence: Implement advanced quality management systems including statistical process control, batch traceability, and accelerated aging testing to ensure consistent product performance and regulatory compliance.
  • Customer Partnership: Deploy technical service teams providing application engineering support, performance testing assistance, and custom formulation development for specialized electrical equipment applications.
  • Supply Chain Optimization: Develop regional manufacturing capabilities and strategic inventory positioning to reduce lead times, minimize logistics costs, and improve customer service responsiveness.

How Investors and Financial Enablers Could Unlock Value?

  • Technology Investment: Finance advanced manufacturing equipment, automated production lines, and quality testing capabilities enabling production of pharmaceutical-grade electrical insulation materials for premium applications.
  • Innovation Funding: Support startups developing breakthrough adhesive technologies, smart insulation materials, and sustainable manufacturing processes addressing emerging market requirements and regulatory mandates.
  • Market Consolidation: Facilitate M&A activities creating integrated players combining raw material access, manufacturing expertise, and global distribution capabilities across electrical insulation applications.
  • Working Capital Solutions: Provide inventory financing and trade credit facilities supporting suppliers managing raw material price volatility and customer payment cycles in cyclical electrical equipment markets.

ESG-Focused Capital: Channel investment toward companies demonstrating measurable environmental improvements, worker safety excellence, and circular economy adoption in electrical insulation tape manufacturing operations.

Key Players in the Glass Cloth Electrical Insulation Tape Market

  • 3M
  • Nitto Denko
  • IPG (Intertape Polymer Group)
  • Saint-Gobain
  • Parafix
  • Scapa
  • TERAOKA
  • Plymouth Rubber
  • PPI Adhesive Products
  • Creative Global Services
  • Nan Ya Plastics
  • Changzhou Wellyun Electrical
  • Shanghai Yuxiang Electrical Materials
  • Advance Tapes International
  • Tesa SE
  • Shurtape Technologies

Scope of the Report

Item Value
Quantitative Units USD 125.8 million
Adhesive Type Silicone Adhesive, Acrylic Adhesive, Rubber Adhesive, Others
Application Electrical and Electronics, Construction, Aerospace, Automotive, Others
Regions Covered North America, Latin America, Europe, East Asia, South Asia & Pacific, Middle East & Africa
Countries Covered United States, Canada, Mexico, Germany, United Kingdom, France, Italy, Spain, Nordic, BENELUX, China, Japan, South Korea, India, ASEAN, Australia, New Zealand, Brazil, Chile, Kingdom of Saudi Arabia, GCC Countries, Turkey, South Africa
Key Companies Profiled 3M, Nitto Denko, IPG, Saint-Gobain, Parafix, Scapa, TERAOKA, Plymouth Rubber, PPI Adhesive Products, Creative Global Services
Additional Attributes Dollar sales by product categories, regional demand trends across North America, Europe, and Asia-Pacific, competitive landscape with player descriptions, adoption patterns across industries, integration with electrical equipment manufacturing, innovations in adhesive technology and temperature resistance, development of specialized applications with enhanced performance capabilities

Glass Cloth Electrical Insulation Tape Market by Segments

Adhesive Type:

  • Silicone Adhesive
  • Acrylic Adhesive
  • Rubber Adhesive
  • Others

Application:

  • Electrical and Electronics
  • Construction
  • Aerospace
  • Automotive
  • Others

Temperature Rating:

  • Class A (105°C)
  • Class B (130°C)
  • Class F (155°C)
  • Class H (180°C and above)

End User:

  • Electrical Equipment Manufacturers
  • Construction Companies
  • Aerospace Manufacturers
  • Automotive OEMs
  • Industrial Users

Regions:

  • North America
    • United States
    • Canada
    • Mexico
  • Europe
    • Germany
    • United Kingdom
    • France
    • Italy
    • Spain
    • Nordic
    • BENELUX
    • Rest of Europe
  • East Asia
    • China
    • Japan
    • South Korea
  • South Asia & Pacific
    • India
    • ASEAN
    • Australia & New Zealand
    • Rest of South Asia & Pacific
  • Latin America
    • Brazil
    • Chile
    • Rest of Latin America
  • Middle East & Africa
    • Kingdom of Saudi Arabia
    • Other GCC Countries
    • Turkey
    • South Africa
    • Other African Union
    • Rest of Middle East & Africa

Table of Content

  1. Executive Summary
    • Global Market Outlook
    • Demand to side Trends
    • Supply to side Trends
    • Technology Roadmap Analysis
    • Analysis and Recommendations
  2. Market Overview
    • Market Coverage / Taxonomy
    • Market Definition / Scope / Limitations
  3. Market Background
    • Market Dynamics
      • Drivers
      • Restraints
      • Opportunity
      • Trends
    • Scenario Forecast
      • Demand in Optimistic Scenario
      • Demand in Likely Scenario
      • Demand in Conservative Scenario
    • Opportunity Map Analysis
    • Product Life Cycle Analysis
    • Supply Chain Analysis
    • Investment Feasibility Matrix
    • Value Chain Analysis
    • PESTLE and Porter’s Analysis
    • Regulatory Landscape
    • Regional Parent Market Outlook
    • Production and Consumption Statistics
    • Import and Export Statistics
  4. Global Market Analysis 2020 to 2024 and Forecast, 2025 to 2035
    • Historical Market Size Value (USD Million) Analysis, 2020 to 2024
    • Current and Future Market Size Value (USD Million) Projections, 2025 to 2035
      • Y to o to Y Growth Trend Analysis
      • Absolute $ Opportunity Analysis
  5. Global Market Pricing Analysis 2020 to 2024 and Forecast 2025 to 2035
  6. Global Market Analysis 2020 to 2024 and Forecast 2025 to 2035, By Classification
    • Introduction / Key Findings
    • Historical Market Size Value (USD Million) Analysis By Classification , 2020 to 2024
    • Current and Future Market Size Value (USD Million) Analysis and Forecast By Classification , 2025 to 2035
      • Silicone Adhesive
      • Acrylic Adhesive
      • Rubber Adhesive
    • Y to o to Y Growth Trend Analysis By Classification , 2020 to 2024
    • Absolute $ Opportunity Analysis By Classification , 2025 to 2035
  7. Global Market Analysis 2020 to 2024 and Forecast 2025 to 2035, By Application
    • Introduction / Key Findings
    • Historical Market Size Value (USD Million) Analysis By Application, 2020 to 2024
    • Current and Future Market Size Value (USD Million) Analysis and Forecast By Application, 2025 to 2035
      • Electrical and Electronics
      • Construction
      • Aerospace
      • Automotive
      • Others
    • Y to o to Y Growth Trend Analysis By Application, 2020 to 2024
    • Absolute $ Opportunity Analysis By Application, 2025 to 2035
  8. Global Market Analysis 2020 to 2024 and Forecast 2025 to 2035, By Region
    • Introduction
    • Historical Market Size Value (USD Million) Analysis By Region, 2020 to 2024
    • Current Market Size Value (USD Million) Analysis and Forecast By Region, 2025 to 2035
      • North America
      • Latin America
      • Western Europe
      • Eastern Europe
      • East Asia
      • South Asia and Pacific
      • Middle East & Africa
    • Market Attractiveness Analysis By Region
  9. North America Market Analysis 2020 to 2024 and Forecast 2025 to 2035, By Country
    • Historical Market Size Value (USD Million) Trend Analysis By Market Taxonomy, 2020 to 2024
    • Market Size Value (USD Million) Forecast By Market Taxonomy, 2025 to 2035
      • By Country
        • USA
        • Canada
        • Mexico
      • By Classification
      • By Application
    • Market Attractiveness Analysis
      • By Country
      • By Classification
      • By Application
    • Key Takeaways
  10. Latin America Market Analysis 2020 to 2024 and Forecast 2025 to 2035, By Country
    • Historical Market Size Value (USD Million) Trend Analysis By Market Taxonomy, 2020 to 2024
    • Market Size Value (USD Million) Forecast By Market Taxonomy, 2025 to 2035
      • By Country
        • Brazil
        • Chile
        • Rest of Latin America
      • By Classification
      • By Application
    • Market Attractiveness Analysis
      • By Country
      • By Classification
      • By Application
    • Key Takeaways
  11. Western Europe Market Analysis 2020 to 2024 and Forecast 2025 to 2035, By Country
    • Historical Market Size Value (USD Million) Trend Analysis By Market Taxonomy, 2020 to 2024
    • Market Size Value (USD Million) Forecast By Market Taxonomy, 2025 to 2035
      • By Country
        • Germany
        • UK
        • Italy
        • Spain
        • France
        • Nordic
        • BENELUX
        • Rest of Western Europe
      • By Classification
      • By Application
    • Market Attractiveness Analysis
      • By Country
      • By Classification
      • By Application
    • Key Takeaways
  12. Eastern Europe Market Analysis 2020 to 2024 and Forecast 2025 to 2035, By Country
    • Historical Market Size Value (USD Million) Trend Analysis By Market Taxonomy, 2020 to 2024
    • Market Size Value (USD Million) Forecast By Market Taxonomy, 2025 to 2035
      • By Country
        • Russia
        • Poland
        • Hungary
        • Balkan & Baltic
        • Rest of Eastern Europe
      • By Classification
      • By Application
    • Market Attractiveness Analysis
      • By Country
      • By Classification
      • By Application
    • Key Takeaways
  13. East Asia Market Analysis 2020 to 2024 and Forecast 2025 to 2035, By Country
    • Historical Market Size Value (USD Million) Trend Analysis By Market Taxonomy, 2020 to 2024
    • Market Size Value (USD Million) Forecast By Market Taxonomy, 2025 to 2035
      • By Country
        • China
        • Japan
        • South Korea
      • By Classification
      • By Application
    • Market Attractiveness Analysis
      • By Country
      • By Classification
      • By Application
    • Key Takeaways
  14. South Asia and Pacific Market Analysis 2020 to 2024 and Forecast 2025 to 2035, By Country
    • Historical Market Size Value (USD Million) Trend Analysis By Market Taxonomy, 2020 to 2024
    • Market Size Value (USD Million) Forecast By Market Taxonomy, 2025 to 2035
      • By Country
        • India
        • ASEAN
        • Australia & New Zealand
        • Rest of South Asia and Pacific
      • By Classification
      • By Application
    • Market Attractiveness Analysis
      • By Country
      • By Classification
      • By Application
    • Key Takeaways
  15. Middle East & Africa Market Analysis 2020 to 2024 and Forecast 2025 to 2035, By Country
    • Historical Market Size Value (USD Million) Trend Analysis By Market Taxonomy, 2020 to 2024
    • Market Size Value (USD Million) Forecast By Market Taxonomy, 2025 to 2035
      • By Country
        • Kingdom of Saudi Arabia
        • Other GCC Countries
        • Turkiye
        • South Africa
        • Other African Union
        • Rest of Middle East & Africa
      • By Classification
      • By Application
    • Market Attractiveness Analysis
      • By Country
      • By Classification
      • By Application
    • Key Takeaways
  16. Key Countries Market Analysis
    • USA
      • Pricing Analysis
      • Market Share Analysis, 2024
        • By Classification
        • By Application
    • Canada
      • Pricing Analysis
      • Market Share Analysis, 2024
        • By Classification
        • By Application
    • Mexico
      • Pricing Analysis
      • Market Share Analysis, 2024
        • By Classification
        • By Application
    • Brazil
      • Pricing Analysis
      • Market Share Analysis, 2024
        • By Classification
        • By Application
    • Chile
      • Pricing Analysis
      • Market Share Analysis, 2024
        • By Classification
        • By Application
    • Germany
      • Pricing Analysis
      • Market Share Analysis, 2024
        • By Classification
        • By Application
    • UK
      • Pricing Analysis
      • Market Share Analysis, 2024
        • By Classification
        • By Application
    • Italy
      • Pricing Analysis
      • Market Share Analysis, 2024
        • By Classification
        • By Application
    • Spain
      • Pricing Analysis
      • Market Share Analysis, 2024
        • By Classification
        • By Application
    • France
      • Pricing Analysis
      • Market Share Analysis, 2024
        • By Classification
        • By Application
    • India
      • Pricing Analysis
      • Market Share Analysis, 2024
        • By Classification
        • By Application
    • ASEAN
      • Pricing Analysis
      • Market Share Analysis, 2024
        • By Classification
        • By Application
    • Australia & New Zealand
      • Pricing Analysis
      • Market Share Analysis, 2024
        • By Classification
        • By Application
    • China
      • Pricing Analysis
      • Market Share Analysis, 2024
        • By Classification
        • By Application
    • Japan
      • Pricing Analysis
      • Market Share Analysis, 2024
        • By Classification
        • By Application
    • South Korea
      • Pricing Analysis
      • Market Share Analysis, 2024
        • By Classification
        • By Application
    • Russia
      • Pricing Analysis
      • Market Share Analysis, 2024
        • By Classification
        • By Application
    • Poland
      • Pricing Analysis
      • Market Share Analysis, 2024
        • By Classification
        • By Application
    • Hungary
      • Pricing Analysis
      • Market Share Analysis, 2024
        • By Classification
        • By Application
    • Kingdom of Saudi Arabia
      • Pricing Analysis
      • Market Share Analysis, 2024
        • By Classification
        • By Application
    • Turkiye
      • Pricing Analysis
      • Market Share Analysis, 2024
        • By Classification
        • By Application
    • South Africa
      • Pricing Analysis
      • Market Share Analysis, 2024
        • By Classification
        • By Application
  17. Market Structure Analysis
    • Competition Dashboard
    • Competition Benchmarking
    • Market Share Analysis of Top Players
      • By Regional
      • By Classification
      • By Application
  18. Competition Analysis
    • Competition Deep Dive
      • 3M
        • Overview
        • Product Portfolio
        • Profitability by Market Segments (Product/Age /Sales Channel/Region)
        • Sales Footprint
        • Strategy Overview
          • Marketing Strategy
          • Product Strategy
          • Channel Strategy
      • Nitto Denko
      • IPG
      • Saint-Gobain
      • Parafix
      • Scapa
      • TERAOKA
      • Plymouth Rubber
      • PPI Adhesive Products
      • Creative Global Services
      • Nan Ya Plastics
      • Changzhou Wellyun Electrical
      • Shanghai Yuxiang Electrical Materials
  19. Assumptions & Acronyms Used
  20. Research Methodology

List of Tables

  • Table 1: Global Market Value (USD Million) Forecast by Region, 2020 to 2035
  • Table 2: Global Market Value (USD Million) Forecast by Classification , 2020 to 2035
  • Table 3: Global Market Value (USD Million) Forecast by Application, 2020 to 2035
  • Table 4: North America Market Value (USD Million) Forecast by Country, 2020 to 2035
  • Table 5: North America Market Value (USD Million) Forecast by Classification , 2020 to 2035
  • Table 6: North America Market Value (USD Million) Forecast by Application, 2020 to 2035
  • Table 7: Latin America Market Value (USD Million) Forecast by Country, 2020 to 2035
  • Table 8: Latin America Market Value (USD Million) Forecast by Classification , 2020 to 2035
  • Table 9: Latin America Market Value (USD Million) Forecast by Application, 2020 to 2035
  • Table 10: Western Europe Market Value (USD Million) Forecast by Country, 2020 to 2035
  • Table 11: Western Europe Market Value (USD Million) Forecast by Classification , 2020 to 2035
  • Table 12: Western Europe Market Value (USD Million) Forecast by Application, 2020 to 2035
  • Table 13: Eastern Europe Market Value (USD Million) Forecast by Country, 2020 to 2035
  • Table 14: Eastern Europe Market Value (USD Million) Forecast by Classification , 2020 to 2035
  • Table 15: Eastern Europe Market Value (USD Million) Forecast by Application, 2020 to 2035
  • Table 16: East Asia Market Value (USD Million) Forecast by Country, 2020 to 2035
  • Table 17: East Asia Market Value (USD Million) Forecast by Classification , 2020 to 2035
  • Table 18: East Asia Market Value (USD Million) Forecast by Application, 2020 to 2035
  • Table 19: South Asia and Pacific Market Value (USD Million) Forecast by Country, 2020 to 2035
  • Table 20: South Asia and Pacific Market Value (USD Million) Forecast by Classification , 2020 to 2035
  • Table 21: South Asia and Pacific Market Value (USD Million) Forecast by Application, 2020 to 2035
  • Table 22: Middle East & Africa Market Value (USD Million) Forecast by Country, 2020 to 2035
  • Table 23: Middle East & Africa Market Value (USD Million) Forecast by Classification , 2020 to 2035
  • Table 24: Middle East & Africa Market Value (USD Million) Forecast by Application, 2020 to 2035

List of Figures

  • Figure 1: Global Market Pricing Analysis
  • Figure 2: Global Market Value (USD Million) Forecast 2020-2035
  • Figure 3: Global Market Value Share and BPS Analysis by Classification , 2025 and 2035
  • Figure 4: Global Market Y to o to Y Growth Comparison by Classification , 2025-2035
  • Figure 5: Global Market Attractiveness Analysis by Classification
  • Figure 6: Global Market Value Share and BPS Analysis by Application, 2025 and 2035
  • Figure 7: Global Market Y to o to Y Growth Comparison by Application, 2025-2035
  • Figure 8: Global Market Attractiveness Analysis by Application
  • Figure 9: Global Market Value (USD Million) Share and BPS Analysis by Region, 2025 and 2035
  • Figure 10: Global Market Y to o to Y Growth Comparison by Region, 2025-2035
  • Figure 11: Global Market Attractiveness Analysis by Region
  • Figure 12: North America Market Incremental Dollar Opportunity, 2025-2035
  • Figure 13: Latin America Market Incremental Dollar Opportunity, 2025-2035
  • Figure 14: Western Europe Market Incremental Dollar Opportunity, 2025-2035
  • Figure 15: Eastern Europe Market Incremental Dollar Opportunity, 2025-2035
  • Figure 16: East Asia Market Incremental Dollar Opportunity, 2025-2035
  • Figure 17: South Asia and Pacific Market Incremental Dollar Opportunity, 2025-2035
  • Figure 18: Middle East & Africa Market Incremental Dollar Opportunity, 2025-2035
  • Figure 19: North America Market Value Share and BPS Analysis by Country, 2025 and 2035
  • Figure 20: North America Market Value Share and BPS Analysis by Classification , 2025 and 2035
  • Figure 21: North America Market Y to o to Y Growth Comparison by Classification , 2025-2035
  • Figure 22: North America Market Attractiveness Analysis by Classification
  • Figure 23: North America Market Value Share and BPS Analysis by Application, 2025 and 2035
  • Figure 24: North America Market Y to o to Y Growth Comparison by Application, 2025-2035
  • Figure 25: North America Market Attractiveness Analysis by Application
  • Figure 26: Latin America Market Value Share and BPS Analysis by Country, 2025 and 2035
  • Figure 27: Latin America Market Value Share and BPS Analysis by Classification , 2025 and 2035
  • Figure 28: Latin America Market Y to o to Y Growth Comparison by Classification , 2025-2035
  • Figure 29: Latin America Market Attractiveness Analysis by Classification
  • Figure 30: Latin America Market Value Share and BPS Analysis by Application, 2025 and 2035
  • Figure 31: Latin America Market Y to o to Y Growth Comparison by Application, 2025-2035
  • Figure 32: Latin America Market Attractiveness Analysis by Application
  • Figure 33: Western Europe Market Value Share and BPS Analysis by Country, 2025 and 2035
  • Figure 34: Western Europe Market Value Share and BPS Analysis by Classification , 2025 and 2035
  • Figure 35: Western Europe Market Y to o to Y Growth Comparison by Classification , 2025-2035
  • Figure 36: Western Europe Market Attractiveness Analysis by Classification
  • Figure 37: Western Europe Market Value Share and BPS Analysis by Application, 2025 and 2035
  • Figure 38: Western Europe Market Y to o to Y Growth Comparison by Application, 2025-2035
  • Figure 39: Western Europe Market Attractiveness Analysis by Application
  • Figure 40: Eastern Europe Market Value Share and BPS Analysis by Country, 2025 and 2035
  • Figure 41: Eastern Europe Market Value Share and BPS Analysis by Classification , 2025 and 2035
  • Figure 42: Eastern Europe Market Y to o to Y Growth Comparison by Classification , 2025-2035
  • Figure 43: Eastern Europe Market Attractiveness Analysis by Classification
  • Figure 44: Eastern Europe Market Value Share and BPS Analysis by Application, 2025 and 2035
  • Figure 45: Eastern Europe Market Y to o to Y Growth Comparison by Application, 2025-2035
  • Figure 46: Eastern Europe Market Attractiveness Analysis by Application
  • Figure 47: East Asia Market Value Share and BPS Analysis by Country, 2025 and 2035
  • Figure 48: East Asia Market Value Share and BPS Analysis by Classification , 2025 and 2035
  • Figure 49: East Asia Market Y to o to Y Growth Comparison by Classification , 2025-2035
  • Figure 50: East Asia Market Attractiveness Analysis by Classification
  • Figure 51: East Asia Market Value Share and BPS Analysis by Application, 2025 and 2035
  • Figure 52: East Asia Market Y to o to Y Growth Comparison by Application, 2025-2035
  • Figure 53: East Asia Market Attractiveness Analysis by Application
  • Figure 54: South Asia and Pacific Market Value Share and BPS Analysis by Country, 2025 and 2035
  • Figure 55: South Asia and Pacific Market Value Share and BPS Analysis by Classification , 2025 and 2035
  • Figure 56: South Asia and Pacific Market Y to o to Y Growth Comparison by Classification , 2025-2035
  • Figure 57: South Asia and Pacific Market Attractiveness Analysis by Classification
  • Figure 58: South Asia and Pacific Market Value Share and BPS Analysis by Application, 2025 and 2035
  • Figure 59: South Asia and Pacific Market Y to o to Y Growth Comparison by Application, 2025-2035
  • Figure 60: South Asia and Pacific Market Attractiveness Analysis by Application
  • Figure 61: Middle East & Africa Market Value Share and BPS Analysis by Country, 2025 and 2035
  • Figure 62: Middle East & Africa Market Value Share and BPS Analysis by Classification , 2025 and 2035
  • Figure 63: Middle East & Africa Market Y to o to Y Growth Comparison by Classification , 2025-2035
  • Figure 64: Middle East & Africa Market Attractiveness Analysis by Classification
  • Figure 65: Middle East & Africa Market Value Share and BPS Analysis by Application, 2025 and 2035
  • Figure 66: Middle East & Africa Market Y to o to Y Growth Comparison by Application, 2025-2035
  • Figure 67: Middle East & Africa Market Attractiveness Analysis by Application
  • Figure 68: Global Market - Tier Structure Analysis
  • Figure 69: Global Market - Company Share Analysis

Frequently Asked Questions

How big is the glass cloth electrical insulation tape market in 2025?

The global glass cloth electrical insulation tape market is estimated to be valued at USD 125.9 million in 2025.

What will be the size of glass cloth electrical insulation tape market in 2035?

The market size for the glass cloth electrical insulation tape market is projected to reach USD 177.5 million by 2035.

How much will be the glass cloth electrical insulation tape market growth between 2025 and 2035?

The glass cloth electrical insulation tape market is expected to grow at a 3.5% CAGR between 2025 and 2035.

What are the key product types in the glass cloth electrical insulation tape market?

The key product types in glass cloth electrical insulation tape market are silicone adhesive, acrylic adhesive and rubber adhesive.

Which application segment to contribute significant share in the glass cloth electrical insulation tape market in 2025?

In terms of application, electrical and electronics segment to command 42.8% share in the glass cloth electrical insulation tape market in 2025.

Explore Similar Insights

Future Market Insights

Glass Cloth Electrical Insulation Tape Market

Chat With

MaRIA

Hi There, I am MaRIA, Your Market Research Intelligence Assistant. How may I help you?