Reports

- Global Locations -

Headquarters

Future Market Insights, Inc.

Christiana Corporate, 200
Continental Drive, Suite 401,
Newark, Delaware - 19713,
United States

T: +1-845-579-5705

Americas

Future Market Insights, Inc.

616 Corporate Way, Suite 2-9018,
Valley Cottage, NY 10989, United States

T: +1-347-918-3531

MEA

Future Market Insights

1602-6 Jumeirah Bay X2 Tower, Plot No: JLT-PH2-X2A,
Jumeirah Lakes Towers, Dubai,
United Arab Emirates

Europe

Future Market Insights

3rd Floor, 207 Regent Street,
W1B 3HH London
United Kingdom

T: + 44 (0) 20 8123 9659
D: +44 (0) 20 3287 4268

Asia Pacific

Future Market Insights

IndiaLand Global Tech Park, Unit UG-1, Behind Grand HighStreet, Phase 1, Hinjawadi, MH, Pune – 411057, India

Glass Cosmetic Bottle Market Outlook from 2024 to 2034

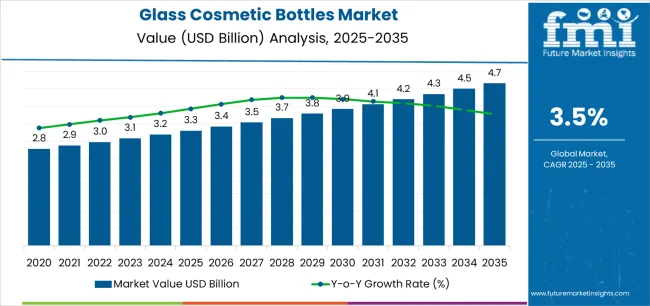
The glass cosmetic bottle market is expected to experience a sluggish CAGR of 3.50% during the forecast period, reaching a valuation of US$ 3.2 billion in 2024. This growth is propelled by the increasing demand for eco-friendly and sustainable packaging solutions in the cosmetics industry.

The market value is forecasted to reach a whopping US$ 4.6 billion by 2034. This growth is attributed to the rising emphasis on energy efficiency and the adoption of clean energy sources across various industries.

Attributes Details
Market Value for 2024 US$ 3.2 billion
Projected Market Value for 2034 US$ 4.6 billion
Value-based CAGR of Market for 2024 to 2034 3.50%

Don't pay for what you don't need

Customize your report by selecting specific countries or regions and save 30%!

Glass Cosmetic Bottle Market Dynamics

Drivers
  • The rising disposable income of the population is heightening the popularity of cosmetics and perfumery options.
  • The growing beauty standards and expansion of distribution frequency are increasing the demand for packaging materials, including glass bottles, fueling market growth.
  • Sustainability deliberations are becoming more vital, which may prompt an increase in demand for recycled materials aligned with environmental consciousness.
  • The growing demand for cosmetics and perfumery products will significantly impact the demand for glass bottles.
Restraints
  • A significant portion of expenses is the raw materials used for producing the glass bottles.
  • The industry involves numerous stages, requiring specialized equipment, skilled labor, and energy consumption, contributing to overall production costs.
  • Glass bottles designed for high-end cosmetics and perfumery will limit the market's growth due to their cost.
  • Other factors that affect the growth of the market are packaging, handling, storage, and transportation. These further inflate expenses and reflect the high costs of raw materials, manufacturing processes, labor, technology, quality control, packaging, and transportation
Opportunities
  • Technological advances and consumer preferences drive innovation in bottle design.
  • Personalization and customization substitute brand loyalty and increase customer engagement.
  • Aesthetic enhancements, such as unique shapes, intricate detailing, and decorative finishes, elevate the visual appeal of packaging, entice consumer attention, and emphasize brand identity.
  • The industry is witnessing a shift toward sustainable materials and designs, focusing on eco-friendly options like recycled glass and biodegradable plastics.

Comparative View of Adjacent Markets

A comprehensive analysis has been conducted on three related markets: the glass cosmetic bottle market, the Boston round glass bottle market, and the glass liquor bottles market. Each of these markets has its unique characteristics and caters to different consumer needs.

The glass cosmetic bottle market focuses on offering attractive and functional packaging options for cosmetic products. The Boston round glass bottle market is more versatile and can be used for packaging a variety of products such as essential oils, fragrances, and herbal medicines.

The glass liquor bottle market caters to the needs of the alcoholic beverage industry, providing artistically pleasing and durable packaging solutions.

Understanding the characteristics of each market is essential for manufacturers to make informed decisions when selecting the packaging solution for their products.

By analyzing these markets, industries can identify the demands of their target audience and select the most appropriate packaging solution that aligns with their brand image and meets their product requirements.

Glass Cosmetic Bottle Market:

Attributes Glass Cosmetic Bottle Market
Value-based CAGR (2024 to 2034) 3.50%
Projected Market Value (2034) US$ 4.6 billion
Market Trend Integration of digital technologies for personalized packaging experiences
Growth Factor Adoption of innovative bottle designs and shapes to enhance brand identity

Boston Round Glass Bottle Market:

Attributes Boston Round Glass Bottle Market
Value-based CAGR (2024 to 2034) 5.6%
Market Trend Incorporation of child-resistant and tamper-evident features for pharmaceutical bottles
Growth Factor Shift toward sustainable packaging solutions to reduce environmental impact

Glass Liquor Bottle Market:

Attributes Glass Liquor Bottle Market
Value-based CAGR (2024 to 2034) 5%
Market Trend Incorporation of anti-counterfeiting features like holograms and QR codes
Growth Factor Premiumization trend in alcohol is leading to demand for high-quality packaging
Ismail Sutaria
Ismail Sutaria

Principal Consultant

Talk to Analyst

Find your sweet spots for generating winning opportunities in this market.

Category-wise Outlook

There is a growing demand for Grade I glass cosmetic bottles in the skincare market due to their purity and quality, as well as a trend toward specialized bottles for specific skincare products.

Aesthetically Pleasing Designs in Type I Glass Bottles Elevate Beauty Brand Appeal

The type I segment is projected to dominate the glass cosmetic bottle market and is expected to capture an impressive 53.4% market share in 2024. This represents a significant portion of the market and speaks to the quality and appeal of the Type I segment.

  • Type I grade glass cosmetic bottles are popular for their high-quality glass. These are designed to provide protection from UV radiation and other harmful external components, thus expanding the market growth.
  • Manufacturers offer aesthetically pleasing designs and shapes to create favorites among beauty brands to make them extraordinary. Product packaging can be an important factor in attracting customers.
Attributes Details
Grade Type I
Market Share (2024) 53.4%

Demand for Glass Cosmetic Bottles Surges in Skincare Industry for Enhanced Protection

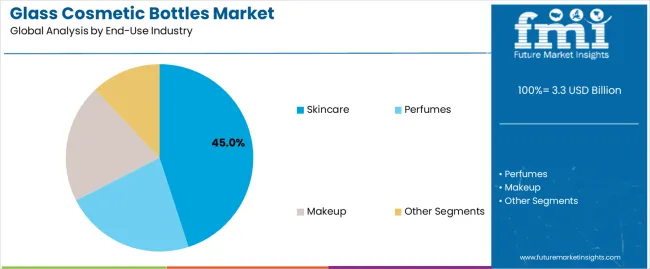
Glass cosmetic bottles are expected to hold a 42.7% market share in the skincare sector in 2024.

  • The rising demand for glass cosmetic bottles in the skincare industry is due to their multiple benefits, such as being non-reactive, impermeable, and providing a great barrier against external contaminants.
  • The growing popularity of natural and organic skincare products has contributed to the growth of the glass cosmetic bottle market in the skincare industry.
Attributes Details
End Use Skin Care
Market Share (2024) 42.7%

Country-wise Analysis

The market is predicted to experience substantial growth in different regions in the upcoming years.

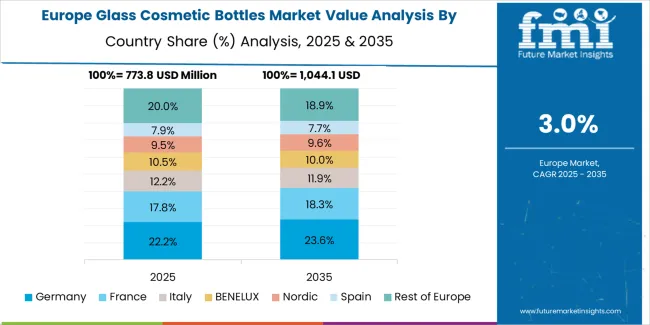
  • The rise in demand and consumption of cosmetic glass bottles is expected to lead the market in Europe.
  • Asia Pacific is expected to be the second-biggest market, driven by the growing awareness of cosmetic glass bottles and increasing per capita income.
  • North America plays a prominent role, with advancements in innovative packaging technologies and the growing popularity of skincare options driving the market.
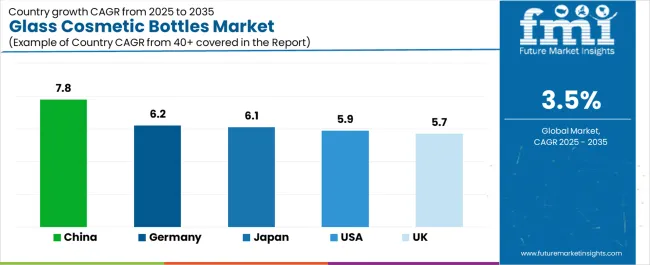
Countries CAGR (2024 to 2034)
United State 1.9%
Spain 2.1%
India 6.0%
China 4.6%
Germany 1.6%

Aesthetics and Eco-consciousness Drive Growth in United States Glass Cosmetic Bottle Industry

The glass cosmetic bottle market in the United States is estimated to experience a 1.9% CAGR, showing steady growth and significant importance. The market in the United States places high emphasis on aesthetics and quality.

Consumers appreciate the transparency of glass packaging, which allows them to see the product inside. Moreover, the increasing awareness of environmental impact has led to a preference for recyclable and reusable packaging, making it an attractive choice.

Spain's Glass Cosmetic Packaging Industry Thrives on Artisanal Craftsmanship

The market in Spain is projected to develop at a CAGR of 2.1%. Spain has a rich history of glass craftsmanship. The crafting of glassware extends to cosmetic packaging. In Spain, people value the artistry and heritage associated with glass, driving market growth.

The tourism industry boosts the popularity of perfume and cosmetics. Glass bottles are favored for their ability to preserve fragrances and enhance the overall experience.

Glass Cosmetic Container Adoption in India Surges with Natural Product Demand

The market in India is expected to rise at a CAGR of 6.0% through 2034. India is focusing on the middle class seeking options in beauty products. Glass bottles are perceived as premium and trustworthy.

In India, consumer demand for natural and Ayurveda products aligns well with glass packaging. Glass ensures product integrity and purity, anticipating the growth of the market.

Glass Packaging Elevates China's Skincare Market Resonating with Consumer Preferences

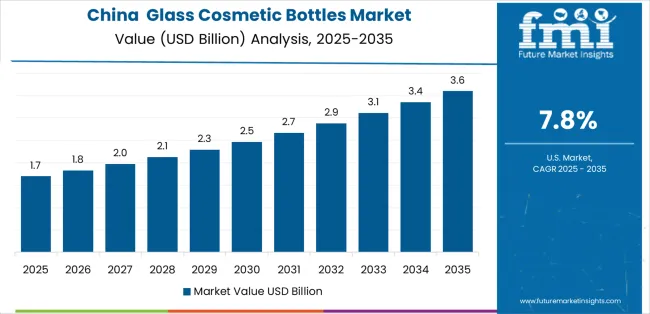
The market is predicted to progress at a CAGR of 4.6% in China during the forecast period, with various factors influencing this growth. The beauty and skincare market in China is thriving.

Glass packaging is associated with high-end products and resonates with discerning consumers. In addition, eCommerce platforms emphasize visual appeal of cosmetic products in glass bottles, leading to better sales and expanding the growth rate of the market.

Precision and Innovation Shape Germany's Glass Cosmetic Bottle Market Expansion

The market in Germany is estimated to experience a 1.6% CAGR, outperforming other countries in Europe during the valuation and estimate periods. Precision engineering in Germany is globally well-known.

The focus of industries is on quality and reliability in glass cosmetic bottles. Additionally, glass is commonly used in pharmaceutical skincare, and this trend extends to cosmetics, with the pharmaceutical industries strongly influencing cosmetic packaging.

Get the data you need at a Fraction of the cost

Personalize your report by choosing insights you need
and save 40%!

Competitive Landscape

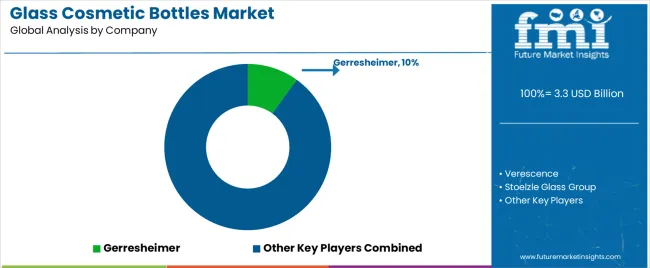
The glass cosmetic bottle market is dynamic and highly competitive, characterized by the emergence of new key market players and collaborations. Key players are constantly innovating and introducing new technologies to enhance the safety, efficacy, and affordability of their products.

There is a focus on offering a wide variety to customers, including premium glass bottles that are not only aesthetically pleasing but also environmentally friendly.

Key players are collaborating and working together to develop sustainable packaging solutions that align with the ever-changing consumer preferences. With such strong players and a commitment to innovation, the market is expected to thrive for years to come.

Recent Developments

  • In March 2024, Amorepacific Group partnered with KORA to improve the recycling of cosmetic glass bottles, addressing challenges posed by diverse coatings.
  • In November 2023, primary glass packaging manufacturer SGD Pharma launched a new lightweight glass bottle, NOVA, which reduces CO2 emissions by 20% compared to the standard Dorado bottle. The new bottle has a low weight-to-volume ratio of 0.65 and is designed to minimize greenhouse gas emissions.
  • In April 2023, Baralan, an expert in primary packaging for cosmetic and personal care products, launched a new glass bottle series, the Lilibet series, which combines a circular shape with a square profile. The seven-bottle series features various capacities and neck sizes, making it suitable for a variety of cosmetic products.

Key Companies

  • Heinz-Glas
  • Pochet
  • SGD-Pharma
  • La Glass Vallee
  • Bormioli Luigi
  • Gerresheimer Group
  • Pragati Glass
  • Saver Glass
  • SGB Packaging Group
  • Stoelzle Glass Group
  • Vidraria Anchieta
  • Roma International Plc
  • Sks Bottle & Packaging Inc
  • Verescence Inc.
  • Consol Glass (Pty) Ltd
  • Vitro SAB De CV
  • Apg Group
  • Lumson spa

Key Segmentation

By Closure Type:

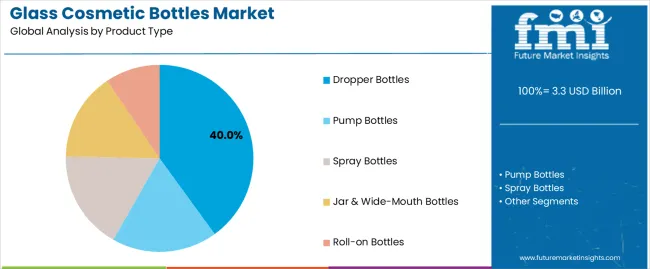
  • Push Pump Bottles
  • Fine Mist Spray Bottles
  • Glass Rollers
  • Screw Top Jars
  • Dropper Bottles

By Capacity:

  • Below 30 ml
  • 30 to 50 ml
  • 51 to 100 ml
  • Above 100 ml

By Application:

  • Skin Care
  • Hair Care
  • Perfume & Deodorants
  • Other (Nail Care, Essential Oils)

By Region:

  • North America
  • Latin America
  • Europe
  • South Asia
  • East Asia
  • Middle East & Africa
  • Oceania

Frequently Asked Questions

How Big is the Glass Cosmetic Bottle Market?

The market size is estimated to be US$ 3.2 billion in 2024.

At What Rate is the Glass Cosmetic Bottle Market Expected to Grow?

The market is expected to increase at a CAGR of 3.50% over the forecast period.

What is the Scope of Glass Cosmetic Bottle Demand in China?

The market is expected to register a CAGR of 4.6% in China from 2024 to 2034.

What is the Future Forecast for the Glass Cosmetic Bottle Market?

The market is forecasted to reach a size of US$ 4.6 billion by 2034.

Who are the Key Companies in the Market?

Heinz-Glas, Piramal Glass, Pochet, SGD-Pharma, Zignago Vetro, La Glass Vallee, Bormioli Luigi, Gerresheimer Group, and others.

What is the Top Grade of Glass Cosmetic Bottles?

Type I grade of glass cosmetic bottle is highly popular.

Table of Content

1. Executive Summary

    1.1. Global Market Outlook

    1.2. Demand-side Trends

    1.3. Supply-side Trends

    1.4. Technology Roadmap Analysis

    1.5. Analysis and Recommendations

2. Market Overview

    2.1. Market Coverage / Taxonomy

    2.2. Market Definition / Scope / Limitations

3. Market Background

    3.1. Market Dynamics

        3.1.1. Drivers

        3.1.2. Restraints

        3.1.3. Opportunity

        3.1.4. Trends

    3.2. Scenario Forecast

        3.2.1. Demand in Optimistic Scenario

        3.2.2. Demand in Likely Scenario

        3.2.3. Demand in Conservative Scenario

    3.3. Opportunity Map Analysis

    3.4. Product Life Cycle Analysis

    3.5. Supply Chain Analysis

        3.5.1. Supply Side Participants and their Roles

            3.5.1.1. Manufacturer

        3.5.2. Value Added and Value Created at Node in the Supply Chain

        3.5.3. List of Raw Material Suppliers

        3.5.4. List of Existing and Potential Buyer’s

    3.6. Investment Feasibility Matrix

    3.7. Value Chain Analysis

        3.7.1. Profit Margin Analysis

    3.8. PESTLE and Porter’s Analysis

    3.9. Regulatory Landscape

        3.9.1. By Key Regions

        3.9.2. By Key Countries

    3.10. Regional Parent Market Outlook

    3.11. Production and Consumption Statistics

    3.12. Import and Export Statistics

4. Global Market Analysis 2019 to 2023 and Forecast, 2024 to 2034

    4.1. Historical Market Size Value (US$ Million) & Volume (Units) Analysis, 2019 to 2023

    4.2. Current and Future Market Size Value (US$ Million) & Volume (Units) Projections, 2024 to 2034

        4.2.1. Y-o-Y Growth Trend Analysis

        4.2.2. Absolute $ Opportunity Analysis

5. Global Market Analysis 2019 to 2023 and Forecast 2024 to 2034, By Closure Type

    5.1. Introduction / Key Findings

    5.2. Historical Market Size Value (US$ Million) & Volume (Units) Analysis By Closure Type, 2019 to 2023

    5.3. Current and Future Market Size Value (US$ Million) & Volume (Units) Analysis and Forecast By Closure Type, 2024 to 2034

        5.3.1. Push Pump Bottles

        5.3.2. Fine Mist Spray Bottles

        5.3.3. Glass Rollers

        5.3.4. Screw Top Jars

        5.3.5. Dropper Bottles

    5.4. Y-o-Y Growth Trend Analysis By Closure Type, 2019 to 2023

    5.5. Absolute $ Opportunity Analysis By Closure Type, 2024 to 2034

6. Global Market Analysis 2019 to 2023 and Forecast 2024 to 2034, By Capacity

    6.1. Introduction / Key Findings

    6.2. Historical Market Size Value (US$ Million) & Volume (Units) Analysis By Capacity, 2019 to 2023

    6.3. Current and Future Market Size Value (US$ Million) & Volume (Units) Analysis and Forecast By Capacity, 2024 to 2034

        6.3.1. Below 30 ml

        6.3.2. 31 to 50 ml

        6.3.3. 51 to 100 ml

        6.3.4. Above 100 ml

    6.4. Y-o-Y Growth Trend Analysis By Capacity, 2019 to 2023

    6.5. Absolute $ Opportunity Analysis By Capacity, 2024 to 2034

7. Global Market Analysis 2019 to 2023 and Forecast 2024 to 2034, By Application

    7.1. Introduction / Key Findings

    7.2. Historical Market Size Value (US$ Million) & Volume (Units) Analysis By Application, 2019 to 2023

    7.3. Current and Future Market Size Value (US$ Million) & Volume (Units) Analysis and Forecast By Application, 2024 to 2034

        7.3.1. Skin Care

        7.3.2. Hair Care

        7.3.3. Perfume & Deodorants

        7.3.4. Others

    7.4. Y-o-Y Growth Trend Analysis By Application, 2019 to 2023

    7.5. Absolute $ Opportunity Analysis By Application, 2024 to 2034

8. Global Market Analysis 2019 to 2023 and Forecast 2024 to 2034, By Region

    8.1. Introduction

    8.2. Historical Market Size Value (US$ Million) & Volume (Units) Analysis By Region, 2019 to 2023

    8.3. Current Market Size Value (US$ Million) & Volume (Units) Analysis and Forecast By Region, 2024 to 2034

        8.3.1. North America

        8.3.2. Latin America

        8.3.3. Western Europe

        8.3.4. Eastern Europe

        8.3.5. South Asia and Pacific

        8.3.6. East Asia

        8.3.7. Middle East and Africa

    8.4. Market Attractiveness Analysis By Region

9. North America Market Analysis 2019 to 2023 and Forecast 2024 to 2034, By Country

    9.1. Historical Market Size Value (US$ Million) & Volume (Units) Trend Analysis By Market Taxonomy, 2019 to 2023

    9.2. Market Size Value (US$ Million) & Volume (Units) Forecast By Market Taxonomy, 2024 to 2034

        9.2.1. By Country

            9.2.1.1. USA

            9.2.1.2. Canada

        9.2.2. By Closure Type

        9.2.3. By Capacity

        9.2.4. By Application

    9.3. Market Attractiveness Analysis

        9.3.1. By Country

        9.3.2. By Closure Type

        9.3.3. By Capacity

        9.3.4. By Application

    9.4. Key Takeaways

10. Latin America Market Analysis 2019 to 2023 and Forecast 2024 to 2034, By Country

    10.1. Historical Market Size Value (US$ Million) & Volume (Units) Trend Analysis By Market Taxonomy, 2019 to 2023

    10.2. Market Size Value (US$ Million) & Volume (Units) Forecast By Market Taxonomy, 2024 to 2034

        10.2.1. By Country

            10.2.1.1. Brazil

            10.2.1.2. Mexico

            10.2.1.3. Rest of Latin America

        10.2.2. By Closure Type

        10.2.3. By Capacity

        10.2.4. By Application

    10.3. Market Attractiveness Analysis

        10.3.1. By Country

        10.3.2. By Closure Type

        10.3.3. By Capacity

        10.3.4. By Application

    10.4. Key Takeaways

11. Western Europe Market Analysis 2019 to 2023 and Forecast 2024 to 2034, By Country

    11.1. Historical Market Size Value (US$ Million) & Volume (Units) Trend Analysis By Market Taxonomy, 2019 to 2023

    11.2. Market Size Value (US$ Million) & Volume (Units) Forecast By Market Taxonomy, 2024 to 2034

        11.2.1. By Country

            11.2.1.1. Germany

            11.2.1.2. UK

            11.2.1.3. France

            11.2.1.4. Spain

            11.2.1.5. Italy

            11.2.1.6. Rest of Western Europe

        11.2.2. By Closure Type

        11.2.3. By Capacity

        11.2.4. By Application

    11.3. Market Attractiveness Analysis

        11.3.1. By Country

        11.3.2. By Closure Type

        11.3.3. By Capacity

        11.3.4. By Application

    11.4. Key Takeaways

12. Eastern Europe Market Analysis 2019 to 2023 and Forecast 2024 to 2034, By Country

    12.1. Historical Market Size Value (US$ Million) & Volume (Units) Trend Analysis By Market Taxonomy, 2019 to 2023

    12.2. Market Size Value (US$ Million) & Volume (Units) Forecast By Market Taxonomy, 2024 to 2034

        12.2.1. By Country

            12.2.1.1. Poland

            12.2.1.2. Russia

            12.2.1.3. Czech Republic

            12.2.1.4. Romania

            12.2.1.5. Rest of Eastern Europe

        12.2.2. By Closure Type

        12.2.3. By Capacity

        12.2.4. By Application

    12.3. Market Attractiveness Analysis

        12.3.1. By Country

        12.3.2. By Closure Type

        12.3.3. By Capacity

        12.3.4. By Application

    12.4. Key Takeaways

13. South Asia and Pacific Market Analysis 2019 to 2023 and Forecast 2024 to 2034, By Country

    13.1. Historical Market Size Value (US$ Million) & Volume (Units) Trend Analysis By Market Taxonomy, 2019 to 2023

    13.2. Market Size Value (US$ Million) & Volume (Units) Forecast By Market Taxonomy, 2024 to 2034

        13.2.1. By Country

            13.2.1.1. India

            13.2.1.2. Bangladesh

            13.2.1.3. Australia

            13.2.1.4. New Zealand

            13.2.1.5. Rest of South Asia and Pacific

        13.2.2. By Closure Type

        13.2.3. By Capacity

        13.2.4. By Application

    13.3. Market Attractiveness Analysis

        13.3.1. By Country

        13.3.2. By Closure Type

        13.3.3. By Capacity

        13.3.4. By Application

    13.4. Key Takeaways

14. East Asia Market Analysis 2019 to 2023 and Forecast 2024 to 2034, By Country

    14.1. Historical Market Size Value (US$ Million) & Volume (Units) Trend Analysis By Market Taxonomy, 2019 to 2023

    14.2. Market Size Value (US$ Million) & Volume (Units) Forecast By Market Taxonomy, 2024 to 2034

        14.2.1. By Country

            14.2.1.1. China

            14.2.1.2. Japan

            14.2.1.3. South Korea

        14.2.2. By Closure Type

        14.2.3. By Capacity

        14.2.4. By Application

    14.3. Market Attractiveness Analysis

        14.3.1. By Country

        14.3.2. By Closure Type

        14.3.3. By Capacity

        14.3.4. By Application

    14.4. Key Takeaways

15. Middle East and Africa Market Analysis 2019 to 2023 and Forecast 2024 to 2034, By Country

    15.1. Historical Market Size Value (US$ Million) & Volume (Units) Trend Analysis By Market Taxonomy, 2019 to 2023

    15.2. Market Size Value (US$ Million) & Volume (Units) Forecast By Market Taxonomy, 2024 to 2034

        15.2.1. By Country

            15.2.1.1. GCC Countries

            15.2.1.2. South Africa

            15.2.1.3. Israel

            15.2.1.4. Rest of MEA

        15.2.2. By Closure Type

        15.2.3. By Capacity

        15.2.4. By Application

    15.3. Market Attractiveness Analysis

        15.3.1. By Country

        15.3.2. By Closure Type

        15.3.3. By Capacity

        15.3.4. By Application

    15.4. Key Takeaways

16. Key Countries Market Analysis

    16.1. USA

        16.1.1. Pricing Analysis

        16.1.2. Market Share Analysis, 2023

            16.1.2.1. By Closure Type

            16.1.2.2. By Capacity

            16.1.2.3. By Application

    16.2. Canada

        16.2.1. Pricing Analysis

        16.2.2. Market Share Analysis, 2023

            16.2.2.1. By Closure Type

            16.2.2.2. By Capacity

            16.2.2.3. By Application

    16.3. Brazil

        16.3.1. Pricing Analysis

        16.3.2. Market Share Analysis, 2023

            16.3.2.1. By Closure Type

            16.3.2.2. By Capacity

            16.3.2.3. By Application

    16.4. Mexico

        16.4.1. Pricing Analysis

        16.4.2. Market Share Analysis, 2023

            16.4.2.1. By Closure Type

            16.4.2.2. By Capacity

            16.4.2.3. By Application

    16.5. Germany

        16.5.1. Pricing Analysis

        16.5.2. Market Share Analysis, 2023

            16.5.2.1. By Closure Type

            16.5.2.2. By Capacity

            16.5.2.3. By Application

    16.6. UK

        16.6.1. Pricing Analysis

        16.6.2. Market Share Analysis, 2023

            16.6.2.1. By Closure Type

            16.6.2.2. By Capacity

            16.6.2.3. By Application

    16.7. France

        16.7.1. Pricing Analysis

        16.7.2. Market Share Analysis, 2023

            16.7.2.1. By Closure Type

            16.7.2.2. By Capacity

            16.7.2.3. By Application

    16.8. Spain

        16.8.1. Pricing Analysis

        16.8.2. Market Share Analysis, 2023

            16.8.2.1. By Closure Type

            16.8.2.2. By Capacity

            16.8.2.3. By Application

    16.9. Italy

        16.9.1. Pricing Analysis

        16.9.2. Market Share Analysis, 2023

            16.9.2.1. By Closure Type

            16.9.2.2. By Capacity

            16.9.2.3. By Application

    16.10. Poland

        16.10.1. Pricing Analysis

        16.10.2. Market Share Analysis, 2023

            16.10.2.1. By Closure Type

            16.10.2.2. By Capacity

            16.10.2.3. By Application

    16.11. Russia

        16.11.1. Pricing Analysis

        16.11.2. Market Share Analysis, 2023

            16.11.2.1. By Closure Type

            16.11.2.2. By Capacity

            16.11.2.3. By Application

    16.12. Czech Republic

        16.12.1. Pricing Analysis

        16.12.2. Market Share Analysis, 2023

            16.12.2.1. By Closure Type

            16.12.2.2. By Capacity

            16.12.2.3. By Application

    16.13. Romania

        16.13.1. Pricing Analysis

        16.13.2. Market Share Analysis, 2023

            16.13.2.1. By Closure Type

            16.13.2.2. By Capacity

            16.13.2.3. By Application

    16.14. India

        16.14.1. Pricing Analysis

        16.14.2. Market Share Analysis, 2023

            16.14.2.1. By Closure Type

            16.14.2.2. By Capacity

            16.14.2.3. By Application

    16.15. Bangladesh

        16.15.1. Pricing Analysis

        16.15.2. Market Share Analysis, 2023

            16.15.2.1. By Closure Type

            16.15.2.2. By Capacity

            16.15.2.3. By Application

    16.16. Australia

        16.16.1. Pricing Analysis

        16.16.2. Market Share Analysis, 2023

            16.16.2.1. By Closure Type

            16.16.2.2. By Capacity

            16.16.2.3. By Application

    16.17. New Zealand

        16.17.1. Pricing Analysis

        16.17.2. Market Share Analysis, 2023

            16.17.2.1. By Closure Type

            16.17.2.2. By Capacity

            16.17.2.3. By Application

    16.18. China

        16.18.1. Pricing Analysis

        16.18.2. Market Share Analysis, 2023

            16.18.2.1. By Closure Type

            16.18.2.2. By Capacity

            16.18.2.3. By Application

    16.19. Japan

        16.19.1. Pricing Analysis

        16.19.2. Market Share Analysis, 2023

            16.19.2.1. By Closure Type

            16.19.2.2. By Capacity

            16.19.2.3. By Application

    16.20. South Korea

        16.20.1. Pricing Analysis

        16.20.2. Market Share Analysis, 2023

            16.20.2.1. By Closure Type

            16.20.2.2. By Capacity

            16.20.2.3. By Application

    16.21. GCC Countries

        16.21.1. Pricing Analysis

        16.21.2. Market Share Analysis, 2023

            16.21.2.1. By Closure Type

            16.21.2.2. By Capacity

            16.21.2.3. By Application

    16.22. South Africa

        16.22.1. Pricing Analysis

        16.22.2. Market Share Analysis, 2023

            16.22.2.1. By Closure Type

            16.22.2.2. By Capacity

            16.22.2.3. By Application

    16.23. Israel

        16.23.1. Pricing Analysis

        16.23.2. Market Share Analysis, 2023

            16.23.2.1. By Closure Type

            16.23.2.2. By Capacity

            16.23.2.3. By Application

17. Market Structure Analysis

    17.1. Competition Dashboard

    17.2. Competition Benchmarking

    17.3. Market Share Analysis of Top Players

        17.3.1. By Regional

        17.3.2. By Closure Type

        17.3.3. By Capacity

        17.3.4. By Application

18. Competition Analysis

    18.1. Competition Deep Dive

        18.1.1. Heinz-Glas

            18.1.1.1. Overview

            18.1.1.2. Product Portfolio

            18.1.1.3. Profitability by Market Segments

            18.1.1.4. Sales Footprint

            18.1.1.5. Strategy Overview

                18.1.1.5.1. Marketing Strategy

                18.1.1.5.2. Product Strategy

                18.1.1.5.3. Channel Strategy

        18.1.2. Piramal Glass

            18.1.2.1. Overview

            18.1.2.2. Product Portfolio

            18.1.2.3. Profitability by Market Segments

            18.1.2.4. Sales Footprint

            18.1.2.5. Strategy Overview

                18.1.2.5.1. Marketing Strategy

                18.1.2.5.2. Product Strategy

                18.1.2.5.3. Channel Strategy

        18.1.3. Pochet

            18.1.3.1. Overview

            18.1.3.2. Product Portfolio

            18.1.3.3. Profitability by Market Segments

            18.1.3.4. Sales Footprint

            18.1.3.5. Strategy Overview

                18.1.3.5.1. Marketing Strategy

                18.1.3.5.2. Product Strategy

                18.1.3.5.3. Channel Strategy

        18.1.4. SGD-Pharma

            18.1.4.1. Overview

            18.1.4.2. Product Portfolio

            18.1.4.3. Profitability by Market Segments

            18.1.4.4. Sales Footprint

            18.1.4.5. Strategy Overview

                18.1.4.5.1. Marketing Strategy

                18.1.4.5.2. Product Strategy

                18.1.4.5.3. Channel Strategy

        18.1.5. Zignago Vetro

            18.1.5.1. Overview

            18.1.5.2. Product Portfolio

            18.1.5.3. Profitability by Market Segments

            18.1.5.4. Sales Footprint

            18.1.5.5. Strategy Overview

                18.1.5.5.1. Marketing Strategy

                18.1.5.5.2. Product Strategy

                18.1.5.5.3. Channel Strategy

        18.1.6. La Glass Vallee

            18.1.6.1. Overview

            18.1.6.2. Product Portfolio

            18.1.6.3. Profitability by Market Segments

            18.1.6.4. Sales Footprint

            18.1.6.5. Strategy Overview

                18.1.6.5.1. Marketing Strategy

                18.1.6.5.2. Product Strategy

                18.1.6.5.3. Channel Strategy

        18.1.7. Bormioli Luigi

            18.1.7.1. Overview

            18.1.7.2. Product Portfolio

            18.1.7.3. Profitability by Market Segments

            18.1.7.4. Sales Footprint

            18.1.7.5. Strategy Overview

                18.1.7.5.1. Marketing Strategy

                18.1.7.5.2. Product Strategy

                18.1.7.5.3. Channel Strategy

        18.1.8. Gerresheimer Group

            18.1.8.1. Overview

            18.1.8.2. Product Portfolio

            18.1.8.3. Profitability by Market Segments

            18.1.8.4. Sales Footprint

            18.1.8.5. Strategy Overview

                18.1.8.5.1. Marketing Strategy

                18.1.8.5.2. Product Strategy

                18.1.8.5.3. Channel Strategy

        18.1.9. Pragati Glass

            18.1.9.1. Overview

            18.1.9.2. Product Portfolio

            18.1.9.3. Profitability by Market Segments

            18.1.9.4. Sales Footprint

            18.1.9.5. Strategy Overview

                18.1.9.5.1. Marketing Strategy

                18.1.9.5.2. Product Strategy

                18.1.9.5.3. Channel Strategy

        18.1.10. Saver Glass

            18.1.10.1. Overview

            18.1.10.2. Product Portfolio

            18.1.10.3. Profitability by Market Segments

            18.1.10.4. Sales Footprint

            18.1.10.5. Strategy Overview

                18.1.10.5.1. Marketing Strategy

                18.1.10.5.2. Product Strategy

                18.1.10.5.3. Channel Strategy

        18.1.11. SGB Packaging Group

            18.1.11.1. Overview

            18.1.11.2. Product Portfolio

            18.1.11.3. Profitability by Market Segments

            18.1.11.4. Sales Footprint

            18.1.11.5. Strategy Overview

                18.1.11.5.1. Marketing Strategy

                18.1.11.5.2. Product Strategy

                18.1.11.5.3. Channel Strategy

        18.1.12. Stoelzle Glass Group

            18.1.12.1. Overview

            18.1.12.2. Product Portfolio

            18.1.12.3. Profitability by Market Segments

            18.1.12.4. Sales Footprint

            18.1.12.5. Strategy Overview

                18.1.12.5.1. Marketing Strategy

                18.1.12.5.2. Product Strategy

                18.1.12.5.3. Channel Strategy

        18.1.13. Vidraria Anchieta

            18.1.13.1. Overview

            18.1.13.2. Product Portfolio

            18.1.13.3. Profitability by Market Segments

            18.1.13.4. Sales Footprint

            18.1.13.5. Strategy Overview

                18.1.13.5.1. Marketing Strategy

                18.1.13.5.2. Product Strategy

                18.1.13.5.3. Channel Strategy

        18.1.14. Roma International Plc

            18.1.14.1. Overview

            18.1.14.2. Product Portfolio

            18.1.14.3. Profitability by Market Segments

            18.1.14.4. Sales Footprint

            18.1.14.5. Strategy Overview

                18.1.14.5.1. Marketing Strategy

                18.1.14.5.2. Product Strategy

                18.1.14.5.3. Channel Strategy

        18.1.15. Sks Bottle & Packaging Inc

            18.1.15.1. Overview

            18.1.15.2. Product Portfolio

            18.1.15.3. Profitability by Market Segments

            18.1.15.4. Sales Footprint

            18.1.15.5. Strategy Overview

                18.1.15.5.1. Marketing Strategy

                18.1.15.5.2. Product Strategy

                18.1.15.5.3. Channel Strategy

19. Assumptions & Acronyms Used

20. Research Methodology

Don't pay for what you don't need

Customize your report by selecting specific countries or regions and save 30%!

List of Tables

Table 1: Global Market Value (US$ Million) Forecast by Region, 2019 to 2034

Table 2: Global Market Volume (Units) Forecast by Region, 2019 to 2034

Table 3: Global Market Value (US$ Million) Forecast by Closure Type, 2019 to 2034

Table 4: Global Market Volume (Units) Forecast by Closure Type, 2019 to 2034

Table 5: Global Market Value (US$ Million) Forecast by Capacity, 2019 to 2034

Table 6: Global Market Volume (Units) Forecast by Capacity, 2019 to 2034

Table 7: Global Market Value (US$ Million) Forecast by Application, 2019 to 2034

Table 8: Global Market Volume (Units) Forecast by Application, 2019 to 2034

Table 9: North America Market Value (US$ Million) Forecast by Country, 2019 to 2034

Table 10: North America Market Volume (Units) Forecast by Country, 2019 to 2034

Table 11: North America Market Value (US$ Million) Forecast by Closure Type, 2019 to 2034

Table 12: North America Market Volume (Units) Forecast by Closure Type, 2019 to 2034

Table 13: North America Market Value (US$ Million) Forecast by Capacity, 2019 to 2034

Table 14: North America Market Volume (Units) Forecast by Capacity, 2019 to 2034

Table 15: North America Market Value (US$ Million) Forecast by Application, 2019 to 2034

Table 16: North America Market Volume (Units) Forecast by Application, 2019 to 2034

Table 17: Latin America Market Value (US$ Million) Forecast by Country, 2019 to 2034

Table 18: Latin America Market Volume (Units) Forecast by Country, 2019 to 2034

Table 19: Latin America Market Value (US$ Million) Forecast by Closure Type, 2019 to 2034

Table 20: Latin America Market Volume (Units) Forecast by Closure Type, 2019 to 2034

Table 21: Latin America Market Value (US$ Million) Forecast by Capacity, 2019 to 2034

Table 22: Latin America Market Volume (Units) Forecast by Capacity, 2019 to 2034

Table 23: Latin America Market Value (US$ Million) Forecast by Application, 2019 to 2034

Table 24: Latin America Market Volume (Units) Forecast by Application, 2019 to 2034

Table 25: Western Europe Market Value (US$ Million) Forecast by Country, 2019 to 2034

Table 26: Western Europe Market Volume (Units) Forecast by Country, 2019 to 2034

Table 27: Western Europe Market Value (US$ Million) Forecast by Closure Type, 2019 to 2034

Table 28: Western Europe Market Volume (Units) Forecast by Closure Type, 2019 to 2034

Table 29: Western Europe Market Value (US$ Million) Forecast by Capacity, 2019 to 2034

Table 30: Western Europe Market Volume (Units) Forecast by Capacity, 2019 to 2034

Table 31: Western Europe Market Value (US$ Million) Forecast by Application, 2019 to 2034

Table 32: Western Europe Market Volume (Units) Forecast by Application, 2019 to 2034

Table 33: Eastern Europe Market Value (US$ Million) Forecast by Country, 2019 to 2034

Table 34: Eastern Europe Market Volume (Units) Forecast by Country, 2019 to 2034

Table 35: Eastern Europe Market Value (US$ Million) Forecast by Closure Type, 2019 to 2034

Table 36: Eastern Europe Market Volume (Units) Forecast by Closure Type, 2019 to 2034

Table 37: Eastern Europe Market Value (US$ Million) Forecast by Capacity, 2019 to 2034

Table 38: Eastern Europe Market Volume (Units) Forecast by Capacity, 2019 to 2034

Table 39: Eastern Europe Market Value (US$ Million) Forecast by Application, 2019 to 2034

Table 40: Eastern Europe Market Volume (Units) Forecast by Application, 2019 to 2034

Table 41: South Asia and Pacific Market Value (US$ Million) Forecast by Country, 2019 to 2034

Table 42: South Asia and Pacific Market Volume (Units) Forecast by Country, 2019 to 2034

Table 43: South Asia and Pacific Market Value (US$ Million) Forecast by Closure Type, 2019 to 2034

Table 44: South Asia and Pacific Market Volume (Units) Forecast by Closure Type, 2019 to 2034

Table 45: South Asia and Pacific Market Value (US$ Million) Forecast by Capacity, 2019 to 2034

Table 46: South Asia and Pacific Market Volume (Units) Forecast by Capacity, 2019 to 2034

Table 47: South Asia and Pacific Market Value (US$ Million) Forecast by Application, 2019 to 2034

Table 48: South Asia and Pacific Market Volume (Units) Forecast by Application, 2019 to 2034

Table 49: East Asia Market Value (US$ Million) Forecast by Country, 2019 to 2034

Table 50: East Asia Market Volume (Units) Forecast by Country, 2019 to 2034

Table 51: East Asia Market Value (US$ Million) Forecast by Closure Type, 2019 to 2034

Table 52: East Asia Market Volume (Units) Forecast by Closure Type, 2019 to 2034

Table 53: East Asia Market Value (US$ Million) Forecast by Capacity, 2019 to 2034

Table 54: East Asia Market Volume (Units) Forecast by Capacity, 2019 to 2034

Table 55: East Asia Market Value (US$ Million) Forecast by Application, 2019 to 2034

Table 56: East Asia Market Volume (Units) Forecast by Application, 2019 to 2034

Table 57: Middle East and Africa Market Value (US$ Million) Forecast by Country, 2019 to 2034

Table 58: Middle East and Africa Market Volume (Units) Forecast by Country, 2019 to 2034

Table 59: Middle East and Africa Market Value (US$ Million) Forecast by Closure Type, 2019 to 2034

Table 60: Middle East and Africa Market Volume (Units) Forecast by Closure Type, 2019 to 2034

Table 61: Middle East and Africa Market Value (US$ Million) Forecast by Capacity, 2019 to 2034

Table 62: Middle East and Africa Market Volume (Units) Forecast by Capacity, 2019 to 2034

Table 63: Middle East and Africa Market Value (US$ Million) Forecast by Application, 2019 to 2034

Table 64: Middle East and Africa Market Volume (Units) Forecast by Application, 2019 to 2034
Ismail Sutaria
Ismail Sutaria

Principal Consultant

Talk to Analyst

Find your sweet spots for generating winning opportunities in this market.

List of Charts

Figure 1: Global Market Value (US$ Million) by Closure Type, 2024 to 2034

Figure 2: Global Market Value (US$ Million) by Capacity, 2024 to 2034

Figure 3: Global Market Value (US$ Million) by Application, 2024 to 2034

Figure 4: Global Market Value (US$ Million) by Region, 2024 to 2034

Figure 5: Global Market Value (US$ Million) Analysis by Region, 2019 to 2034

Figure 6: Global Market Volume (Units) Analysis by Region, 2019 to 2034

Figure 7: Global Market Value Share (%) and BPS Analysis by Region, 2024 to 2034

Figure 8: Global Market Y-o-Y Growth (%) Projections by Region, 2024 to 2034

Figure 9: Global Market Value (US$ Million) Analysis by Closure Type, 2019 to 2034

Figure 10: Global Market Volume (Units) Analysis by Closure Type, 2019 to 2034

Figure 11: Global Market Value Share (%) and BPS Analysis by Closure Type, 2024 to 2034

Figure 12: Global Market Y-o-Y Growth (%) Projections by Closure Type, 2024 to 2034

Figure 13: Global Market Value (US$ Million) Analysis by Capacity, 2019 to 2034

Figure 14: Global Market Volume (Units) Analysis by Capacity, 2019 to 2034

Figure 15: Global Market Value Share (%) and BPS Analysis by Capacity, 2024 to 2034

Figure 16: Global Market Y-o-Y Growth (%) Projections by Capacity, 2024 to 2034

Figure 17: Global Market Value (US$ Million) Analysis by Application, 2019 to 2034

Figure 18: Global Market Volume (Units) Analysis by Application, 2019 to 2034

Figure 19: Global Market Value Share (%) and BPS Analysis by Application, 2024 to 2034

Figure 20: Global Market Y-o-Y Growth (%) Projections by Application, 2024 to 2034

Figure 21: Global Market Attractiveness by Closure Type, 2024 to 2034

Figure 22: Global Market Attractiveness by Capacity, 2024 to 2034

Figure 23: Global Market Attractiveness by Application, 2024 to 2034

Figure 24: Global Market Attractiveness by Region, 2024 to 2034

Figure 25: North America Market Value (US$ Million) by Closure Type, 2024 to 2034

Figure 26: North America Market Value (US$ Million) by Capacity, 2024 to 2034

Figure 27: North America Market Value (US$ Million) by Application, 2024 to 2034

Figure 28: North America Market Value (US$ Million) by Country, 2024 to 2034

Figure 29: North America Market Value (US$ Million) Analysis by Country, 2019 to 2034

Figure 30: North America Market Volume (Units) Analysis by Country, 2019 to 2034

Figure 31: North America Market Value Share (%) and BPS Analysis by Country, 2024 to 2034

Figure 32: North America Market Y-o-Y Growth (%) Projections by Country, 2024 to 2034

Figure 33: North America Market Value (US$ Million) Analysis by Closure Type, 2019 to 2034

Figure 34: North America Market Volume (Units) Analysis by Closure Type, 2019 to 2034

Figure 35: North America Market Value Share (%) and BPS Analysis by Closure Type, 2024 to 2034

Figure 36: North America Market Y-o-Y Growth (%) Projections by Closure Type, 2024 to 2034

Figure 37: North America Market Value (US$ Million) Analysis by Capacity, 2019 to 2034

Figure 38: North America Market Volume (Units) Analysis by Capacity, 2019 to 2034

Figure 39: North America Market Value Share (%) and BPS Analysis by Capacity, 2024 to 2034

Figure 40: North America Market Y-o-Y Growth (%) Projections by Capacity, 2024 to 2034

Figure 41: North America Market Value (US$ Million) Analysis by Application, 2019 to 2034

Figure 42: North America Market Volume (Units) Analysis by Application, 2019 to 2034

Figure 43: North America Market Value Share (%) and BPS Analysis by Application, 2024 to 2034

Figure 44: North America Market Y-o-Y Growth (%) Projections by Application, 2024 to 2034

Figure 45: North America Market Attractiveness by Closure Type, 2024 to 2034

Figure 46: North America Market Attractiveness by Capacity, 2024 to 2034

Figure 47: North America Market Attractiveness by Application, 2024 to 2034

Figure 48: North America Market Attractiveness by Country, 2024 to 2034

Figure 49: Latin America Market Value (US$ Million) by Closure Type, 2024 to 2034

Figure 50: Latin America Market Value (US$ Million) by Capacity, 2024 to 2034

Figure 51: Latin America Market Value (US$ Million) by Application, 2024 to 2034

Figure 52: Latin America Market Value (US$ Million) by Country, 2024 to 2034

Figure 53: Latin America Market Value (US$ Million) Analysis by Country, 2019 to 2034

Figure 54: Latin America Market Volume (Units) Analysis by Country, 2019 to 2034

Figure 55: Latin America Market Value Share (%) and BPS Analysis by Country, 2024 to 2034

Figure 56: Latin America Market Y-o-Y Growth (%) Projections by Country, 2024 to 2034

Figure 57: Latin America Market Value (US$ Million) Analysis by Closure Type, 2019 to 2034

Figure 58: Latin America Market Volume (Units) Analysis by Closure Type, 2019 to 2034

Figure 59: Latin America Market Value Share (%) and BPS Analysis by Closure Type, 2024 to 2034

Figure 60: Latin America Market Y-o-Y Growth (%) Projections by Closure Type, 2024 to 2034

Figure 61: Latin America Market Value (US$ Million) Analysis by Capacity, 2019 to 2034

Figure 62: Latin America Market Volume (Units) Analysis by Capacity, 2019 to 2034

Figure 63: Latin America Market Value Share (%) and BPS Analysis by Capacity, 2024 to 2034

Figure 64: Latin America Market Y-o-Y Growth (%) Projections by Capacity, 2024 to 2034

Figure 65: Latin America Market Value (US$ Million) Analysis by Application, 2019 to 2034

Figure 66: Latin America Market Volume (Units) Analysis by Application, 2019 to 2034

Figure 67: Latin America Market Value Share (%) and BPS Analysis by Application, 2024 to 2034

Figure 68: Latin America Market Y-o-Y Growth (%) Projections by Application, 2024 to 2034

Figure 69: Latin America Market Attractiveness by Closure Type, 2024 to 2034

Figure 70: Latin America Market Attractiveness by Capacity, 2024 to 2034

Figure 71: Latin America Market Attractiveness by Application, 2024 to 2034

Figure 72: Latin America Market Attractiveness by Country, 2024 to 2034

Figure 73: Western Europe Market Value (US$ Million) by Closure Type, 2024 to 2034

Figure 74: Western Europe Market Value (US$ Million) by Capacity, 2024 to 2034

Figure 75: Western Europe Market Value (US$ Million) by Application, 2024 to 2034

Figure 76: Western Europe Market Value (US$ Million) by Country, 2024 to 2034

Figure 77: Western Europe Market Value (US$ Million) Analysis by Country, 2019 to 2034

Figure 78: Western Europe Market Volume (Units) Analysis by Country, 2019 to 2034

Figure 79: Western Europe Market Value Share (%) and BPS Analysis by Country, 2024 to 2034

Figure 80: Western Europe Market Y-o-Y Growth (%) Projections by Country, 2024 to 2034

Figure 81: Western Europe Market Value (US$ Million) Analysis by Closure Type, 2019 to 2034

Figure 82: Western Europe Market Volume (Units) Analysis by Closure Type, 2019 to 2034

Figure 83: Western Europe Market Value Share (%) and BPS Analysis by Closure Type, 2024 to 2034

Figure 84: Western Europe Market Y-o-Y Growth (%) Projections by Closure Type, 2024 to 2034

Figure 85: Western Europe Market Value (US$ Million) Analysis by Capacity, 2019 to 2034

Figure 86: Western Europe Market Volume (Units) Analysis by Capacity, 2019 to 2034

Figure 87: Western Europe Market Value Share (%) and BPS Analysis by Capacity, 2024 to 2034

Figure 88: Western Europe Market Y-o-Y Growth (%) Projections by Capacity, 2024 to 2034

Figure 89: Western Europe Market Value (US$ Million) Analysis by Application, 2019 to 2034

Figure 90: Western Europe Market Volume (Units) Analysis by Application, 2019 to 2034

Figure 91: Western Europe Market Value Share (%) and BPS Analysis by Application, 2024 to 2034

Figure 92: Western Europe Market Y-o-Y Growth (%) Projections by Application, 2024 to 2034

Figure 93: Western Europe Market Attractiveness by Closure Type, 2024 to 2034

Figure 94: Western Europe Market Attractiveness by Capacity, 2024 to 2034

Figure 95: Western Europe Market Attractiveness by Application, 2024 to 2034

Figure 96: Western Europe Market Attractiveness by Country, 2024 to 2034

Figure 97: Eastern Europe Market Value (US$ Million) by Closure Type, 2024 to 2034

Figure 98: Eastern Europe Market Value (US$ Million) by Capacity, 2024 to 2034

Figure 99: Eastern Europe Market Value (US$ Million) by Application, 2024 to 2034

Figure 100: Eastern Europe Market Value (US$ Million) by Country, 2024 to 2034

Figure 101: Eastern Europe Market Value (US$ Million) Analysis by Country, 2019 to 2034

Figure 102: Eastern Europe Market Volume (Units) Analysis by Country, 2019 to 2034

Figure 103: Eastern Europe Market Value Share (%) and BPS Analysis by Country, 2024 to 2034

Figure 104: Eastern Europe Market Y-o-Y Growth (%) Projections by Country, 2024 to 2034

Figure 105: Eastern Europe Market Value (US$ Million) Analysis by Closure Type, 2019 to 2034

Figure 106: Eastern Europe Market Volume (Units) Analysis by Closure Type, 2019 to 2034

Figure 107: Eastern Europe Market Value Share (%) and BPS Analysis by Closure Type, 2024 to 2034

Figure 108: Eastern Europe Market Y-o-Y Growth (%) Projections by Closure Type, 2024 to 2034

Figure 109: Eastern Europe Market Value (US$ Million) Analysis by Capacity, 2019 to 2034

Figure 110: Eastern Europe Market Volume (Units) Analysis by Capacity, 2019 to 2034

Figure 111: Eastern Europe Market Value Share (%) and BPS Analysis by Capacity, 2024 to 2034

Figure 112: Eastern Europe Market Y-o-Y Growth (%) Projections by Capacity, 2024 to 2034

Figure 113: Eastern Europe Market Value (US$ Million) Analysis by Application, 2019 to 2034

Figure 114: Eastern Europe Market Volume (Units) Analysis by Application, 2019 to 2034

Figure 115: Eastern Europe Market Value Share (%) and BPS Analysis by Application, 2024 to 2034

Figure 116: Eastern Europe Market Y-o-Y Growth (%) Projections by Application, 2024 to 2034

Figure 117: Eastern Europe Market Attractiveness by Closure Type, 2024 to 2034

Figure 118: Eastern Europe Market Attractiveness by Capacity, 2024 to 2034

Figure 119: Eastern Europe Market Attractiveness by Application, 2024 to 2034

Figure 120: Eastern Europe Market Attractiveness by Country, 2024 to 2034

Figure 121: South Asia and Pacific Market Value (US$ Million) by Closure Type, 2024 to 2034

Figure 122: South Asia and Pacific Market Value (US$ Million) by Capacity, 2024 to 2034

Figure 123: South Asia and Pacific Market Value (US$ Million) by Application, 2024 to 2034

Figure 124: South Asia and Pacific Market Value (US$ Million) by Country, 2024 to 2034

Figure 125: South Asia and Pacific Market Value (US$ Million) Analysis by Country, 2019 to 2034

Figure 126: South Asia and Pacific Market Volume (Units) Analysis by Country, 2019 to 2034

Figure 127: South Asia and Pacific Market Value Share (%) and BPS Analysis by Country, 2024 to 2034

Figure 128: South Asia and Pacific Market Y-o-Y Growth (%) Projections by Country, 2024 to 2034

Figure 129: South Asia and Pacific Market Value (US$ Million) Analysis by Closure Type, 2019 to 2034

Figure 130: South Asia and Pacific Market Volume (Units) Analysis by Closure Type, 2019 to 2034

Figure 131: South Asia and Pacific Market Value Share (%) and BPS Analysis by Closure Type, 2024 to 2034

Figure 132: South Asia and Pacific Market Y-o-Y Growth (%) Projections by Closure Type, 2024 to 2034

Figure 133: South Asia and Pacific Market Value (US$ Million) Analysis by Capacity, 2019 to 2034

Figure 134: South Asia and Pacific Market Volume (Units) Analysis by Capacity, 2019 to 2034

Figure 135: South Asia and Pacific Market Value Share (%) and BPS Analysis by Capacity, 2024 to 2034

Figure 136: South Asia and Pacific Market Y-o-Y Growth (%) Projections by Capacity, 2024 to 2034

Figure 137: South Asia and Pacific Market Value (US$ Million) Analysis by Application, 2019 to 2034

Figure 138: South Asia and Pacific Market Volume (Units) Analysis by Application, 2019 to 2034

Figure 139: South Asia and Pacific Market Value Share (%) and BPS Analysis by Application, 2024 to 2034

Figure 140: South Asia and Pacific Market Y-o-Y Growth (%) Projections by Application, 2024 to 2034

Figure 141: South Asia and Pacific Market Attractiveness by Closure Type, 2024 to 2034

Figure 142: South Asia and Pacific Market Attractiveness by Capacity, 2024 to 2034

Figure 143: South Asia and Pacific Market Attractiveness by Application, 2024 to 2034

Figure 144: South Asia and Pacific Market Attractiveness by Country, 2024 to 2034

Figure 145: East Asia Market Value (US$ Million) by Closure Type, 2024 to 2034

Figure 146: East Asia Market Value (US$ Million) by Capacity, 2024 to 2034

Figure 147: East Asia Market Value (US$ Million) by Application, 2024 to 2034

Figure 148: East Asia Market Value (US$ Million) by Country, 2024 to 2034

Figure 149: East Asia Market Value (US$ Million) Analysis by Country, 2019 to 2034

Figure 150: East Asia Market Volume (Units) Analysis by Country, 2019 to 2034

Figure 151: East Asia Market Value Share (%) and BPS Analysis by Country, 2024 to 2034

Figure 152: East Asia Market Y-o-Y Growth (%) Projections by Country, 2024 to 2034

Figure 153: East Asia Market Value (US$ Million) Analysis by Closure Type, 2019 to 2034

Figure 154: East Asia Market Volume (Units) Analysis by Closure Type, 2019 to 2034

Figure 155: East Asia Market Value Share (%) and BPS Analysis by Closure Type, 2024 to 2034

Figure 156: East Asia Market Y-o-Y Growth (%) Projections by Closure Type, 2024 to 2034

Figure 157: East Asia Market Value (US$ Million) Analysis by Capacity, 2019 to 2034

Figure 158: East Asia Market Volume (Units) Analysis by Capacity, 2019 to 2034

Figure 159: East Asia Market Value Share (%) and BPS Analysis by Capacity, 2024 to 2034

Figure 160: East Asia Market Y-o-Y Growth (%) Projections by Capacity, 2024 to 2034

Figure 161: East Asia Market Value (US$ Million) Analysis by Application, 2019 to 2034

Figure 162: East Asia Market Volume (Units) Analysis by Application, 2019 to 2034

Figure 163: East Asia Market Value Share (%) and BPS Analysis by Application, 2024 to 2034

Figure 164: East Asia Market Y-o-Y Growth (%) Projections by Application, 2024 to 2034

Figure 165: East Asia Market Attractiveness by Closure Type, 2024 to 2034

Figure 166: East Asia Market Attractiveness by Capacity, 2024 to 2034

Figure 167: East Asia Market Attractiveness by Application, 2024 to 2034

Figure 168: East Asia Market Attractiveness by Country, 2024 to 2034

Figure 169: Middle East and Africa Market Value (US$ Million) by Closure Type, 2024 to 2034

Figure 170: Middle East and Africa Market Value (US$ Million) by Capacity, 2024 to 2034

Figure 171: Middle East and Africa Market Value (US$ Million) by Application, 2024 to 2034

Figure 172: Middle East and Africa Market Value (US$ Million) by Country, 2024 to 2034

Figure 173: Middle East and Africa Market Value (US$ Million) Analysis by Country, 2019 to 2034

Figure 174: Middle East and Africa Market Volume (Units) Analysis by Country, 2019 to 2034

Figure 175: Middle East and Africa Market Value Share (%) and BPS Analysis by Country, 2024 to 2034

Figure 176: Middle East and Africa Market Y-o-Y Growth (%) Projections by Country, 2024 to 2034

Figure 177: Middle East and Africa Market Value (US$ Million) Analysis by Closure Type, 2019 to 2034

Figure 178: Middle East and Africa Market Volume (Units) Analysis by Closure Type, 2019 to 2034

Figure 179: Middle East and Africa Market Value Share (%) and BPS Analysis by Closure Type, 2024 to 2034

Figure 180: Middle East and Africa Market Y-o-Y Growth (%) Projections by Closure Type, 2024 to 2034

Figure 181: Middle East and Africa Market Value (US$ Million) Analysis by Capacity, 2019 to 2034

Figure 182: Middle East and Africa Market Volume (Units) Analysis by Capacity, 2019 to 2034

Figure 183: Middle East and Africa Market Value Share (%) and BPS Analysis by Capacity, 2024 to 2034

Figure 184: Middle East and Africa Market Y-o-Y Growth (%) Projections by Capacity, 2024 to 2034

Figure 185: Middle East and Africa Market Value (US$ Million) Analysis by Application, 2019 to 2034

Figure 186: Middle East and Africa Market Volume (Units) Analysis by Application, 2019 to 2034

Figure 187: Middle East and Africa Market Value Share (%) and BPS Analysis by Application, 2024 to 2034

Figure 188: Middle East and Africa Market Y-o-Y Growth (%) Projections by Application, 2024 to 2034

Figure 189: Middle East and Africa Market Attractiveness by Closure Type, 2024 to 2034

Figure 190: Middle East and Africa Market Attractiveness by Capacity, 2024 to 2034

Figure 191: Middle East and Africa Market Attractiveness by Application, 2024 to 2034

Figure 192: Middle East and Africa Market Attractiveness by Country, 2024 to 2034

Recommendations

Packaging

Glass Medicine Bottles Market

Published : April 2023

Packaging

Glass Bottles Market

Published : February 2023

Packaging

Boston Round Glass Bottle Market

Published : September 2022

Packaging

Glass Liquor Bottles Market

Published : June 2022

Explore Packaging Insights

View Reports

Glass Cosmetic Bottle Market