The global glass reactor market is likely to reach USD 1.9 billion by 2035, recording an absolute increase of USD 0.8 billion over the forecast period. The market is valued at USD 1.1 billion in 2025 and is set to rise at a CAGR of 5.9% during the assessment period. The overall market size is expected to grow by 1.7 times during the same period, supported by increasing adoption of pilot-scale process development and stringent GMP compliance requirements worldwide, driving demand for advanced glass-lined reaction systems and increasing investments in specialty chemical manufacturing, pharmaceutical API production, and university-industry R&D collaborations globally.
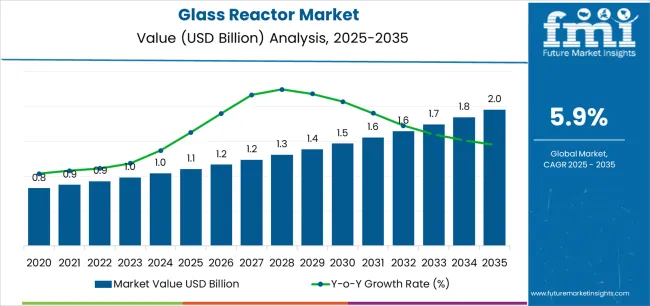
Between 2025 and 2030, the glass reactor market is projected to expand from USD 1.1 billion to USD 1.5 billion, resulting in a value increase of USD 0.4 billion, which represents 50.0% of the total forecast growth for the decade. This phase of development will be shaped by rising demand for pilot-scale process development and pharmaceutical intermediate manufacturing solutions, product innovation in multi-jacketed thermal management systems and continuous-flow reactor technologies, as well as expanding integration with digital instrumentation platforms and automated process control initiatives. Companies are establishing competitive positions through investment in modular reactor design capabilities, advanced heat-transfer engineering, and strategic market expansion across pharmaceutical API production, specialty chemicals synthesis, and academic research applications.
From 2030 to 2035, the market is forecast to grow from USD 1.5 billion to USD 1.9 billion, adding another USD 0.4 billion, which constitutes 50.0% of the overall ten-year expansion. This period is expected to be characterized by the expansion of specialized continuous-flow systems, including advanced microreactor technologies and integrated automated synthesis platforms tailored for specific chemical reactions and pharmaceutical processes, strategic collaborations between equipment manufacturers and pharmaceutical companies, and an enhanced focus on process intensification and sustainable manufacturing. The growing emphasis on green chemistry principles and digital process optimization will drive demand for advanced, high-performance glass reactor solutions across diverse chemical synthesis and pharmaceutical development applications.
| Metric | Value |
|---|---|
| Market Value (2025) | USD 1.1 billion |
| Market Forecast Value (2035) | USD 1.9 billion |
| Forecast CAGR (2025-2035) | 5.9% |
The glass reactor market grows by enabling chemical engineers, pharmaceutical researchers, and process development scientists to achieve superior reaction visualization and contamination control while meeting evolving quality and safety compliance demands. Process development teams face mounting pressure to accelerate scale-up timelines and improve process understanding, with glass reactor systems providing exceptional chemical resistance and visual monitoring capabilities that enable 30-40% faster process optimization compared to opaque metal reactors, making transparent reaction vessels essential for pilot-scale development, pharmaceutical synthesis, and specialty chemical production. The pharmaceutical industry's need for GMP-compliant equipment with superior corrosion resistance creates demand for advanced glass-lined and borosilicate reactor solutions that can enhance process control, enable real-time reaction monitoring, and ensure consistent performance across diverse chemical synthesis applications.
Government initiatives promoting pharmaceutical manufacturing self-sufficiency and specialty chemical production drive adoption in API manufacturing, fine chemical synthesis, and research applications, where equipment quality has a direct impact on product purity and regulatory compliance. The global shift toward sustainable chemistry and process intensification accelerates glass reactor demand as researchers seek equipment that enables precise thermal control and efficient small-batch production. The higher initial capital costs compared to conventional stainless steel reactors and material fragility concerns may limit adoption rates among cost-sensitive manufacturers and high-volume commodity chemical producers operating with standardized equipment.
The market is segmented by end use, design, capacity, and region. By end use, the market is divided into chemical process industries (including basic chemicals, specialty & fine chemicals, agrochemicals, and others), pharmaceuticals, academic & research institutions, and other applications. Based on design, the market is categorized into multi-jacketed systems (including triple-jacket, dual-circulation/recirculating loops, and cryo-ready sub-assemblies), single-jacketed, and jacketed-less configurations. By capacity, the market includes ≤5 L, 5-15 L, 15-30 L, 30-60 L, 60-100 L, 100-300 L, and >300 L systems. Regionally, the market is divided into North America, Europe, Asia Pacific, Latin America, and Middle East & Africa.
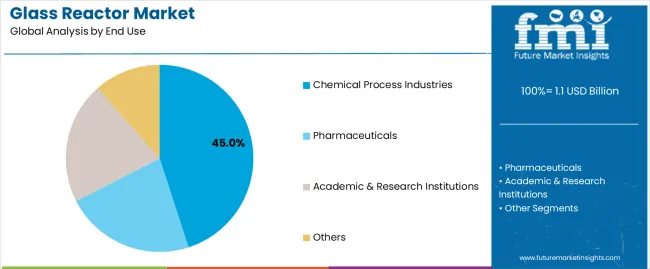
The chemical process industries segment represents the dominant force in the glass reactor market, capturing approximately 45.0% of total market share in 2025. This advanced category encompasses pilot-scale and production facilities for basic chemicals (18.0% market share), specialty & fine chemicals (14.0% share), agrochemicals (7.0% share), and other applications including flavors & fragrances and dyes (6.0% share), featuring superior corrosion resistance for aggressive chemical environments, visual process monitoring capabilities, and precise temperature control delivering comprehensive performance for demanding synthesis operations. The chemical process industries segment's market leadership stems from its fundamental requirement for corrosion-resistant equipment in handling strong acids, bases, and solvents, the critical need for visual reaction monitoring during process development and scale-up, and compatibility with specialty chemical production that requires frequent product changeovers and thorough cleaning protocols.
Basic chemicals manufacturing maintains the largest subsegment at 18.0% market share, serving pilot plants and small-batch production for commodity intermediates requiring corrosion-resistant reaction vessels. Specialty & fine chemicals production accounts for 14.0% market share, offering high-value synthesis applications where product purity and process control are paramount. Agrochemicals manufacturing represents 7.0% of the market, supporting pesticide and herbicide intermediate production with stringent quality requirements. Other applications including flavors, fragrances, and dyes hold 6.0% market share, featuring specialized synthesis requiring superior glass compatibility and contamination prevention.
Key advantages driving the chemical process industries segment include:
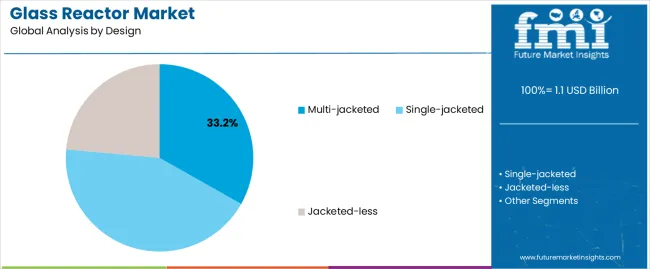
The multi-jacketed segment represents the leading design category in the glass reactor market, capturing approximately 33.2% of total market share in 2025. This critical design encompasses advanced thermal management systems including triple-jacket configurations with heating/cooling/thermal buffer capabilities (12.0% market share), dual-circulation/recirculating loop systems (11.5% share), and cryo-ready sub-assemblies for cryogenic applications (9.7% share), where sophisticated heat-transfer architectures provide superior temperature control precision and rapid thermal response for demanding reaction protocols. The multi-jacketed segment's dominance reflects the fundamental advantages of enhanced thermal management in pharmaceutical synthesis and specialty chemical production requiring precise exothermic reaction control and wide operating temperature ranges.
Triple-jacket systems maintain 12.0% market share, serving applications requiring independent heating and cooling circuits with thermal buffer zones for enhanced temperature stability and safety. Dual-circulation/recirculating loop configurations account for 11.5% market share, offering efficient heat transfer through optimized fluid flow patterns and reduced thermal gradients. Cryo-ready sub-assemblies represent 9.7% of the market, supporting low-temperature chemistry including organometallic reactions and controlled crystallization processes requiring temperatures below -40°C.
Key factors driving multi-jacketed segment leadership include:
The market is driven by three concrete demand factors tied to pharmaceutical development and specialty chemical innovation outcomes. First, pharmaceutical API manufacturing expansion and process development activities create increasing requirements for corrosion-resistant pilot equipment, with global pharmaceutical R&D investment growing 6-8% annually requiring glass reactor capacity for drug substance synthesis, process optimization, and technology transfer supporting regulatory filing requirements. Second, specialty chemical production diversification and fine chemical manufacturing growth drive adoption, with glass reactors enabling 25-35% faster product changeovers compared to metal vessels through superior cleaning characteristics and visual contamination verification capabilities essential for multi-product facilities. Third, academic research intensification and university-industry collaboration expansion accelerate equipment demand, with research institutions requiring versatile glass reactor systems supporting diverse chemistry programs including organic synthesis, materials science, and green chemistry development across teaching laboratories and research centers.
Market restraints include high capital costs affecting equipment accessibility for small research groups, with advanced multi-jacketed glass reactor systems priced 40-60% higher than comparable stainless steel alternatives, creating financial barriers for startup chemical companies and academic laboratories operating on constrained equipment budgets. Material fragility concerns and handling requirements pose operational challenges, as borosilicate glass components require careful installation, specialized mounting systems, and operator training to prevent damage during maintenance and cleaning procedures that metal reactors withstand more readily. Competition from alternative reactor technologies creates additional pressures, particularly continuous-flow microreactors and advanced metal alloy systems where specialized applications may favor alternative materials offering superior pressure ratings, thermal shock resistance, or automated operation capabilities beyond glass reactor specifications.
Key trends indicate accelerated adoption of continuous-flow glass reactor systems in pharmaceutical development, particularly for research applications where flow chemistry enables rapid reaction screening, improved heat transfer, and enhanced process safety while maintaining visual monitoring advantages and corrosion resistance benefits of glass construction. Digitalization and process automation integration trends toward glass reactors equipped with comprehensive instrumentation suites, automated sampling systems, and cloud-connected data logging platforms are enabling next-generation process understanding and regulatory compliance documentation capabilities. The market thesis could face disruption if advanced ceramic or polymer composite reactor materials achieve comparable corrosion resistance and visual monitoring capabilities with superior mechanical properties, potentially reshaping equipment selection criteria and investment priorities across pharmaceutical and specialty chemical manufacturing sectors.
| Country | CAGR (2025-2035) |
|---|---|
| Saudi Arabia | 8.8% |
| Brazil | 8.7% |
| India | 5.8% |
| Germany | 5.2% |
| China | 4.9% |
| South Korea | 4.6% |
| USA | 4.2% |
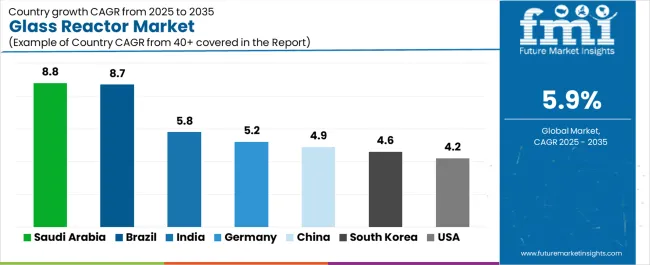
The glass reactor market is gaining momentum worldwide, with Saudi Arabia taking the lead thanks to petrochemicals investments and pilot/demo units tied to downstream diversification programs. Close behind, Brazil benefits from pilot-scale R&D for upstream/downstream oil chemistry and specialty intermediates production, positioning itself as a strategic growth hub in the Latin American region. India shows strong advancement, where scale-up of fine-chem/pharma intermediates and new pilot plants in API clusters strengthen its role in pharmaceutical manufacturing. Germany demonstrates robust growth through process intensification initiatives and GMP compliance upgrades, signaling continued investment in advanced manufacturing infrastructure. Meanwhile, China stands out for continuous process trials and refinery/petrochem integration projects, while South Korea and the USA continue to record consistent progress driven by electronic chemicals development and institutional R&D funding. Together, Saudi Arabia and Brazil anchor the global expansion story, while established markets build stability and diversity into the market's growth path.
The report covers an in-depth analysis of 40+ countries, Top-performing countries are highlighted below.
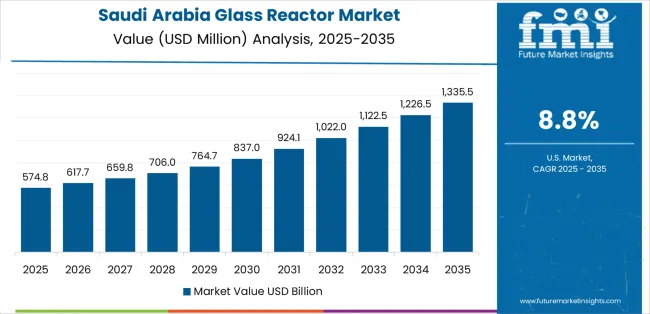
Saudi Arabia demonstrates the strongest growth potential in the Glass Reactor Market with a CAGR of 8.8% through 2035. The country's leadership position stems from comprehensive petrochemical diversification initiatives, intensive downstream chemical development programs, and strategic technology demonstration projects driving adoption of advanced pilot-scale glass reactor systems. Growth is concentrated in major industrial regions, including Jubail Industrial City, Yanbu, Ras Al-Khair, and emerging economic zones, where petrochemical companies, research institutes, and technology centers are implementing glass reactor facilities for process development and specialty chemical pilot production. Distribution channels through specialized engineering contractors, international equipment suppliers, and direct facility procurement relationships expand deployment across petrochemical complexes and R&D centers. The country's Vision 2030 diversification initiatives and National Industrial Development and Logistics Program provide policy support for advanced manufacturing capabilities, including financing schemes for pilot plant equipment and technology transfer infrastructure.
Key market factors:
In major industrial centers, research institutes, and chemical production zones, the adoption of glass reactor systems is accelerating across petroleum chemistry applications, specialty intermediate development, and pharmaceutical API projects, driven by oil & gas sector innovation and specialty chemical manufacturing expansion. The market demonstrates strong growth momentum with a CAGR of 8.7% through 2035, linked to comprehensive process development intensification and increasing focus on high-value chemical production enhancement solutions. Brazilian chemical engineers are implementing advanced glass reactor equipment and process monitoring platforms to optimize synthesis conditions while meeting product quality standards in key industrial regions including São Paulo, Rio de Janeiro, Bahia, and Rio Grande do Sul. The country's natural resource processing capabilities and pharmaceutical manufacturing ambitions create sustained demand for pilot-scale equipment solutions, while increasing emphasis on specialty chemicals drives adoption of corrosion-resistant glass reactor systems that enhance process development capabilities.
India's expanding pharmaceutical sector demonstrates sophisticated implementation of glass reactor systems, with documented case studies showing 30-40% process development acceleration in API manufacturing and fine chemical production through advanced pilot equipment adoption. The country's pharmaceutical infrastructure in major producing regions, including Hyderabad, Ahmedabad, Mumbai, and Visakhapatnam, showcases integration of glass reactor technologies with existing manufacturing practices, leveraging expertise in pharmaceutical synthesis and specialty chemical production. Indian pharmaceutical manufacturers emphasize equipment quality and regulatory compliance, creating demand for GMP-compliant glass reactor systems that support drug master file submissions and international quality standards. The market maintains strong growth through focus on API manufacturing expansion and pharmaceutical innovation, with a CAGR of 5.8% through 2035.
Key development areas:
Germany's glass reactor market demonstrates sophisticated implementation focused on process intensification systems and GMP compliance requirements, with documented integration achieving significant efficiency improvements in pharmaceutical development and specialty chemical optimization. The country maintains steady growth momentum with a CAGR of 5.2% through 2035, driven by stringent quality regulations and manufacturers' emphasis on advanced process technology principles aligned with sustainable manufacturing practices. Major chemical and pharmaceutical regions, including Bavaria, North Rhine-Westphalia, Baden-Württemberg, and Hesse, showcase advanced deployment of multi-jacketed glass reactor systems that integrate seamlessly with existing R&D infrastructure and pilot plant facilities.
Key market characteristics:
The Chinese market demonstrates significant advancement in glass reactor implementation based on continuous process development initiatives and refinery/petrochemical integration projects for enhanced chemical production efficiency. The country shows solid potential with a CAGR of 4.9% through 2035, driven by industrial modernization programs and increasing emphasis on process optimization across major chemical production regions, including Yangtze River Delta, Pearl River Delta, Bohai Rim, and Western chemical corridors. Chinese process engineers are adopting glass reactor technology for pilot-scale trials and technology verification, particularly in pharmaceutical intermediate production and specialty chemical development requiring corrosion-resistant equipment. Technology deployment channels through domestic equipment manufacturers, international supplier partnerships, and direct facility procurement programs expand coverage across diverse industrial applications.
Leading market segments:
South Korea's glass reactor market demonstrates sophisticated implementation focused on electronic chemicals development and battery materials processing, with documented integration achieving precise process control in high-purity chemical synthesis applications. The country maintains steady growth momentum with a CAGR of 4.6% through 2035, driven by semiconductor industry requirements and operators' emphasis on contamination control principles aligned with advanced materials manufacturing. Major industrial and research regions, including Seoul metropolitan area, Gyeonggi Province, Chungcheong industrial zones, and Ulsan chemical complex, showcase advanced deployment of glass reactor systems that integrate seamlessly with cleanroom facilities and materials characterization infrastructure.
Key market characteristics:
The United States' glass reactor market demonstrates mature implementation focused on institutional R&D programs and specialty chemical capacity optimization, with documented integration achieving enhanced process understanding through visual monitoring and comprehensive instrumentation. The country maintains steady growth through research funding initiatives and chemical industry innovation, with a CAGR of 4.2% through 2035, driven by comprehensive academic research programs and specialty chemical manufacturers' debottlenecking projects. Major research and industrial regions, including Northeast pharmaceutical corridor, Midwest chemical belt, Gulf Coast petrochemical complex, and West Coast biotech hubs, showcase advanced glass reactor deployment where researchers and engineers integrate transparent reaction vessels with existing laboratory and pilot plant infrastructure.
Key market characteristics:
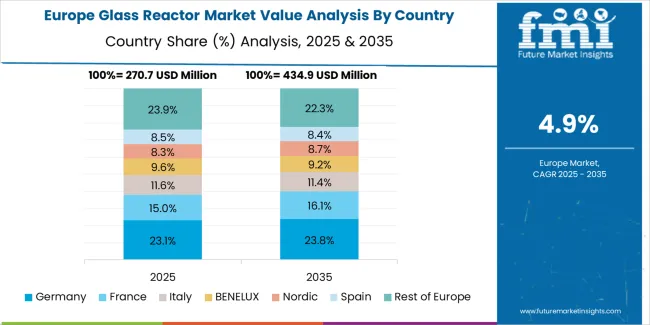
The glass reactor market in Europe accounts for a substantial share of global demand, anchored by GMP-compliant pharmaceutical manufacturing, specialty chemicals production, and university-industry R&D ecosystems. Germany leads with approximately 22.0% of European market share in 2025, supported by its advanced pharmaceutical development infrastructure and major process technology centers across Bavaria, North Rhine-Westphalia, and Hesse regions. France follows with a 14.0% share, driven by comprehensive pharmaceutical research programs and specialty chemical manufacturing including fine chemical synthesis and agrochemical intermediate production. The United Kingdom holds a 13.0% share, supported by pharmaceutical development activities and academic research excellence. Italy commands an 11.0% share, backed by fine chemical production and pharmaceutical API manufacturing. Spain accounts for 8.0% through pharmaceutical contract manufacturing and specialty chemical development. The Nordic countries represent 7.0% with strong pharmaceutical innovation and sustainable chemistry research, while Benelux maintains 7.0% share through chemical research excellence and pharmaceutical pilot facilities. Central & Eastern Europe holds 18.0% share, driven by pharmaceutical manufacturing expansion, chemical industry modernization, and growing research infrastructure investment across Poland, Czech Republic, Hungary, and other emerging production centers.
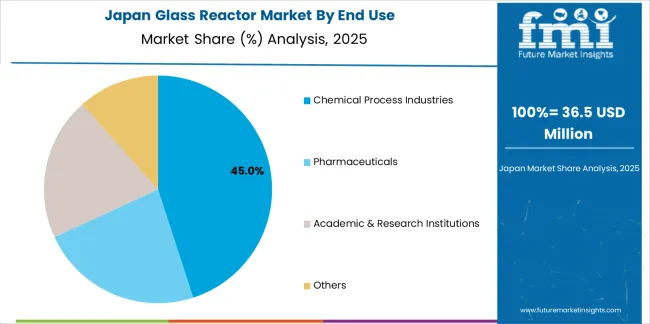
The Japanese glass reactor market demonstrates a mature and quality-focused landscape, characterized by sophisticated integration of precision-engineered borosilicate systems and advanced thermal control technologies with existing pharmaceutical research infrastructure across drug development facilities, university chemistry departments, and specialty chemical production operations. Japan's emphasis on manufacturing excellence and quality assurance drives demand for premium glass reactor equipment that supports rigorous validation requirements and performance expectations in domestic pharmaceutical and chemical standards. The market benefits from strong partnerships between international equipment manufacturers and domestic engineering firms including process technology associations, creating comprehensive service ecosystems that prioritize equipment reliability and technical support programs. Research centers in Tokyo, Osaka, Kyoto, and other major academic hubs showcase advanced glass reactor implementations where pilot programs achieve exceptional process reproducibility through precision temperature control systems and integrated analytical monitoring platforms.
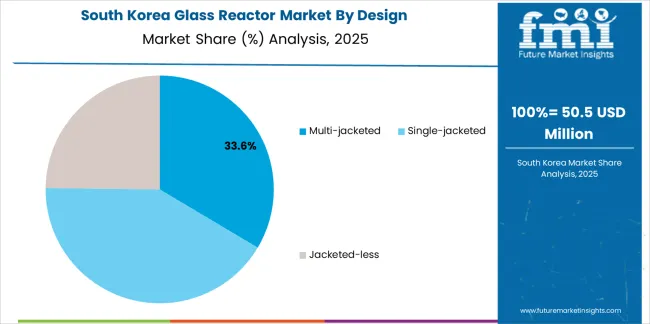
The South Korean glass reactor market is characterized by growing international technology provider presence, with companies maintaining significant positions through comprehensive installation support and application engineering capabilities for semiconductor chemicals and advanced materials applications. The market demonstrates increasing emphasis on ultra-high purity systems and contamination-free processing technologies, as Korean chemical manufacturers increasingly demand specialized glass reactor equipment that integrates with domestic quality management systems and sophisticated production control platforms deployed across electronics and battery materials facilities. Regional engineering contractors are gaining market share through strategic partnerships with international manufacturers, offering specialized services including cleanroom installation support and application-specific reactor configuration programs for demanding electronic chemicals synthesis. The competitive landscape shows increasing collaboration between multinational equipment companies and Korean process technology specialists, creating hybrid service models that combine international manufacturing expertise with local application knowledge and precision chemical synthesis requirements.
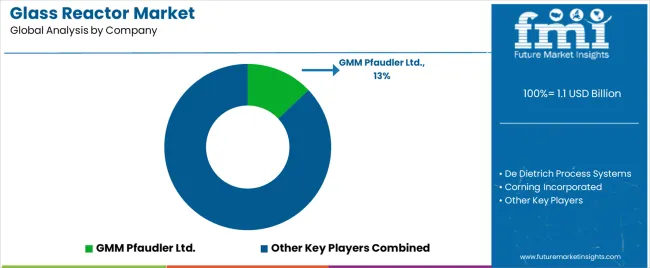
The glass reactor market features approximately 10-15 meaningful players with moderate concentration, where the top three companies control roughly 35-40% of global market share through established distribution networks and comprehensive product portfolios. Competition centers on thermal control precision, equipment reliability, and application engineering capabilities rather than price competition alone. GMM Pfaudler Ltd. leads with approximately 14.0% market share through its comprehensive glass-lined and borosilicate reactor product portfolio spanning pilot to production scales.
Market leaders include GMM Pfaudler Ltd., De Dietrich Process Systems, and Corning Incorporated, which maintain competitive advantages through global manufacturing infrastructure, extensive technical support networks, and deep expertise in glass reactor design across multiple chemical and pharmaceutical applications, creating trust and reliability advantages with process engineers, pharmaceutical developers, and research scientists. These companies leverage research and development capabilities in advanced thermal management systems and ongoing customer support relationships to defend market positions while expanding into continuous-flow technologies and digital process control integration.
Challengers encompass Büchi AG and Parr Instrument Company, which compete through specialized reactor designs and strong presence in laboratory and pilot-scale equipment markets. Product specialists, including Ace Glass Incorporated, Radley, and Syrris Ltd., focus on specific capacity ranges or application niches, offering differentiated capabilities in modular configurations, flow chemistry systems, and customized glass assemblies. Regional players including Shiva Scientific Glass Pvt. Ltd. and Sachin Industries Ltd. create competitive pressure through localized manufacturing advantages and responsive service capabilities, particularly in high-growth markets like India where proximity to pharmaceutical clusters provides advantages in delivery timelines and technical support relationships.
Glass reactor systems represent essential process development equipment that enables pharmaceutical and chemical engineers to achieve superior visual monitoring and contamination control compared to opaque metal reactors, delivering 30-40% faster process optimization and enhanced safety through real-time reaction observation in demanding synthesis applications. With the market projected to grow from USD 1.1 billion in 2025 to USD 1.9 billion by 2035 at a 5.9% CAGR, these critical process vessels offer compelling advantages - corrosion resistance, visual monitoring, and product purity assurance - making them essential for chemical process industries (45.0% market share), pharmaceutical API manufacturing, and research operations requiring equipment that conventional stainless steel reactors cannot provide for sensitive chemistry and demanding quality requirements.
How Governments Could Spur Local Production and Adoption?
How Industry Bodies Could Support Market Development?
How OEMs and Technology Players Could Strengthen the Ecosystem?
How Suppliers Could Navigate the Shift?
How Investors and Financial Enablers Could Unlock Value?
| Item | Value |
|---|---|
| Quantitative Units | USD 1.1 Billion |
| End Use | Chemical Process Industries (Basic Chemicals, Specialty & Fine Chemicals, Agrochemicals, Others), Pharmaceuticals, Academic & Research Institutions, Others |
| Design | Multi-jacketed (Triple-jacket, Dual-circulation/Recirculating Loops, Cryo-ready Sub-assemblies), Single-jacketed, Jacketed-less |
| Capacity | ≤5 L, 5-15 L, 15-30 L, 30-60 L, 60-100 L, 100-300 L, >300 L |
| Regions Covered | North America, Europe, Asia Pacific, Latin America, Middle East & Africa |
| Country Covered | Saudi Arabia, Brazil, India, Germany, China, South Korea, USA, and 40+ countries |
| Key Companies Profiled | GMM Pfaudler Ltd., De Dietrich Process Systems, Corning Incorporated, Büchi AG, Parr Instrument Company, Ace Glass Incorporated, Radley, Syrris Ltd., Shiva Scientific Glass Pvt. Ltd., Sachin Industries Ltd. |
| Additional Attributes | Dollar sales by end use, design, and capacity categories, regional adoption trends across Middle East & Africa, Latin America, and Asia Pacific, competitive landscape with equipment manufacturers and engineering service providers, technical specifications and performance requirements, integration with process control systems and data logging platforms, innovations in thermal management technology and continuous-flow systems, and development of specialized glass reactor configurations with enhanced GMP compliance and process intensification capabilities. |
The global glass reactor market is estimated to be valued at USD 1.1 billion in 2025.
The market size for the glass reactor market is projected to reach USD 2.0 billion by 2035.
The glass reactor market is expected to grow at a 5.9% CAGR between 2025 and 2035.
The key product types in glass reactor market are chemical process industries , pharmaceuticals, academic & research institutions and others.
In terms of design, multi-jacketed segment to command 33.2% share in the glass reactor market in 2025.


Full Research Suite comprises of:
Market outlook & trends analysis
Interviews & case studies
Strategic recommendations
Vendor profiles & capabilities analysis
5-year forecasts
8 regions and 60+ country-level data splits
Market segment data splits
12 months of continuous data updates
DELIVERED AS:
PDF EXCEL ONLINE
Glass Laser Engraving Machine Market Size and Share Forecast Outlook 2025 to 2035
Glass Restoration Kit Market Size and Share Forecast Outlook 2025 to 2035
Glass Bottle and Container Market Forecast and Outlook 2025 to 2035
Glass Additive Market Forecast and Outlook 2025 to 2035
Glass Cosmetic Bottle Market Size and Share Forecast Outlook 2025 to 2035
Glass & Metal Cleaner Market Size and Share Forecast Outlook 2025 to 2035
Glass Product Market Size and Share Forecast Outlook 2025 to 2035
Glassine Paper Market Size and Share Forecast Outlook 2025 to 2035
Glass Container Market Size and Share Forecast Outlook 2025 to 2035
Glass Fibre Yarn Market Size and Share Forecast Outlook 2025 to 2035
Glass Cloth Electrical Insulation Tape Market Size and Share Forecast Outlook 2025 to 2035
Glass Bonding Adhesive Market Size and Share Forecast Outlook 2025 to 2035
Glass Mat Thermoplastic Market Size and Share Forecast Outlook 2025 to 2035
Glass Table Bacteria Tank Market Size and Share Forecast Outlook 2025 to 2035
Glassine Paper Industry Analysis in Western Europe Size and Share Forecast Outlook 2025 to 2035
Glassine Paper Industry Analysis in Korea Size and Share Forecast Outlook 2025 to 2035
Glassine Paper Industry Analysis in Japan Size and Share Forecast Outlook 2025 to 2035
Glass Mat Market Size and Share Forecast Outlook 2025 to 2035
Glassware Market Size and Share Forecast Outlook 2025 to 2035
Glass Prepreg Market Size and Share Forecast Outlook 2025 to 2035

Thank you!
You will receive an email from our Business Development Manager. Please be sure to check your SPAM/JUNK folder too.
Chat With
MaRIA