Glass Bottle and Container Market Size and Share Forecast Outlook (2024 to 2034)
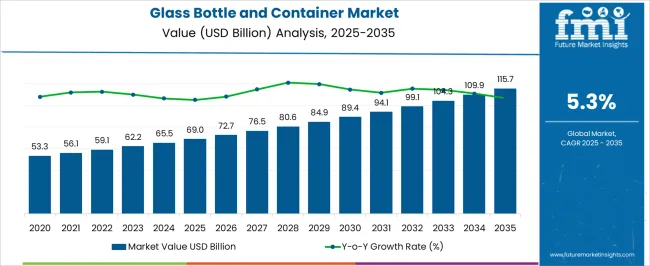
Global sales of glass bottles and containers are estimated to be USD 65,544.6 million in 2024 and are anticipated to reach USD 110,017.6 million by 2034. Sales revenue is projected to expand at a CAGR of 5.3% from 2024 to 2034. The revenue generated by the market was USD 62,234.5 million in 2023.
Growth Drivers Impacting Glass Bottle and Container Market
The market recorded a CAGR of 3.6% during the historical period and reached a valuation of USD 62,234.5 million in 2023.
- The market is experiencing a surge driven by the versatile use of glass packaging in diverse industries, notably chemicals, agriculture, and personal care.
- Glass containers are gaining prominence for packaging fertilizers, pesticides, etc., due to their inert nature that ensures the product's chemical composition preservation.
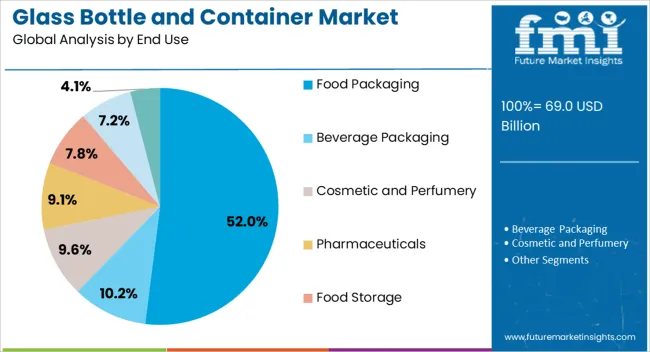
- Cosmetic and perfumery glass bottle and container packaging are expanding at a prominent rate, which has fueled the manufacture and distribution of glass containers intended particularly for packaging cosmetic and perfumery items.
- These specialty glass bottles serve a dual role by offering an aesthetically beautiful and protected enclosure for a wide range of cosmetic and fragrance products.
- The pervasive adoption of glass bottles and containers within the food and beverages industry creates a significant opportunity landscape for the glass packaging market.
- From premium spirits to artisanal olive oils and specialty sauces, the glass's transparency allows consumers to appreciate the product visually, reinforcing a sense of quality and trust.
- The industry increasingly emphasizes premium presentation and sustainable packaging, which has generated the widespread use of glass bottles and containers in the food and beverages sector, representing a lucrative opportunity for manufacturers to meet evolving consumer preferences and industry standards
Glass Bottle and Container Market Size (2023) |
USD 62,234.5 million |
Estimated Market Size (2024) |
USD 65,544.6 million |
Projected Market Size (2034) |
USD 110,017.6 million |
Value-based CAGR (2024 to 2034) |
5.3% |
Sales Trend Analysis and Consumption Patterns in the Glass Bottle and Container Market
- The growing global awareness of environmental sustainability drives the demand for eco-friendly packaging options and glass bottles and containers are highly preferred due to their recyclability.
- Consumers prefer aesthetically pleasing and premium packaging. Glass bottles are often associated with the higher quality and premium image, leading to increased demand.
- Rising concerns about chemicals leaching from plastic packaging have led to a growing adoption of glass containers, particularly in the food and beverage industry, where health-conscious consumers seek safer alternatives.
- Innovations in glass manufacturing processes have resulted in lighter and more durable glass bottles, addressing historical concerns about fragility and transportation costs and thereby boosting sales.
- The alcohol industry, including beer and spirits, favors glass bottles for their impermeability and ability to preserve the integrity of the contents, contributing significantly to the popularity of glass in this market segment.
- Increasing governmental regulations promoting sustainable practices and recycling, coupled with consumer awareness of the environmental impact of packaging materials, have fueled the adoption of glass containers.
- Urbanization trends and evolving consumer lifestyles have shifted preference towards convenience and on-the-go packaging. Glass bottles are gaining popularity for their perceived cleanliness and non-reactive nature.
Key Restraints Impacting the Growth of the Glass Bottle and Container Industry
The glass bottle and container market is anticipated to surpass a valuation of USD 110,017.6 million by 2034, growing at a 5.3% CAGR. While the market is experiencing growth, several restraining factors can adversely affect its development and expansion.
- Glass packaging is heavier than alternative materials, which increases transportation costs and affects its cost-effectiveness.
- Glass containers are more susceptible to breakage during handling, transportation, and consumer use, leading to higher risks of product loss and safety concerns.
- Glass production requires higher energy inputs compared to some alternative materials, contributing to increased manufacturing costs and environmental concerns related to energy consumption. While glass offers a premium image, it has limited design flexibility compared to materials like plastic, which may affect its appeal in certain industries seeking innovative and customizable packaging solutions.
- In some regions, the lack of efficient recycling infrastructure for glass may hinder its sustainable credentials, as recycling rates depend on the availability and accessibility of appropriate facilities.
- Glass packaging is often considered less convenient for on-the-go consumption due to its weight and fragility, impacting its appeal in markets where consumer convenience is a primary consideration.
- Increasing competition from alternative packaging materials, especially lightweight and flexible options like plastics, poses a challenge to the glass packaging industry, as these materials may offer cost advantages and convenience features that appeal to certain consumers.
Glass Bottle and Container Industry Analysis by Top Investment Segments
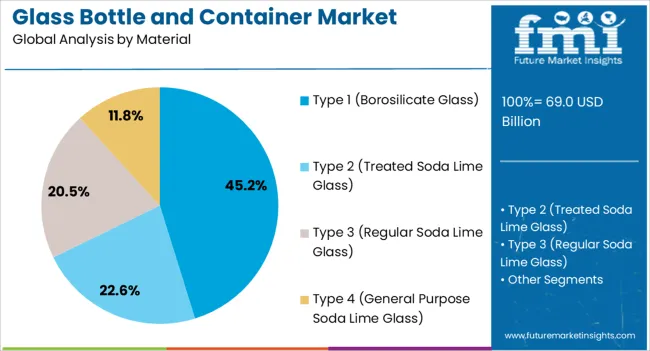
Prominent Application of Type 1 Glass in Various End-Use Industries
Top Material |
Market Share in 2024 |
Type 1 (Borosilicate Glass) |
45.2% |
The type I grade glass segment is anticipated to gain around 45.2% of the market share in 2024.
- The ingrained characteristics of Type I glass containers make them superior for different end-use industries.
- Type I glass offers different advantages, such as higher resistance to temperature and chemical corrosion, compared to other types of glass. It is used in pharma, lab glassware, cosmetics, perfumery, wine and spirit bottles, etc.
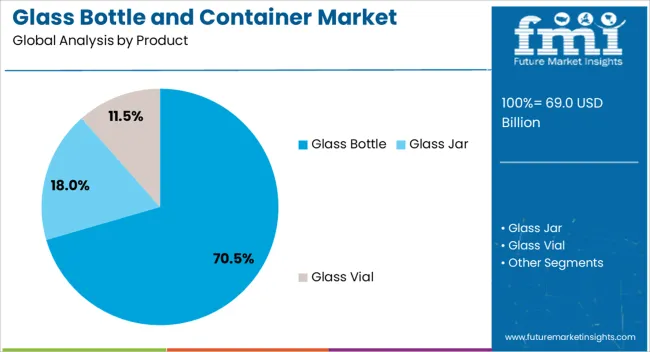
Higher Sales of Glass Bottles Over Other Product Types
Top Product |
Market Share in 2024 |
Glass Bottles |
70.5% |
Glass bottles dominate the glass bottle and container market, and it is envisioned to gain an incremental opportunity worth USD 14,277.7 million in the upcoming years.
- The pharmaceuticals and beverage industry prefers using glass bottles for packaging as they are eco-friendly and cost-effective.
- The glass bottle packaging is significantly safer as there are no risks of chemicals mixing into the product, with minimal risk to the consumer's health. In addition, the taste of the food or beverage remains intact in the glass bottle packaging.
- Due to the pandemic, people are drawn to a healthier lifestyle. Besides healthy living, they consciously make sustainable choices, especially about daily purchases.
- Glass vials and glass jars are also significantly growing, creating numerous opportunities for the market to expand.
Analysis of Top Countries Manufacturing, Certifying, and Operating Glass Bottle and Container Products
The section analyzes the glass bottle and container market by country. The table presents the CAGRs for each country, indicating the expected market growth in that country through 2034.
Country |
CAGR (2024 to 2034) |
United States |
3.9% |
Canada |
4.7% |
Brazil |
5.1% |
Mexico |
4.2% |
Germany |
4.5% |
France |
5.6% |
United Kingdom |
5.2% |
China |
6.4% |
India |
9.4% |
Japan |
7.2% |
GCC countries |
5.5% |
South Africa |
5.1% |
India's Economic Growth and Urbanization
India is the leading Asian country in the market, which is expected to expand at a CAGR of 9.4% during the forecast period.
- The rising demand for glass packaging can be attributed to the country's industrialization and urban development, which has led to a growing middle class with increased purchasing power.
- The Indian glass packaging industry has undergone significant growth and development, with many manufacturers investing in modern production technologies to meet the increasing demand.
- India's favorable government policies, such as the 'Make in India' campaign, have further boosted the growth of the glass packaging industry by encouraging domestic manufacturing.
Cosmetics Industry in Germany Fuel Sales of Glass Bottles & Containers
Growing consumption of cosmetics in Germany is anticipated to offer an incremental opportunity of USD 2,176.3 million, expanding at a CAGR of 4.5% during the forecast years.
- Germany is one of the leading markets for cosmetics products, with increasing scientific innovative facilities and research centers focused on product development and regulatory compliance concerning cosmetics and personal care products.
- Europe is one of the biggest markets for cosmetic products, with Germany accounting for USD 1,550 million in 2022 after France and Italy.
- Increasing investments and developing brands in the cosmetics industry contribute to Germany's cosmetics and personal care industry.
Blooming Demand for Healthcare Services in the United States Contributes to Market Growth
The United States is another country growing globally in the glass bottles and container market. The United States is expected to register a CAGR of 3.9% over the forecast period.
- The rising disposable income of people in the United States facilitates sales of glass packaging, which is used for premium products in various industries such as pharmaceuticals, food and beverages, cosmetics, and liquor packaging.
- The preference for glass is rising as glass is a neutral packaging material with no chemical interaction. This ensures product integrity.
Japan’s Advanced Technology and Innovation
Japan is another Asian country leading the glass bottle and container market. The market in Japan is anticipated to register a CAGR of 7.2% through 2034.
- The country's glass manufacturers focus on producing high-quality and technologically advanced glass products, contributing to their dominance in the global market.
- The Japanese government has set strict quality standards for glass packaging, making it one of the most reliable and durable in the market.
- Japanese glass manufacturers are preferred by companies who prioritize quality and reliability in their packaging.
China’s Extensive Production Capabilities Fueling Demand for Glass Bottles
China is another Asian country in the glass bottle and container market, which is anticipated to register a CAGR of 6.6% through 2034.
- With a vast population and a massive manufacturing base, China's demand for glass containers is substantial.
- China’s extensive production capabilities make it a leading global glass packaging market contributor.
- China's focus on boosting its economy has increased the demand for packaged goods, including those in glass containers. As a result, the Chinese glass packaging industry is growing rapidly, with many companies investing in modern manufacturing technologies to meet the increasing demand.
Competitive Landscape of the Glass Bottle and Container Market
Manufacturing companies operating in the glass bottle and container market develop innovative designs catering to specific products or applications. Major players in the market are expanding their presence and manufacturing capabilities and moving towards adopting and offering sustainable solutions to customers. Companies are expanding by integrating with different forms and collaborating to develop designs and products.
Recent Developments
- In November 2023, the company launched two new Boston Round bottles to its growing portfolio of American-made bottles.
- In October 2023, the Stoelzle Glass Group launched the Signature Collection, a Bespoke Line of Premium Spirits Bottles.
- In February 2023, Vidrala announced the acquisition of the Brazilian company Vidroporto, S.A., a Brazilian glass container manufacturer.
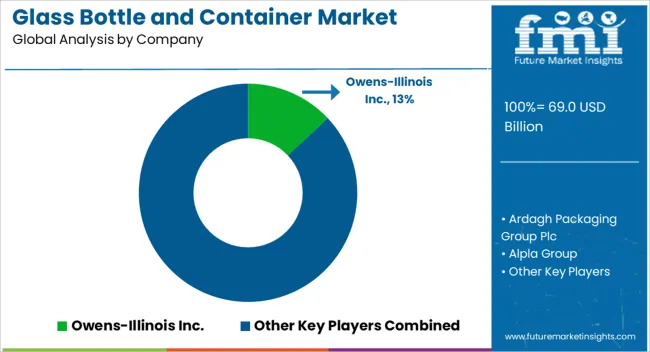
Leading Companies Profiled in the Glass Bottle and Container Market Report
- Ardagh Packaging Group Plc
- Owens-Illinois Inc.
- Alpla Group
- Verallia Packaging SAS
- Aptar Group
- Vetropack Holding Ltd
- Stolzle Glass Group
- AGI Glasspack Ltd
- Hindustan National Glass & Industries Ltd
- Vitro SAB de CV
- Consol Glass (Pty) Ltd
Table of Content
- 1. Executive Summary
- 2. Market Overview
- 3. Key Market Trends
- 4. Key Success Factors
- 5. Global Market Demand Analysis 2018 to 2023 and Forecast, 2024 to 2034
- 6. Global Market - Pricing Analysis
- 7. Global Market Demand (in Value or Size in USD Million) Analysis 2018 to 2023 and Forecast, 2024 to 2034
- 8. Market Background
- 9. Global Market Analysis 2018 to 2023 and Forecast, 2024 to 2034
- 10. Global Market Analysis 2018 to 2023 and Forecast 2024 to 2034, By Material
- 10.1. Type 1 (Borosilicate Glass)
- 10.2. Type 2 (Treated Soda Lime Glass)
- 10.3. Type 3 (Regular Soda Lime Glass)
- 10.4. Type 4 (General Purpose Soda Lime Glass)
- 11. Global Market Analysis 2018 to 2023 and Forecast 2024 to 2034, By Product
- 11.1. Glass Bottle
- 11.1.1. Sauce / Syrup Bottle
- 11.1.2. French Square Bottle
- 11.1.3. Boston Rounds Bottle
- 11.1.4. Glass Jug
- 11.1.5. Others (Rio rounds, woozy bottles, pill packer, etc.)
- 11.2. Glass Jar
- 11.2.1. Mason Jar
- 11.2.2. Hexagonal Glass Jar
- 11.2.3. Paragon Glass Jar
- 11.2.4. Straight Sided Jar
- 11.2.5. Others (Facet jar, tempered round jar, etc.)
- 11.3. Glass Vial
- 11.3.1. Food Grade Vial
- 11.3.2. Pharma Grade Vial
- 11.3.3. Other Glass Bottles & Containers (Syringe, Ampoules, etc.)
- 12. Global Market Analysis 2018 to 2023 and Forecast 2024 to 2034, By End Use
- 12.1. Cosmetic and Perfumery
- 12.1.1. Perfumes
- 12.1.2. Colour Cosmetics
- 12.2. Pharmaceuticals
- 12.3. Food Packaging
- 12.3.1. Generic Food Packaging
- 12.3.2. Specialty Food Packaging
- 12.4. Beverage Packaging
- 12.4.1. Alcoholic Beverage
- 12.4.2. Non-Alcoholic Beverage
- 12.5. Food Storage
- 12.6. Candles and Fragrance
- 12.7. Others (Home & Personal Care, Specialty And Craft Products)
- 13. Global Market Analysis 2018 to 2023 and Forecast 2024 to 2034, by Region
- 13.1. North America
- 13.2. Latin America
- 13.3. Asia Pacific
- 13.4. Europe
- 13.5. Middle East & Africa
- 14. North America Market Analysis 2018 to 2023 and Forecast 2024 to 2034
- 15. Latin America Market Analysis 2018 to 2023 and Forecast 2024 to 2034
- 16. Europe Market Analysis 2018 to 2023 and Forecast 2024 to 2034
- 17. Asia Pacific Market Analysis 2018 to 2023 and Forecast 2024 to 2034
- 18. Middle East & Africa Market Analysis 2018 to 2023 and Forecast 2024 to 2034
- 19. Country wise Market Analysis
- 20. Market Structure Analysis
- 21. Competition Analysis
- 21.1. Ardagh Group S.A.
- 21.2. Owens-Illinois, Inc
- 21.3. Encirc Ltd.
- 21.4. Anchor Glass Container Corporation
- 21.5. Gerresheimer AG
- 21.6. Saverglass SAS
- 21.7. Piramal Glass Private Limited
- 21.8. Hindustan National Glass & Industries Limited
- 21.9. Shandong Linuo Technical Glass Co., Ltd
- 21.10. Italesse S.R.L.
- 21.11. Vidrala S.A.
- 21.12. Vitro, S.A.B. de C.V.
- 21.13. AGI Glaspac
- 21.14. Toyo Seikan Group Holdings, Ltd.
- 21.15. Verallia
- 21.16. Stoelzle Glass Group
- 21.17. Schott AG
- 21.18. Nipro Corporation
- 21.19. Gallo Glass Company
- 21.20. Arglass Yamamura SE, LLC
- 21.21. MIRON Violetglass
- 22. Assumptions and Acronyms Used
- 23. Research Methodology
List of Tables
Table 01: Global Market Value (US$ Million) By Material, 2018H to 2034F
Table 02: Global Market Volume (Units) By Material, 2018H to 2034F
Table 03: Global Market Value (US$ Million) by Product, 2018H to 2034F
Table 04: Global Market Volume (Units) by Product, 2018H to 2034F
Table 05: Global Market Value (US$ Million) by End-Use, 2018H to 2034F
Table 06: Global Market Value (US$ Million) by End-Use, 2018H to 2034F
Table 07: Global Market Volume (Units) by End-Use, 2018H to 2034F
Table 08: Global Market Volume (Units) by End-Use, 2018H to 2034F
Table 09: Global Market Value (US$ Million) by Region, 2018H to 2034F
Table 10: Global Market Volume (Units) by Region, 2018H to 2034F
Table 11: North America Market Value (US$ Million) By Material, 2018H to 2034F
Table 12: North America Market Volume (Units) By Material, 2018H to 2034F
Table 13: North America Market Value (US$ Million) by Product, 2018H to 2034F
Table 14: North America Market Volume (Units) by Product, 2018H to 2034F
Table 15: North America Market Value (US$ Million) by End-Use, 2018H to 2034F
Table 16: North America Market Value (US$ Million) by End-Use, 2018H to 2034F
Table 17: North America Market Volume (Units) by End-Use, 2018H to 2034F
Table 18: North America Market Volume (Units) by End-Use, 2018H to 2034F
Table 19: North America Market Value (US$ Million) by Country, 2018H to 2034F
Table 20: North America Market Volume (Units) by Country, 2018H to 2034F
Table 21: Latin America Market Value (US$ Million) By Material, 2018H to 2034F
Table 22: Latin America Market Volume (Units) By Material, 2018H to 2034F
Table 23: Latin America Market Value (US$ Million) by Product, 2018H to 2034F
Table 24: Latin America Market Volume (Units) by Product, 2018H to 2034F
Table 25: Latin America Market Value (US$ Million) by End-Use, 2018H to 2034F
Table 26: Latin America Market Value (US$ Million) by End-Use, 2018H to 2034F
Table 27: Latin America Market Volume (Units) by End-Use, 2018H to 2034F
Table 28: Latin America Market Volume (Units) by End-Use, 2018H to 2034F
Table 29: Latin America Market Value (US$ Million) by Country, 2018H to 2034F
Table 30: Latin America Market Volume (Units) by Country, 2018H to 2034F
Table 31: Asia Pacific Market Value (US$ Million) By Material, 2018H to 2034F
Table 32: Asia Pacific Market Volume (Units) By Material, 2018H to 2034F
Table 33: Asia Pacific Market Value (US$ Million) by Product, 2018H to 2034F
Table 34: Asia Pacific Market Volume (Units) by Product, 2018H to 2034F
Table 35: Asia Pacific Market Value (US$ Million) by End-Use, 2018H to 2034F
Table 36: Asia Pacific Market Value (US$ Million) by End-Use, 2018H to 2034F
Table 37: Asia Pacific Market Volume (Units) by End-Use, 2018H to 2034F
Table 38: Asia Pacific Market Volume (Units) by End-Use, 2018H to 2034F
Table 39: Asia Pacific Market Value (US$ Million) by Country, 2018H to 2034F
Table 40: Asia Pacific Market Volume (Units) by Country, 2018H to 2034F
Table 41: Europe Market Value (US$ Million) By Material, 2018H-2034
Table 42: Europe Market Volume (Units) By Material, 2018H to 2034F
Table 43: Europe Market Value (US$ Million) by Product, 2018H to 2034F
Table 44: Europe Market Volume (Units) by Product, 2018H to 2034F
Table 45: Europe Market Value (US$ Million) by End-Use, 2018H to 2034F
Table 46: Europe Market Volume (Units) by End-Use, 2018H to 2034F
Table 47: Europe Market Value (US$ Million) by Country, 2018H to 2034F
Table 48: Europe Market Volume (Units) by Country, 2018H to 2034F
Table 49: MEA Market Value (US$ Million) By Material, 2018H to 2034F
Table 50: MEA Market Volume (Units) By Material, 2018H to 2034F
Table 51: MEA Market Value (US$ Million) by Product, 2018H to 2034F
Table 52: MEA Market Volume (Units) by Product, 2018H to 2034F
Table 53: MEA Market Value (US$ Million) by End-Use, 2018H to 2034F
Table 54: MEA Market Volume (Units) by End-Use, 2018H to 2034F
Table 55: MEA Market Value (US$ Million) by Country, 2018H to 2034F
Table 56: MEA Market Volume (Units) by Country, 2018H to 2034F
List of Figures
Figure 01: Global Market Share Analysis, by Material, 2024E & 2034F
Figure 02: Global Market Y-o-Y Analysis, by Material, 2018H to 2034F
Figure 03: Global Market Attractiveness Analysis, by Material, 2024E-2034F
Figure 04: Global Market Share Analysis, by Product, 2024E & 2034F
Figure 05: Global Market Y-o-Y Analysis, by Product, 2018H to 2034F
Figure 06: Global Market Attractiveness Analysis, by Product, 2024E-2034F
Figure 07: Global Market Share Analysis, by End-Use, 2024E & 2034F
Figure 08: Global Market Y-o-Y Analysis, by End-Use, 2018H to 2034F
Figure 09: Global Market Attractiveness Analysis, by End-Use, 2024E-2034F
Figure 10: Global Market Share Analysis, by Region, 2024E & 2034F
Figure 11: Global Market Y-o-Y Analysis, by Region, 2018H to 2034F
Figure 12: Global Market Attractiveness Analysis, by Region, 2024E-2034F
Figure 13: North America Market Attractiveness Analysis, By Material, 2024E-2034F
Figure 14: North America Market Y-o-Y Analysis, by Product, 2018H to 2034F
Figure 15: North America Market Value Share Analysis, by End Use 2018H to 2034F
Figure 16: North America Market Share Analysis, by Country, 2024E & 2034F
Figure 17: Latin America Market Y-o-Y Analysis, By Material, 2018H to 2034F
Figure 18: Latin America Market Y-o-Y Analysis, by Product, 2018H to 2034F
Figure 19: Latin America Market Value Share Analysis, by End Use 2018H to 2034F
Figure 20: Latin America Market Share Analysis, by Country, 2024E & 2034F
Figure 21: Asia Pacific Market Y-o-Y Analysis, By Material, 2018H to 2034F
Figure 22: Asia Pacific Market Y-o-Y Analysis, by Product, 2018H to 2034F
Figure 23: Asia Pacific Market Value Share Analysis, by End Use 2018H to 2034F
Figure 24: Asia Pacific Market Share Analysis, by Country, 2024E & 2034F
Figure 25: Europe Market Y-o-Y Analysis, By Material, 2018H to 2034F
Figure 26: Europe Market Y-o-Y Analysis, by Product, 2018H to 2034F
Figure 27: Europe Market Value Share Analysis, by End Use 2018H to 2034F
Figure 28: Europe Market Y-o-Y Analysis, by Country, 2018H to 2034F
Figure 29: Middle East & Africa (MEA) Market Y-o-Y Analysis, By Material, 2018H to 2034F
Figure 30: Middle East & Africa (MEA) Market Y-o-Y Analysis, by Product, 2018H to 2034F
Figure 31: Middle East & Africa (MEA) Market Y-o-Y Analysis, By End Use, 2018H to 2034F
Figure 32: Middle East & Africa (MEA) Market Y-o-Y Analysis, by Country, 2018H to 2034F