Methodology

Glass Liquor Bottle Market Outlook for 2025 to 2035

The Glass Liquor Bottle market is witnessing steady growth driven by the increasing demand for premium alcoholic beverages and the rising focus on sustainable packaging solutions. The future outlook for this market is shaped by innovations in manufacturing processes that enhance product quality, durability, and aesthetic appeal. Consumers are increasingly preferring glass bottles due to their recyclability, inert properties, and ability to preserve flavor and aroma, which supports the expansion of the market.

Additionally, growing consumer awareness about environmental sustainability has encouraged the adoption of glass over alternative packaging materials. The market is further supported by rising investments in the alcoholic beverage industry, with producers seeking to differentiate their products through distinctive packaging and branding strategies.

The demand for various bottle sizes to cater to different consumption patterns also fuels market growth As premiumization trends continue and regulatory frameworks favor sustainable packaging, the Glass Liquor Bottle market is expected to maintain steady growth, particularly in regions with a high consumption of spirits and a focus on environmental responsibility.
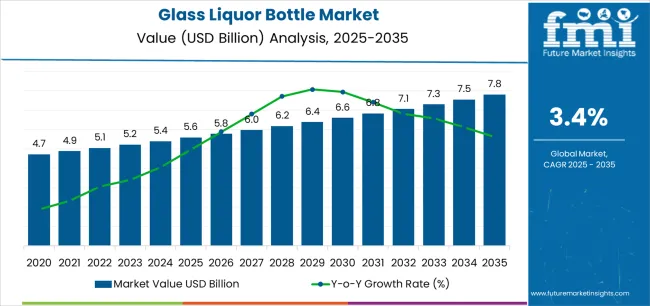
Quick Stats for Glass Liquor Bottle Market

  • Glass Liquor Bottle Market Industry Value (2025): USD 5.6 billion
  • Glass Liquor Bottle Market Forecast Value (2035): USD 7.8 billion
  • Glass Liquor Bottle Market Forecast CAGR: 3.4%
  • Leading Segment in Glass Liquor Bottle Market in 2025: Type I (45.6%)
  • Key Growth Region in Glass Liquor Bottle Market: North America, Asia-Pacific, Europe
  • Top Key Players in Glass Liquor Bottle Market: Owens-Illinois (O-I), Ardagh Group, Verallia, Vidrala, AGI Glaspac, Nihon Yamamura Glass, Consol Glass, Piramal Glass, Wiegand-Glas, Saint-Gobain, Vetropack, Amcor Plc, Vitro Packaging, Anchor Glass Container, Allied Glass, BA Glass, Stölzle Glass Group, HNG Float Glass Limited, Gerresheimer
Glass Liquor Bottle Market Market Value Analysis
Metric Value
Glass Liquor Bottle Market Estimated Value in (2025 E) USD 5.6 billion
Glass Liquor Bottle Market Forecast Value in (2035 F) USD 7.8 billion
Forecast CAGR (2025 to 2035) 3.4%

Segmental Analysis

The market is segmented by Grade, Manufacturing Process, Capacity, and End Use and region. By Grade, the market is divided into Type I, Type II, and Type III. In terms of Manufacturing Process, the market is classified into Blown and Tubing. Based on Capacity, the market is segmented into 201 To 500 Ml, Up To 50 Ml, 51 To 200 Ml, 501 To 1000 Ml, and 1001 Ml & Above. By End Use, the market is divided into Beer, Wine, Spirits, and Others. Regionally, the market is classified into North America, Latin America, Western Europe, Eastern Europe, Balkan & Baltic Countries, Russia & Belarus, Central Asia, East Asia, South Asia & Pacific, and the Middle East & Africa.
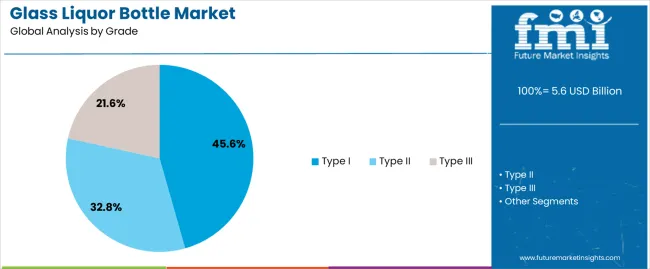
Insights into the Type I Grade Segment

Glass Liquor Bottle Market Analysis By Grade

The Type I grade segment is projected to hold 45.60% of the Glass Liquor Bottle market revenue share in 2025, establishing it as the leading grade. This segment has been driven by the superior chemical resistance and durability of Type I glass, making it ideal for high-quality liquor storage. The segment has benefited from the ability to preserve the taste, aroma, and color of beverages over extended periods, which is critical for premium spirits.

Additionally, regulatory standards and industry guidelines favor Type I glass for alcoholic products, reinforcing its widespread adoption. The growth of the segment is further supported by increasing consumer demand for premium and collectible bottles, as well as the trend toward sustainable and reusable packaging solutions.

Manufacturers are increasingly investing in Type I glass production to meet these market demands, enhancing its availability and cost-effectiveness The combination of functional benefits, compliance advantages, and premium appeal ensures that the Type I grade segment remains dominant in the market.
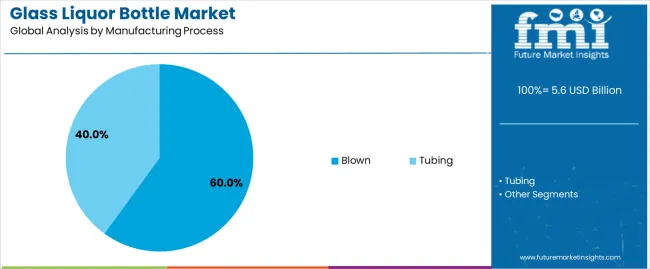
Insights into the Blown Manufacturing Process Segment

Glass Liquor Bottle Market Analysis By Manufacturing Process

The blown manufacturing process segment is expected to capture 60.00% of the Glass Liquor Bottle market revenue share in 2025, making it the leading manufacturing process. The growth of this segment is driven by the flexibility and precision offered by the blown glass technique, which allows for customized shapes, designs, and sizes. The process ensures uniform wall thickness and high structural integrity, critical for maintaining the quality and safety of alcoholic beverages.

Moreover, the adaptability of blown glass production supports aesthetic innovations that enhance brand identity and consumer appeal. Increasing demand for visually distinctive packaging in the premium liquor market has accelerated the adoption of blown glass bottles.

The process also facilitates scalable production, meeting the needs of both large-scale commercial producers and smaller artisanal brands The continued emphasis on design differentiation, quality preservation, and regulatory compliance underpins the dominance of the blown manufacturing process in the Glass Liquor Bottle market.
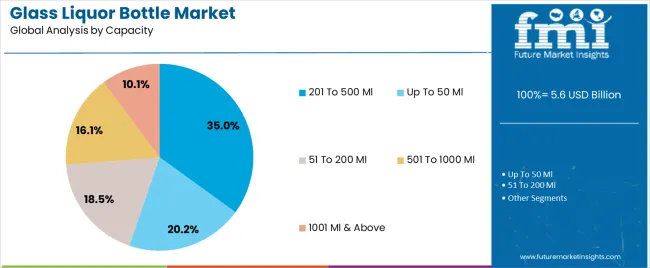
Insights into the 201 To 500 Ml Capacity Segment

Glass Liquor Bottle Market Analysis By Capacity

The 201 to 500 Ml capacity segment is anticipated to account for 35.00% of the Glass Liquor Bottle market revenue in 2025, positioning it as the leading capacity range. The growth of this segment is influenced by consumer preference for convenient and moderate serving sizes, which are suitable for personal consumption, gifting, and sampling purposes.

This capacity range allows manufacturers to target a broad audience by offering products that balance affordability with premium quality. Additionally, these bottles are easier to handle, store, and transport, which supports supply chain efficiency and retail distribution.

The segment has also benefited from marketing trends that emphasize portion control, portability, and premium packaging for smaller bottle sizes The combination of consumer convenience, operational efficiency, and premium presentation ensures that the 201 to 500 Ml capacity segment maintains a strong share of the Glass Liquor Bottle market.

Semi-Annual Market Update

The below table presents the expected CAGR for the global glass liquor bottle market over several semi-annual periods spanning from 2025 to 2035. First half (H1) from 2025 to 2035, the sector is seen to have growth of CAGR 3.2%, followed by surging numbers of 3.6% in the second half (H2) of the same decade.

Particular Value CAGR
H1 3.2% (2025 to 2035)
H2 3.6% (2025 to 2035)
H1 3.3% (2025 to 2035)
H2 3.8% (2025 to 2035)

In the next decade though, the first half maintains a steady CAGR of 3.3%. The second half of 2025 to 2035, however, sees a CAGR of 3.8%.

Key Industry Highlights

Sustainability and Environmental Accountability to Shape the Future of this Industry

This industry's future is being shaped by the growing emphasis on environmental accountability and sustainability. Customers want packaging that fits their values as they grow more environmentally concerned. In an effort to minimize raw material consumption and carbon emissions, brands are allocating funds in creation of environmentally friendly glass bottles, with a focus on lightweight models. There is a growing tendency towards using recycled glass, known as cullet, in the production circle, which further enriches the sustainability profile of glass bottles.

Innovations in Bottle Design and Collaborations with Artists to Augment Growth

Brands are scouring distinctive and innovative bottle designs to distinguish their products on shop racks and build a strong graphic identity. This includes the use of custom forms, detailed embossing, and creative labels that enhance the prevailing aesthetic charm of the product.

Advances in digital printing technology are also leading to better and more dynamic designs, making bottles not just containers but critical aspects of the brand experience. Limited-edition bottles and affiliations with artists are also becoming widespread, adding a collectible element to the packaging.

Manufacturing Process and Sourcing of Raw Materials to Raise Concerns

While glass is recyclable and regarded as more sustainable than plastic, the manufacturing procedure itself has a consequential carbon footprint. The technique of thawing raw materials and creating glass bottles mandates elevated temperatures, which lead to considerable emissions of greenhouse gases.

The extraction and conveyance of raw materials including silica sand, soda ash, and limestone contribute to environmental deterioration. These facets have ushered increasing scrutiny from environmental bodies and increased regulatory forces, which can inhibit market growth.

2020 to 2024 Global Glass Liquor Bottle Sales Outlook Compared to Demand Forecasts for 2025 to 2035

The glass liquor bottle industry size was tipped to be USD 4.7 billion in 2020. Throughout the recorded course, the industry developed at a CAGR of 2.5%, attaining a size of USD 5.6 billion in 2025.

Several governments imposed bans on public gatherings during the initial pandemic-phase. This LED to the closures of pubs, hotels, restaurants, etc. The demand for these bottles plunged as the on premise consumption segment tightened sharply.

As the pandemic advanced and governments started to acclimate to the latest reality, the glass liquor bottle industry underwent a stretch of comeback. With the easing of lockdown efforts and the incremental reopening of hospitality sectors, the demand for alcoholic beverages commenced to pick up. There was also a striking transition towards off-premise consumption, with more consumers buying liquor for residential consumption.

The rise of e-commerce and direct-to-consumer sales channels furnished unexplored prospects for brands to attain consumers, further bolstering demand for glass bottles. Manufacturers adapted by improving their supply chain stability and executing strict health and safety standards to guarantee continued production.

As of now, companies are concentrating on innovation, sustainability, and digital modification to steer these challenges and capitalize on emerging possibilities.

Market Concentration

Tier one firms like Owens-Illinois (O-I), Ardagh Group, and Verallia are leveraging their comprehensive resources and market presence to propel invention and sustainability in the glass liquor bottle market. These companies are investing in Avant technologies to diminish energy consumption and CO2 emissions.

Some of them are also concentrating on feather-weight glass bottles, which lessen raw material use and lower transport expenses.

Tier two organizations like Vidrala, AGI Glaspac, and Nihon Yamamura Glass are making their mark by specializing in niche markets and proposing tailored solutions to their customers. These companies are also known for their emphatic emphasis on customer assistance and flexibility, delivering customized bottle designs that cater to the explicit requirements of craft distilleries and premium brands.

They are augmenting their presence in emerging markets, such as India, by funding new manufacturing establishments and embracing cutting-edge technologies to enhance production efficiency.

Tier three parties like Consol Glass, Piramal Glass, and Wiegand-Glas are focusing on skill and provincial powers to cut out their position in the market. Consol Glass is a leading supplier in Africa, leveraging its provincial expertise to cater to local needs and foster sustainable approaches within the continent. These companies are enhancing their competitive advantage through acquisitions and mergers.

Category-wise Insights

The following section offers insights into leading segment. Type II is the preferred grade. Beer manufacturers, on the other hand, continue to reign at the top when it comes to the end users.

Type II Grade Bottles are devoured by Manufacturers

Glass liquor bottles are often classified on the basis of grade. Grade I, II, and III are some of the popular ones. Among these, the grade II holds a majority share of 45.6%.

Segment Grade II (Grade)
Value Share (2025) 45.6%

Quality and cost-effectiveness are the two main reasons why businesses are picking grade II glass in the manufacturing of liquor bottles. Bottles made from this glass is also clearer. Consumers like to see the inner contents, and this glass types makes it happen. The demand is also due to their durability.

This grade of glass is also UV-proof, meaning that it does not react easily. This preserves the flavor and quality of the liquor. Artisanal and craft beer manufacturers are some of the largest consumers of these bottles. These bottles are often perceived as an affordable yet premium packaging solution.

Beer Manufacturers are the Largest Consumers of Glass Bottles

Glass liquor bottles are used in a wide spectrum of industries such as beer, wine, spirits, ciders, etc. These bottles are increasingly being used in beer manufacturing, which hold a market share of 39.2%, as of 2025.

Segment Beer (End User)
Value Share (2025) 39.2%

Beer manufacturers are one of the largest consumers of these bottles. These distilleries prefer packaging solutions that preserve beer quality as well as flavor. Their demand is also due to the excellent barrier properties. These bottles are well known for their protection from external oxygen and light, something that plastic and metal bottles find difficulty in.

The expansion of craft beer industry in countries like India, China, and the United States is also one of the main reason for this. These bottles also give a premium feel to the consumers. Amid the sustainability tendencies in the packaging industry, glass bottles are going to gain prominence in the coming future.

Country-Wise Insights

Consumers are acquainted with relishing their favourite alcoholic booze in glass bottles. In the American province, the United States is one of the most lucrative markets for this industry. Asian nations like India, and China, are also leading the charts when it comes to the glass liquor bottle industry. Among the European countries, it can be figured that the United Kingdom made it one of the most thriving markets in the world.

Countries CAGR (2025 to 2035)
United States 2.9%
United Kingdom 2.4%
France 2.6%
India 4.9%
China 4.4%

Higher Consumption of Premium Alcoholic Drinks Helps the Industry in India Grow

The industry in India is projected to progress at a CAGR of 4.9% throughout the forecast period.

The rise of the middle class are compelling higher consumption of superior alcoholic drinks in the country. These drinks are usually packaged in glass bottles to improve their perceived worth. This has generated an outstanding demand for these bottles in the urban parts of India.

The glass liquor bottle market in India is also developing due to the country’s emphasis on sustainability. This also encourages the usage of glass over plastic, as glass is totally recyclable. Consumers in India are also preferring glass as it has a lower environmental influence.

The expanding grid of contemporary retail outlets and e-commerce outlets is making premium and imported spirits more affordable to customers, further stimulating the need for glass liquor bottles.

Industry in China to Exhibit Decent Growth Rate in the Coming Future

The sector is set to register a CAGR of 4.4% over the forecast period in China, making it a highly lucrative country.

The demand for orthodox spirits like ‘baijiu’, which is commonly packaged in decorated glass bottles contributes to market expansion in China. Severe environmental decrees and government guidelines striving to diminish plastic debris are also prompting the adoption of glass packaging. Innovations in glass bottle design and manufacturing, coupled with assertive marketing tactics by leading brands, are further propelling the market in China.

In China, the growth of the glass liquor bottle market is also fueled by the burgeoning need for premium and extravagant alcoholic drinks, driven by a growing wealthy population and a cultural transition towards higher-quality products.

Expansion of Luxury Retail Sector Helps the Industry Grow in the United States

The United States industry is poised to progress at a CAGR of 2.9% over the forecast period.

Consumers in the United States are fond of high-quality, artisanal products. Glass bottles are, thus, preferred for their aesthetic charm. They are also in demand due to their capability to hold the taste of the contents. The growing focus on sustainability and eco-friendly packaging solutions is another consequential factor, as glass is perceived as a better sustainable alternative compared to plastic.

The glass liquor bottle market in the United States is also encountering augmentation due to the rising tendency of craft spirits and premiumization. Improvements in glass manufacturing technologies are making glass bottles more cost-effective. This has made them attractive to both manufacturers and customers in the United States.
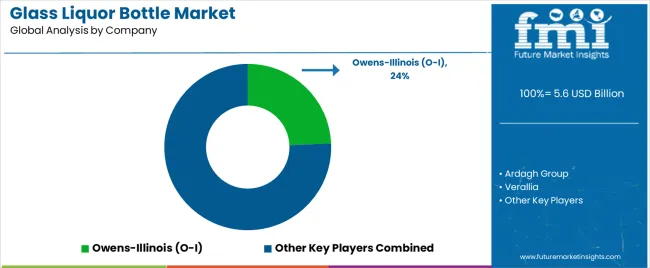
Competition Outlook

Glass Liquor Bottle Market Analysis By Company

In the glass liquor bottle industry, the competition is very cut-throat. International companies have tie-ups with leading alcoholic beverage producers. Tier two companies, on the other hand, serve to craft liquor manufacturers. Industry-giants like Owens-Illinois (O-I), Ardagh Group, Verallia, Vidrala, AGI Glaspac, etc., have a strong consumer base. Their worldwide reach and focus on sustainable solutions have helped them attract a substantial clientele. These brands also collaborate with artists to curate limited-edition bottles and containers to lure consumers.

Some companies are also into the business of recycling used glass liquor bottles. This trend of upcycling has influenced this industry in a positive manner.

Key Industrial Developments

  • In March 2025, Ardagh Glass Packaging-North America partnered with Stevens Point Brewery to supply locally-produced glass beer bottles. This collaboration, part of the brewery's sustainability efforts, aimed to enhance regional economic support, reduce transportation distances, and lower carbon emissions.
  • In November 2025, Ardagh Glass Packaging-North America launched new 16oz Boston Round glass beverage bottles on its BuyOurBottles website. Available in amber and flint glass, these American-made, recyclable bottles cater to craft brewers and beverage producers, offering sustainable packaging options for their products.

Prominent Companies

  • Owens-Illinois (O-I)
  • Ardagh Group
  • Verallia
  • Vidrala
  • AGI Glaspac
  • Nihon Yamamura Glass
  • Consol Glass
  • Piramal Glass
  • Wiegand-Glas
  • Saint-Gobain
  • Vetropack
  • Amcor
  • Vitro Packaging
  • Anchor Glass Container
  • Allied Glass
  • Berlin Packaging
  • BA Glass
  • Stölzle Glass Group
  • HNG Float Glass Limited
  • Gerresheimer

Key Segments of Market Report

By Grade:

By grade, the market is divided into Type I, Type II, and Type III glass bottles.

By Manufacturing Process:

In terms of manufacturing process, the market includes blown and tubing methods.

By Capacity:

When segmented by capacity, the categories are up to 50 ml, 51 to 200 ml, 201 to 500 ml, 501 to 1000 ml, and 1001 ml & above.

By End Use:

By end use, the market is categorized into beer, wine, spirits, and others (including ciders and flavored alcoholic beverages).

By Region:

The sector has been analyzed with the following regions covered: North America, Latin America, Europe, South Asia & Pacific, East Asia, and the Middle East and Africa.

Frequently Asked Questions

How big is the glass liquor bottle market in 2025?

The global glass liquor bottle market is estimated to be valued at USD 5.6 billion in 2025.

What will be the size of glass liquor bottle market in 2035?

The market size for the glass liquor bottle market is projected to reach USD 7.8 billion by 2035.

How much will be the glass liquor bottle market growth between 2025 and 2035?

The glass liquor bottle market is expected to grow at a 3.4% CAGR between 2025 and 2035.

What are the key product types in the glass liquor bottle market?

The key product types in glass liquor bottle market are type i, type ii and type iii.

Which manufacturing process segment to contribute significant share in the glass liquor bottle market in 2025?

In terms of manufacturing process, blown segment to command 60.0% share in the glass liquor bottle market in 2025.

Table of Content

  1. Executive Summary
    • Global Market Outlook
    • Demand to side Trends
    • Supply to side Trends
    • Technology Roadmap Analysis
    • Analysis and Recommendations
  2. Market Overview
    • Market Coverage / Taxonomy
    • Market Definition / Scope / Limitations
  3. Market Background
    • Market Dynamics
      • Drivers
      • Restraints
      • Opportunity
      • Trends
    • Scenario Forecast
      • Demand in Optimistic Scenario
      • Demand in Likely Scenario
      • Demand in Conservative Scenario
    • Opportunity Map Analysis
    • Product Life Cycle Analysis
    • Supply Chain Analysis
    • Investment Feasibility Matrix
    • Value Chain Analysis
    • PESTLE and Porter’s Analysis
    • Regulatory Landscape
    • Regional Parent Market Outlook
    • Production and Consumption Statistics
    • Import and Export Statistics
  4. Global Market Analysis 2020 to 2025 and Forecast, 2025 to 2035
    • Historical Market Size Value (USD Million) Analysis, 2020 to 2025
    • Current and Future Market Size Value (USD Million) Projections, 2025 to 2035
      • Y to o to Y Growth Trend Analysis
      • Absolute $ Opportunity Analysis
  5. Global Market Pricing Analysis 2020 to 2025 and Forecast 2025 to 2035
  6. Global Market Analysis 2020 to 2025 and Forecast 2025 to 2035, By Grade
    • Introduction / Key Findings
    • Historical Market Size Value (USD Million) Analysis By Grade , 2020 to 2025
    • Current and Future Market Size Value (USD Million) Analysis and Forecast By Grade , 2025 to 2035
      • Type I
      • Type II
      • Type III
    • Y to o to Y Growth Trend Analysis By Grade , 2020 to 2025
    • Absolute $ Opportunity Analysis By Grade , 2025 to 2035
  7. Global Market Analysis 2020 to 2025 and Forecast 2025 to 2035, By Manufacturing Process
    • Introduction / Key Findings
    • Historical Market Size Value (USD Million) Analysis By Manufacturing Process, 2020 to 2025
    • Current and Future Market Size Value (USD Million) Analysis and Forecast By Manufacturing Process, 2025 to 2035
      • Blown
      • Tubing
    • Y to o to Y Growth Trend Analysis By Manufacturing Process, 2020 to 2025
    • Absolute $ Opportunity Analysis By Manufacturing Process, 2025 to 2035
  8. Global Market Analysis 2020 to 2025 and Forecast 2025 to 2035, By Capacity
    • Introduction / Key Findings
    • Historical Market Size Value (USD Million) Analysis By Capacity, 2020 to 2025
    • Current and Future Market Size Value (USD Million) Analysis and Forecast By Capacity, 2025 to 2035
      • 201 To 500 Ml
      • Up To 50 Ml
      • 51 To 200 Ml
      • 501 To 1000 Ml
      • 1001 Ml & Above
    • Y to o to Y Growth Trend Analysis By Capacity, 2020 to 2025
    • Absolute $ Opportunity Analysis By Capacity, 2025 to 2035
  9. Global Market Analysis 2020 to 2025 and Forecast 2025 to 2035, By End Use
    • Introduction / Key Findings
    • Historical Market Size Value (USD Million) Analysis By End Use, 2020 to 2025
    • Current and Future Market Size Value (USD Million) Analysis and Forecast By End Use, 2025 to 2035
      • Beer
      • Wine
      • Spirits
      • Others
    • Y to o to Y Growth Trend Analysis By End Use, 2020 to 2025
    • Absolute $ Opportunity Analysis By End Use, 2025 to 2035
  10. Global Market Analysis 2020 to 2025 and Forecast 2025 to 2035, By Region
    • Introduction
    • Historical Market Size Value (USD Million) Analysis By Region, 2020 to 2025
    • Current Market Size Value (USD Million) Analysis and Forecast By Region, 2025 to 2035
      • North America
      • Latin America
      • Western Europe
      • Eastern Europe
      • East Asia
      • South Asia and Pacific
      • Middle East & Africa
    • Market Attractiveness Analysis By Region
  11. North America Market Analysis 2020 to 2025 and Forecast 2025 to 2035, By Country
    • Historical Market Size Value (USD Million) Trend Analysis By Market Taxonomy, 2020 to 2025
    • Market Size Value (USD Million) Forecast By Market Taxonomy, 2025 to 2035
      • By Country
        • USA
        • Canada
        • Mexico
      • By Grade
      • By Manufacturing Process
      • By Capacity
      • By End Use
    • Market Attractiveness Analysis
      • By Country
      • By Grade
      • By Manufacturing Process
      • By Capacity
      • By End Use
    • Key Takeaways
  12. Latin America Market Analysis 2020 to 2025 and Forecast 2025 to 2035, By Country
    • Historical Market Size Value (USD Million) Trend Analysis By Market Taxonomy, 2020 to 2025
    • Market Size Value (USD Million) Forecast By Market Taxonomy, 2025 to 2035
      • By Country
        • Brazil
        • Chile
        • Rest of Latin America
      • By Grade
      • By Manufacturing Process
      • By Capacity
      • By End Use
    • Market Attractiveness Analysis
      • By Country
      • By Grade
      • By Manufacturing Process
      • By Capacity
      • By End Use
    • Key Takeaways
  13. Western Europe Market Analysis 2020 to 2025 and Forecast 2025 to 2035, By Country
    • Historical Market Size Value (USD Million) Trend Analysis By Market Taxonomy, 2020 to 2025
    • Market Size Value (USD Million) Forecast By Market Taxonomy, 2025 to 2035
      • By Country
        • Germany
        • UK
        • Italy
        • Spain
        • France
        • Nordic
        • BENELUX
        • Rest of Western Europe
      • By Grade
      • By Manufacturing Process
      • By Capacity
      • By End Use
    • Market Attractiveness Analysis
      • By Country
      • By Grade
      • By Manufacturing Process
      • By Capacity
      • By End Use
    • Key Takeaways
  14. Eastern Europe Market Analysis 2020 to 2025 and Forecast 2025 to 2035, By Country
    • Historical Market Size Value (USD Million) Trend Analysis By Market Taxonomy, 2020 to 2025
    • Market Size Value (USD Million) Forecast By Market Taxonomy, 2025 to 2035
      • By Country
        • Russia
        • Poland
        • Hungary
        • Balkan & Baltic
        • Rest of Eastern Europe
      • By Grade
      • By Manufacturing Process
      • By Capacity
      • By End Use
    • Market Attractiveness Analysis
      • By Country
      • By Grade
      • By Manufacturing Process
      • By Capacity
      • By End Use
    • Key Takeaways
  15. East Asia Market Analysis 2020 to 2025 and Forecast 2025 to 2035, By Country
    • Historical Market Size Value (USD Million) Trend Analysis By Market Taxonomy, 2020 to 2025
    • Market Size Value (USD Million) Forecast By Market Taxonomy, 2025 to 2035
      • By Country
        • China
        • Japan
        • South Korea
      • By Grade
      • By Manufacturing Process
      • By Capacity
      • By End Use
    • Market Attractiveness Analysis
      • By Country
      • By Grade
      • By Manufacturing Process
      • By Capacity
      • By End Use
    • Key Takeaways
  16. South Asia and Pacific Market Analysis 2020 to 2025 and Forecast 2025 to 2035, By Country
    • Historical Market Size Value (USD Million) Trend Analysis By Market Taxonomy, 2020 to 2025
    • Market Size Value (USD Million) Forecast By Market Taxonomy, 2025 to 2035
      • By Country
        • India
        • ASEAN
        • Australia & New Zealand
        • Rest of South Asia and Pacific
      • By Grade
      • By Manufacturing Process
      • By Capacity
      • By End Use
    • Market Attractiveness Analysis
      • By Country
      • By Grade
      • By Manufacturing Process
      • By Capacity
      • By End Use
    • Key Takeaways
  17. Middle East & Africa Market Analysis 2020 to 2025 and Forecast 2025 to 2035, By Country
    • Historical Market Size Value (USD Million) Trend Analysis By Market Taxonomy, 2020 to 2025
    • Market Size Value (USD Million) Forecast By Market Taxonomy, 2025 to 2035
      • By Country
        • Kingdom of Saudi Arabia
        • Other GCC Countries
        • Turkiye
        • South Africa
        • Other African Union
        • Rest of Middle East & Africa
      • By Grade
      • By Manufacturing Process
      • By Capacity
      • By End Use
    • Market Attractiveness Analysis
      • By Country
      • By Grade
      • By Manufacturing Process
      • By Capacity
      • By End Use
    • Key Takeaways
  18. Key Countries Market Analysis
    • USA
      • Pricing Analysis
      • Market Share Analysis, 2025
        • By Grade
        • By Manufacturing Process
        • By Capacity
        • By End Use
    • Canada
      • Pricing Analysis
      • Market Share Analysis, 2025
        • By Grade
        • By Manufacturing Process
        • By Capacity
        • By End Use
    • Mexico
      • Pricing Analysis
      • Market Share Analysis, 2025
        • By Grade
        • By Manufacturing Process
        • By Capacity
        • By End Use
    • Brazil
      • Pricing Analysis
      • Market Share Analysis, 2025
        • By Grade
        • By Manufacturing Process
        • By Capacity
        • By End Use
    • Chile
      • Pricing Analysis
      • Market Share Analysis, 2025
        • By Grade
        • By Manufacturing Process
        • By Capacity
        • By End Use
    • Germany
      • Pricing Analysis
      • Market Share Analysis, 2025
        • By Grade
        • By Manufacturing Process
        • By Capacity
        • By End Use
    • UK
      • Pricing Analysis
      • Market Share Analysis, 2025
        • By Grade
        • By Manufacturing Process
        • By Capacity
        • By End Use
    • Italy
      • Pricing Analysis
      • Market Share Analysis, 2025
        • By Grade
        • By Manufacturing Process
        • By Capacity
        • By End Use
    • Spain
      • Pricing Analysis
      • Market Share Analysis, 2025
        • By Grade
        • By Manufacturing Process
        • By Capacity
        • By End Use
    • France
      • Pricing Analysis
      • Market Share Analysis, 2025
        • By Grade
        • By Manufacturing Process
        • By Capacity
        • By End Use
    • India
      • Pricing Analysis
      • Market Share Analysis, 2025
        • By Grade
        • By Manufacturing Process
        • By Capacity
        • By End Use
    • ASEAN
      • Pricing Analysis
      • Market Share Analysis, 2025
        • By Grade
        • By Manufacturing Process
        • By Capacity
        • By End Use
    • Australia & New Zealand
      • Pricing Analysis
      • Market Share Analysis, 2025
        • By Grade
        • By Manufacturing Process
        • By Capacity
        • By End Use
    • China
      • Pricing Analysis
      • Market Share Analysis, 2025
        • By Grade
        • By Manufacturing Process
        • By Capacity
        • By End Use
    • Japan
      • Pricing Analysis
      • Market Share Analysis, 2025
        • By Grade
        • By Manufacturing Process
        • By Capacity
        • By End Use
    • South Korea
      • Pricing Analysis
      • Market Share Analysis, 2025
        • By Grade
        • By Manufacturing Process
        • By Capacity
        • By End Use
    • Russia
      • Pricing Analysis
      • Market Share Analysis, 2025
        • By Grade
        • By Manufacturing Process
        • By Capacity
        • By End Use
    • Poland
      • Pricing Analysis
      • Market Share Analysis, 2025
        • By Grade
        • By Manufacturing Process
        • By Capacity
        • By End Use
    • Hungary
      • Pricing Analysis
      • Market Share Analysis, 2025
        • By Grade
        • By Manufacturing Process
        • By Capacity
        • By End Use
    • Kingdom of Saudi Arabia
      • Pricing Analysis
      • Market Share Analysis, 2025
        • By Grade
        • By Manufacturing Process
        • By Capacity
        • By End Use
    • Turkiye
      • Pricing Analysis
      • Market Share Analysis, 2025
        • By Grade
        • By Manufacturing Process
        • By Capacity
        • By End Use
    • South Africa
      • Pricing Analysis
      • Market Share Analysis, 2025
        • By Grade
        • By Manufacturing Process
        • By Capacity
        • By End Use
  19. Market Structure Analysis
    • Competition Dashboard
    • Competition Benchmarking
    • Market Share Analysis of Top Players
      • By Regional
      • By Grade
      • By Manufacturing Process
      • By Capacity
      • By End Use
  20. Competition Analysis
    • Competition Deep Dive
      • Owens-Illinois (O-I)
        • Overview
        • Product Portfolio
        • Profitability by Market Segments (Product/Age /Sales Channel/Region)
        • Sales Footprint
        • Strategy Overview
          • Marketing Strategy
          • Product Strategy
          • Channel Strategy
      • Ardagh Group
      • Verallia
      • Vidrala
      • AGI Glaspac
      • Nihon Yamamura Glass
      • Consol Glass
      • Piramal Glass
      • Wiegand-Glas
      • Saint-Gobain
      • Vetropack
      • Amcor Plc
      • Vitro Packaging
      • Anchor Glass Container
      • Allied Glass
      • BA Glass
      • Stölzle Glass Group
      • HNG Float Glass Limited
      • Gerresheimer
  21. Assumptions & Acronyms Used
  22. Research Methodology

List of Tables

  • Table 1: Global Market Value (USD Million) Forecast by Region, 2020 to 2035
  • Table 2: Global Market Value (USD Million) Forecast by Grade , 2020 to 2035
  • Table 3: Global Market Value (USD Million) Forecast by Manufacturing Process, 2020 to 2035
  • Table 4: Global Market Value (USD Million) Forecast by Capacity, 2020 to 2035
  • Table 5: Global Market Value (USD Million) Forecast by End Use, 2020 to 2035
  • Table 6: North America Market Value (USD Million) Forecast by Country, 2020 to 2035
  • Table 7: North America Market Value (USD Million) Forecast by Grade , 2020 to 2035
  • Table 8: North America Market Value (USD Million) Forecast by Manufacturing Process, 2020 to 2035
  • Table 9: North America Market Value (USD Million) Forecast by Capacity, 2020 to 2035
  • Table 10: North America Market Value (USD Million) Forecast by End Use, 2020 to 2035
  • Table 11: Latin America Market Value (USD Million) Forecast by Country, 2020 to 2035
  • Table 12: Latin America Market Value (USD Million) Forecast by Grade , 2020 to 2035
  • Table 13: Latin America Market Value (USD Million) Forecast by Manufacturing Process, 2020 to 2035
  • Table 14: Latin America Market Value (USD Million) Forecast by Capacity, 2020 to 2035
  • Table 15: Latin America Market Value (USD Million) Forecast by End Use, 2020 to 2035
  • Table 16: Western Europe Market Value (USD Million) Forecast by Country, 2020 to 2035
  • Table 17: Western Europe Market Value (USD Million) Forecast by Grade , 2020 to 2035
  • Table 18: Western Europe Market Value (USD Million) Forecast by Manufacturing Process, 2020 to 2035
  • Table 19: Western Europe Market Value (USD Million) Forecast by Capacity, 2020 to 2035
  • Table 20: Western Europe Market Value (USD Million) Forecast by End Use, 2020 to 2035
  • Table 21: Eastern Europe Market Value (USD Million) Forecast by Country, 2020 to 2035
  • Table 22: Eastern Europe Market Value (USD Million) Forecast by Grade , 2020 to 2035
  • Table 23: Eastern Europe Market Value (USD Million) Forecast by Manufacturing Process, 2020 to 2035
  • Table 24: Eastern Europe Market Value (USD Million) Forecast by Capacity, 2020 to 2035
  • Table 25: Eastern Europe Market Value (USD Million) Forecast by End Use, 2020 to 2035
  • Table 26: East Asia Market Value (USD Million) Forecast by Country, 2020 to 2035
  • Table 27: East Asia Market Value (USD Million) Forecast by Grade , 2020 to 2035
  • Table 28: East Asia Market Value (USD Million) Forecast by Manufacturing Process, 2020 to 2035
  • Table 29: East Asia Market Value (USD Million) Forecast by Capacity, 2020 to 2035
  • Table 30: East Asia Market Value (USD Million) Forecast by End Use, 2020 to 2035
  • Table 31: South Asia and Pacific Market Value (USD Million) Forecast by Country, 2020 to 2035
  • Table 32: South Asia and Pacific Market Value (USD Million) Forecast by Grade , 2020 to 2035
  • Table 33: South Asia and Pacific Market Value (USD Million) Forecast by Manufacturing Process, 2020 to 2035
  • Table 34: South Asia and Pacific Market Value (USD Million) Forecast by Capacity, 2020 to 2035
  • Table 35: South Asia and Pacific Market Value (USD Million) Forecast by End Use, 2020 to 2035
  • Table 36: Middle East & Africa Market Value (USD Million) Forecast by Country, 2020 to 2035
  • Table 37: Middle East & Africa Market Value (USD Million) Forecast by Grade , 2020 to 2035
  • Table 38: Middle East & Africa Market Value (USD Million) Forecast by Manufacturing Process, 2020 to 2035
  • Table 39: Middle East & Africa Market Value (USD Million) Forecast by Capacity, 2020 to 2035
  • Table 40: Middle East & Africa Market Value (USD Million) Forecast by End Use, 2020 to 2035

List of Figures

  • Figure 1: Global Market Pricing Analysis
  • Figure 2: Global Market Value (USD Million) Forecast 2020-2035
  • Figure 3: Global Market Value Share and BPS Analysis by Grade , 2025 and 2035
  • Figure 4: Global Market Y to o to Y Growth Comparison by Grade , 2025-2035
  • Figure 5: Global Market Attractiveness Analysis by Grade
  • Figure 6: Global Market Value Share and BPS Analysis by Manufacturing Process, 2025 and 2035
  • Figure 7: Global Market Y to o to Y Growth Comparison by Manufacturing Process, 2025-2035
  • Figure 8: Global Market Attractiveness Analysis by Manufacturing Process
  • Figure 9: Global Market Value Share and BPS Analysis by Capacity, 2025 and 2035
  • Figure 10: Global Market Y to o to Y Growth Comparison by Capacity, 2025-2035
  • Figure 11: Global Market Attractiveness Analysis by Capacity
  • Figure 12: Global Market Value Share and BPS Analysis by End Use, 2025 and 2035
  • Figure 13: Global Market Y to o to Y Growth Comparison by End Use, 2025-2035
  • Figure 14: Global Market Attractiveness Analysis by End Use
  • Figure 15: Global Market Value (USD Million) Share and BPS Analysis by Region, 2025 and 2035
  • Figure 16: Global Market Y to o to Y Growth Comparison by Region, 2025-2035
  • Figure 17: Global Market Attractiveness Analysis by Region
  • Figure 18: North America Market Incremental Dollar Opportunity, 2025-2035
  • Figure 19: Latin America Market Incremental Dollar Opportunity, 2025-2035
  • Figure 20: Western Europe Market Incremental Dollar Opportunity, 2025-2035
  • Figure 21: Eastern Europe Market Incremental Dollar Opportunity, 2025-2035
  • Figure 22: East Asia Market Incremental Dollar Opportunity, 2025-2035
  • Figure 23: South Asia and Pacific Market Incremental Dollar Opportunity, 2025-2035
  • Figure 24: Middle East & Africa Market Incremental Dollar Opportunity, 2025-2035
  • Figure 25: North America Market Value Share and BPS Analysis by Country, 2025 and 2035
  • Figure 26: North America Market Value Share and BPS Analysis by Grade , 2025 and 2035
  • Figure 27: North America Market Y to o to Y Growth Comparison by Grade , 2025-2035
  • Figure 28: North America Market Attractiveness Analysis by Grade
  • Figure 29: North America Market Value Share and BPS Analysis by Manufacturing Process, 2025 and 2035
  • Figure 30: North America Market Y to o to Y Growth Comparison by Manufacturing Process, 2025-2035
  • Figure 31: North America Market Attractiveness Analysis by Manufacturing Process
  • Figure 32: North America Market Value Share and BPS Analysis by Capacity, 2025 and 2035
  • Figure 33: North America Market Y to o to Y Growth Comparison by Capacity, 2025-2035
  • Figure 34: North America Market Attractiveness Analysis by Capacity
  • Figure 35: North America Market Value Share and BPS Analysis by End Use, 2025 and 2035
  • Figure 36: North America Market Y to o to Y Growth Comparison by End Use, 2025-2035
  • Figure 37: North America Market Attractiveness Analysis by End Use
  • Figure 38: Latin America Market Value Share and BPS Analysis by Country, 2025 and 2035
  • Figure 39: Latin America Market Value Share and BPS Analysis by Grade , 2025 and 2035
  • Figure 40: Latin America Market Y to o to Y Growth Comparison by Grade , 2025-2035
  • Figure 41: Latin America Market Attractiveness Analysis by Grade
  • Figure 42: Latin America Market Value Share and BPS Analysis by Manufacturing Process, 2025 and 2035
  • Figure 43: Latin America Market Y to o to Y Growth Comparison by Manufacturing Process, 2025-2035
  • Figure 44: Latin America Market Attractiveness Analysis by Manufacturing Process
  • Figure 45: Latin America Market Value Share and BPS Analysis by Capacity, 2025 and 2035
  • Figure 46: Latin America Market Y to o to Y Growth Comparison by Capacity, 2025-2035
  • Figure 47: Latin America Market Attractiveness Analysis by Capacity
  • Figure 48: Latin America Market Value Share and BPS Analysis by End Use, 2025 and 2035
  • Figure 49: Latin America Market Y to o to Y Growth Comparison by End Use, 2025-2035
  • Figure 50: Latin America Market Attractiveness Analysis by End Use
  • Figure 51: Western Europe Market Value Share and BPS Analysis by Country, 2025 and 2035
  • Figure 52: Western Europe Market Value Share and BPS Analysis by Grade , 2025 and 2035
  • Figure 53: Western Europe Market Y to o to Y Growth Comparison by Grade , 2025-2035
  • Figure 54: Western Europe Market Attractiveness Analysis by Grade
  • Figure 55: Western Europe Market Value Share and BPS Analysis by Manufacturing Process, 2025 and 2035
  • Figure 56: Western Europe Market Y to o to Y Growth Comparison by Manufacturing Process, 2025-2035
  • Figure 57: Western Europe Market Attractiveness Analysis by Manufacturing Process
  • Figure 58: Western Europe Market Value Share and BPS Analysis by Capacity, 2025 and 2035
  • Figure 59: Western Europe Market Y to o to Y Growth Comparison by Capacity, 2025-2035
  • Figure 60: Western Europe Market Attractiveness Analysis by Capacity
  • Figure 61: Western Europe Market Value Share and BPS Analysis by End Use, 2025 and 2035
  • Figure 62: Western Europe Market Y to o to Y Growth Comparison by End Use, 2025-2035
  • Figure 63: Western Europe Market Attractiveness Analysis by End Use
  • Figure 64: Eastern Europe Market Value Share and BPS Analysis by Country, 2025 and 2035
  • Figure 65: Eastern Europe Market Value Share and BPS Analysis by Grade , 2025 and 2035
  • Figure 66: Eastern Europe Market Y to o to Y Growth Comparison by Grade , 2025-2035
  • Figure 67: Eastern Europe Market Attractiveness Analysis by Grade
  • Figure 68: Eastern Europe Market Value Share and BPS Analysis by Manufacturing Process, 2025 and 2035
  • Figure 69: Eastern Europe Market Y to o to Y Growth Comparison by Manufacturing Process, 2025-2035
  • Figure 70: Eastern Europe Market Attractiveness Analysis by Manufacturing Process
  • Figure 71: Eastern Europe Market Value Share and BPS Analysis by Capacity, 2025 and 2035
  • Figure 72: Eastern Europe Market Y to o to Y Growth Comparison by Capacity, 2025-2035
  • Figure 73: Eastern Europe Market Attractiveness Analysis by Capacity
  • Figure 74: Eastern Europe Market Value Share and BPS Analysis by End Use, 2025 and 2035
  • Figure 75: Eastern Europe Market Y to o to Y Growth Comparison by End Use, 2025-2035
  • Figure 76: Eastern Europe Market Attractiveness Analysis by End Use
  • Figure 77: East Asia Market Value Share and BPS Analysis by Country, 2025 and 2035
  • Figure 78: East Asia Market Value Share and BPS Analysis by Grade , 2025 and 2035
  • Figure 79: East Asia Market Y to o to Y Growth Comparison by Grade , 2025-2035
  • Figure 80: East Asia Market Attractiveness Analysis by Grade
  • Figure 81: East Asia Market Value Share and BPS Analysis by Manufacturing Process, 2025 and 2035
  • Figure 82: East Asia Market Y to o to Y Growth Comparison by Manufacturing Process, 2025-2035
  • Figure 83: East Asia Market Attractiveness Analysis by Manufacturing Process
  • Figure 84: East Asia Market Value Share and BPS Analysis by Capacity, 2025 and 2035
  • Figure 85: East Asia Market Y to o to Y Growth Comparison by Capacity, 2025-2035
  • Figure 86: East Asia Market Attractiveness Analysis by Capacity
  • Figure 87: East Asia Market Value Share and BPS Analysis by End Use, 2025 and 2035
  • Figure 88: East Asia Market Y to o to Y Growth Comparison by End Use, 2025-2035
  • Figure 89: East Asia Market Attractiveness Analysis by End Use
  • Figure 90: South Asia and Pacific Market Value Share and BPS Analysis by Country, 2025 and 2035
  • Figure 91: South Asia and Pacific Market Value Share and BPS Analysis by Grade , 2025 and 2035
  • Figure 92: South Asia and Pacific Market Y to o to Y Growth Comparison by Grade , 2025-2035
  • Figure 93: South Asia and Pacific Market Attractiveness Analysis by Grade
  • Figure 94: South Asia and Pacific Market Value Share and BPS Analysis by Manufacturing Process, 2025 and 2035
  • Figure 95: South Asia and Pacific Market Y to o to Y Growth Comparison by Manufacturing Process, 2025-2035
  • Figure 96: South Asia and Pacific Market Attractiveness Analysis by Manufacturing Process
  • Figure 97: South Asia and Pacific Market Value Share and BPS Analysis by Capacity, 2025 and 2035
  • Figure 98: South Asia and Pacific Market Y to o to Y Growth Comparison by Capacity, 2025-2035
  • Figure 99: South Asia and Pacific Market Attractiveness Analysis by Capacity
  • Figure 100: South Asia and Pacific Market Value Share and BPS Analysis by End Use, 2025 and 2035
  • Figure 101: South Asia and Pacific Market Y to o to Y Growth Comparison by End Use, 2025-2035
  • Figure 102: South Asia and Pacific Market Attractiveness Analysis by End Use
  • Figure 103: Middle East & Africa Market Value Share and BPS Analysis by Country, 2025 and 2035
  • Figure 104: Middle East & Africa Market Value Share and BPS Analysis by Grade , 2025 and 2035
  • Figure 105: Middle East & Africa Market Y to o to Y Growth Comparison by Grade , 2025-2035
  • Figure 106: Middle East & Africa Market Attractiveness Analysis by Grade
  • Figure 107: Middle East & Africa Market Value Share and BPS Analysis by Manufacturing Process, 2025 and 2035
  • Figure 108: Middle East & Africa Market Y to o to Y Growth Comparison by Manufacturing Process, 2025-2035
  • Figure 109: Middle East & Africa Market Attractiveness Analysis by Manufacturing Process
  • Figure 110: Middle East & Africa Market Value Share and BPS Analysis by Capacity, 2025 and 2035
  • Figure 111: Middle East & Africa Market Y to o to Y Growth Comparison by Capacity, 2025-2035
  • Figure 112: Middle East & Africa Market Attractiveness Analysis by Capacity
  • Figure 113: Middle East & Africa Market Value Share and BPS Analysis by End Use, 2025 and 2035
  • Figure 114: Middle East & Africa Market Y to o to Y Growth Comparison by End Use, 2025-2035
  • Figure 115: Middle East & Africa Market Attractiveness Analysis by End Use
  • Figure 116: Global Market - Tier Structure Analysis
  • Figure 117: Global Market - Company Share Analysis
Dashboard
Dashboard
Dashboard
Dashboard
Dashboard
Dashboard

Our Research Products

Full Research Suite

The "Full Research Suite" delivers actionable market intel, deep dives on markets or technologies, so clients act faster, cut risk, and unlock growth.

Competitor Leaderboard Report

The Leaderboard benchmarks and ranks top vendors, classifying them as Established Leaders, Leading Challengers, or Disruptors & Challengers.

Future Leaders Index

Locates where complements amplify value and substitutes erode it, forecasting net impact by horizon

Market Data & Forecasts

We deliver granular, decision-grade intel: market sizing, 5-year forecasts, pricing, adoption, usage, revenue, and operational KPIs—plus competitor tracking, regulation, and value chains—across 60 countries broadly.

Market Focus Report

Spot the shifts before they hit your P&L. We track inflection points, adoption curves, pricing moves, and ecosystem plays to show where demand is heading, why it is changing, and what to do next across high-growth markets and disruptive tech

Survey Report

Real-time reads of user behavior. We track shifting priorities, perceptions of today’s and next-gen services, and provider experience, then pace how fast tech moves from trial to adoption, blending buyer, consumer, and channel inputs with social signals (#WhySwitch, #UX).

Bespoke Reports

Partner with our analyst team to build a custom report designed around your business priorities. From analysing market trends to assessing competitors or crafting bespoke datasets, we tailor insights to your needs.

Supplier Intelligence

Discovery & Profiling

Capacity & Footprint

Performance & Risk

Compliance & Governance

Commercial Readiness

Who Supplies Whom

Scorecards & Shortlists

Playbooks & Docs

Category Intelligence

Definition & Scope

Demand & Use Cases

Cost Drivers

Market Structure

Supply Chain Map

Trade & Policy

Operating Norms

Deliverables

Buyer Intelligence

Account Basics

Spend & Scope

Procurement Model

Vendor Requirements

Terms & Policies

Entry Strategy

Pain Points & Triggers

Outputs

Pricing Analysis

Benchmarks

Trends

Should-Cost

Indexation

Landed Cost

Commercial Terms

Deliverables

Brand Analysis

Positioning & Value Prop

Share & Presence

Customer Evidence

Go-to-Market

Digital & Reputation

Compliance & Trust

KPIs & Gaps

Outputs

Full Research Suite comprises of:

Market outlook & trends analysis

Market outlook & trends analysis

Interviews & case studies

Interviews & case studies

Strategic recommendations

Strategic recommendations

Vendor profiles & capabilities analysis

Vendor profiles & capabilities analysis

5-year forecasts

5-year forecasts

8 regions and 60+ country-level data splits

8 regions and 60+ country-level data splits

Market segment data splits

Market segment data splits

12 months of continuous data updates

12 months of continuous data updates

DELIVERED AS:

PDF EXCEL ONLINE

Full Research Suite


$5000

$7500

$10000

Buy Report Now
Similar Industry Reports

Similar Industry Reports

Glass Bottles Market

Glass Bottles Market Forecast and Outlook 2025 to 2035

Glass Bottle and Container Market

Glass Bottle and Container Market Forecast and Outlook 2025 to 2035

Glass Bottles And Containers Market

Glass Bottles And Containers Market Size and Share Forecast Outlook 2025 to 2035

Glass Bottles Market Share Analysis

Competitive Overview of Glass Bottles Market Share

Glass Cosmetic Bottle Market

Glass Cosmetic Bottle Market Size and Share Forecast Outlook 2025 to 2035

Glass Cosmetic Bottles Market Share Analysis

Industry Share & Competitive Positioning in Glass Cosmetic Bottles

Glass Medicine Bottles Market

Glass Medicine Bottles Market

Returnable Glass Bottle Market

Returnable Glass Bottle Market Trends – Size & Forecast 2024-2034

Boston Round Glass Bottle Market

Boston Round Glass Bottle Market Size and Share Forecast Outlook 2025 to 2035

Demand for Glass Cosmetic Bottles in Japan

Demand for Glass Cosmetic Bottles in Japan Size and Share Forecast Outlook 2025 to 2035

Demand for Glass Cosmetic Bottles in USA

Demand for Glass Cosmetic Bottles in USA Size and Share Forecast Outlook 2025 to 2035

Premium Spirits Glass Bottle Market

Premium Spirits Glass Bottle Market Size and Share Forecast Outlook 2025 to 2035

Glass Rolling Forming Machine Market

Glass Rolling Forming Machine Market Size and Share Forecast Outlook 2025 to 2035

Glass Laser Engraving Machine Market

Glass Laser Engraving Machine Market Size and Share Forecast Outlook 2025 to 2035

Glass Restoration Kit Market

Glass Restoration Kit Market Size and Share Forecast Outlook 2025 to 2035

Glass Additive Market

Glass Additive Market Forecast and Outlook 2025 to 2035

Glass Reactor Market

Glass Reactor Market Size and Share Forecast Outlook 2025 to 2035

Glass & Metal Cleaner Market

Glass & Metal Cleaner Market Size and Share Forecast Outlook 2025 to 2035

Glass Product Market

Glass Product Market Size and Share Forecast Outlook 2025 to 2035

Glassine Paper Market

Glassine Paper Market Size and Share Forecast Outlook 2025 to 2035

Future Market Insights

Glass Liquor Bottle Market

Chat With MaRIA

Chat With

MaRIA

Hi There, I am MaRIA, Your Market Research Intelligence Assistant. How may I help you?