This site uses cookies, including third-party cookies, that help us to provide and improve our services.

Privacy Policy
- Global Locations -
Headquarters
Future Market Insights, Inc.
Christiana Corporate, 200 Continental Drive, Suite 401, Newark, Delaware - 19713, United States
T: +1-845-579-5705
MEA
Market Access DMCC

1602-6 Jumeirah Bay X2 Tower, Plot No: JLT-PH2-X2A,

Jumeirah Lakes Towers, Dubai,

United Arab Emirates

Americas
Future Market Insights
616 Corporate Way, Suite 2-9018,
Valley Cottage, NY 10989,
United States
T: +1-347-918-3531
Europe
Future Market Insights
3rd Floor, 207 Regent Street,
London W1B 3HH
United Kingdom
T: + 44 (0) 20 8123 9659
D: +44 (0) 20 3287 4268
APAC
Future Market Insights
Office No. 401-A, 4th Floor,
VANTAGE 9, S.No. 36/1/1,
Baner, Pune 411045 India

Antimicrobial Additives Market

Antimicrobial Additives Market: An Innovative Protection Against Microbes! Explore More With FMI!

Antimicrobial Additives Market by Application, End use & Region - Forecast 2022 – 2032

Antimicrobial Additives Market Outlook (2022-2032)

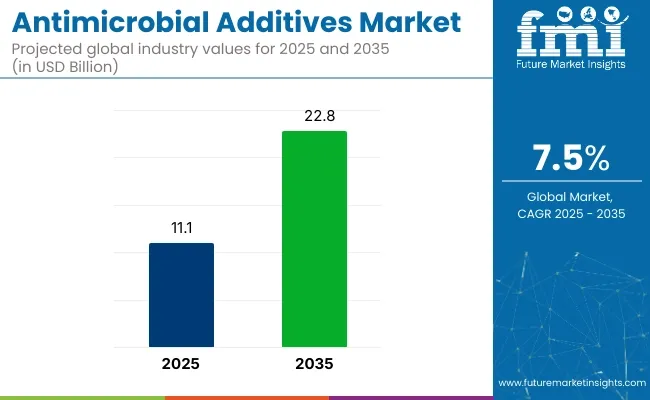
[177 Pages Report] The global antimicrobial additives market is estimated to be valued at around US$ 12,711.5 Mn in 2022. Furthermore, with rising usage in fabrics, inks, paints, paper, plastic and several other applications, the overall sales of antimicrobial additives are projected to increase at a healthy CAGR of 8.2 % between 2022 and 2032, totaling a valuation of US$ 27,955.6 Mn by 2032.

Antimicrobial additives are active agents that when included in the processing of materials will inhibit the life or growth of microbes. They have proven effective in preventing the growth of infection and fever-causing microorganisms such as bacteria, fungi, mold, and algae in numerous materials. They also play a key role in extending shelf life of products.

Increasing adoption of antimicrobial additives in various end-use industries such as automotive, electronics, building & construction, and healthcare is expected to boost the growth of antimicrobial additives market during the assessment period.

Similarly, growing consumption of antimicrobic additives to inhibit microbial growth on the surface of plastic products and medical equipment is expected to push the demand for antimicrobial additives.

In addition to this, rapid consumer shift from conventional materials such as glass and metals towards antimicrobial plastics in the automotive application will further fuel demand in the antimicrobial additives market.

Attribute

Key Statistics

Antimicrobial Additive Market Base Value (2021A)

US$ 11,762.8 Mn

Estimated Market Size (2022E)

US$ 12,711.5 Mn

Projected Market Size (2032F)

US$ 27,955.6 Mn

Value-based CAGR (2022-2032)

8.2 %

Collective Value Share: Top 3 Countries (2022E)

84%

Customize this Report

Let us know your requirement to get
100% FREE customization

2013-2021 Antimicrobial Additives Market Outlook Compared to 2022-2032 Forecast

The global demand for antimicrobial additives market is projected to grow at 8.2% CAGR between 2022 and 2032, in comparison to 7.7% CAGR registered during the historical period of 2013 and 2021.

This higher growth outlook for the market during the forecast period is due to the rising concern among consumers regarding personal and family wellness and presence of regulations encouraging the use of antimicrobial products and devices in order to minimize health hazards.

Over the years, a significant shift towards hygiene products and growing awareness among consumers about hygiene and health issues due to the spread of viruses and infections have led to an increased customer focus on antimicrobial products such as plastics, coatings, textiles, and others.

The paints and coating industry continues to face pressure in a way of environmental regulations which is prompting coatings manufacturers to reformulate their products. They are using a variety of antimicrobial additives to improve product quality and prevent microbial growth.

Further, changing lifestyle of consumers and longer working hours is resulting in increasing demand for packaged ready-to-eat and frozen foods. This is also expected to propel the demand for antimicrobic additives in the upcoming years.

Antimicrobial Additives Market Download Report Brochure

What are the Key Trends Driving the Global Antimicrobial Additives Market?

“Rising Usage in Healthcare Sector Bolstering Sales in the Antimicrobial Additive Market

Antimicrobial additives are increasingly finding application in the healthcare sector to create a sterile environment in the hospital. They provide permanent protection against the growth of microbes and according to various research reports demand for antimicrobial plastic products and coatings in the medical and healthcare sector is expected to increase at a robust pace during the forthcoming period.

Antimicrobial additives find appliaction in the production of numerous medical products. For instance, they are used in the production of equipment such as breathing circuits, ventilators, examination tables, and hospital beds. Besides this, they are also used in wallpapers, tissue paper, and printing papers to reduce the spread of infections. Thus, increasing demand for these products will continue to propel sales in the global market during the assessment period.

In addition to this, growing demand for antimicrobial additives to reduce the cross contamination in critical environments is expected to bolster the demand for antimicrobic additives in the market.

Healthcare professionals as well as medical devices manufacturers are rapidly shifting their preference towards materials like plastic, fabric, and coatings that contain antimicrobial substances. Usage of these antimicrobial products helps them to prevent hospital-acquired infections and healthcare associated infections.

“Increasing Consumption of Antimicrobial Additives in Food and Beverage Industry to Support Market Growth”

Antimicrobial additives are being extensively used in food products to protect them from spoilage during their manufacturing and distribution and expanding their shelf life.

In recent years the demand for packaged fresh food products has grown at a substantial pace due to changing lifestyles, increasing disposable income, and hectic lifestyles. However, these food products can be subjected to contamination by micro-organism and this can cause undesirable reactions that deteriorate odor, textual properties, and color of food ingredients.

In order to prevent microbial growth, preserve food ingredients, and minimize the risk of diseases, manufacturers use antimicrobial additives in food packaging. The rising demand for food packaging which has no intended effect on any portion of the object and increases the shelf life of food will continue to propel the sales of antimicrobial additives.

“Development of New Grades to Create Lucrative Opportunities for Manufacturers in the Global Antimicrobial Additives Market”

Antimicrobic additives manufacturing companies are focusing on developing new grades of microbial control additives such as silver-based antimicrobial Makrolon for medical devices, new advanced antimicrobial additives to protect plasticized PV, and antimicrobial product which is a low-volatile organic compound paint film fungicide.

They are focusing on shifting from nonedible antimicrobic additives to edible ones owing to the environmental concern of synthetic polymer-based packaging material. Many manufacturers are offering an innovation within the biodegradable active packaging concept. They are developing and validating new antimicrobial additives which are derived naturally from fruits such as citrus and tomatoes.

Moreover, researchers are working on new technology of antimicrobial additives to introduce safe and effective products. For instance, recently the UGA Center for Food Safety and the UGA Department of Food Science and Technology collaborated to develop and validate a new antimicrobial called Fatty acid antimicrobial sanitizer Technology (FaAST) which is effective against a foodborne bacterial pathogen.

Nikhil Kaitwade
Nikhil Kaitwade
Principal Consultant
LinkedIn
Talk to Analyst

Find your sweet spots for generating winning opportunities in this market.

Talk to Analyst

What is the Threat to Antimicrobial Additives Market?

Antimicrobial chemicals with capability to modify or destroy the cell structure of microorganisms could possibly influence the cell structure of living organisms in the environment and this concern is hampering market growth to a certain extent.

In addition to this, over 250 antimicrobial chemical formulations are commercially available in the market. This diversity of antimicrobial chemicals has led to a variety of physical and chemical properties in the finished product. The organometallic antimicrobials such as oxybisphenox arsine (OBPA) additives are very cost-effective and efficient, but their use has been limited because of market perception and market perception regarding their long-term toxicity. Environmental concerns such as health hazards associated with the use of antimicrobial products is also restraining growth of the antimicrobial additives market.

Country-wise Insights

What Will be the Demand Outlook of Antimicrobial Additives Market in the U.S.?

“Rising Usage Across Food & Beverages and Healthcare Industries Boosting Sales in the U.S.”

The U.S. antimicrobial additives market is poised to expand at a robust pace during the forecast period owing to rising consumption of antimicrobial ingredients in various sectors such as food and beverages, automobile, electronics, and others.

Over the years, changing lifestyles and preferences for packaged foods has resulted in the surge in demand for food additives that increase the shelf life of products. Majority of food manufacturers across the U.S. use antimicrobial additives in their products to prevent the growth of microbes.

In addition to this, antimicrobial plastic products are gaining immense traction across automotive and healthcare industries. These antimicrobial plastic products are being increasingly used for medical devices and equipment.

Thus, rapid expansion of healthcare sector along with burgeoning sales of medical devices will continue to boost antimicrobial additives market in the U.S. during the forecast period.

Owing to the rising consumption of antimicrobial additives across food and beverages, healthcare, construction, and automotive industries, the U.S. is set to account for 16.9 % of the overall volume consumption in 2022.

How Will Growth Unfold in Indian Antimicrobial Additives Market?

“Booming Automotive Industry Triggering Antimicrobial Additives Market Growth in India”

As per FMI, the antimicrobial additives market in India is anticipated to expand at a healthy pace between 2022 and 2032, owing to the rapid growth of automotive sector, increasing usage of antimicrobial additives in vehicles parts, growing awareness about the benefits of antimicrobic additives, and surge in the number of regional and domestic antimicrobial additive manufacturers.

In recent years, the automobile industry in India has witnessed robust growth. As per the research, India is the 5th largest automobile market in the world. Several Indian automobile manufacturers have spread their business all over the global as well as many MNCs are investing in the automobile sector in India.

Many manufacturing companies in India are starving to launch new products and collaborate or merge with other major key players. Increasing demand for luxury commercial vehicles and government’s continued support for manufacturing units are igniting the growth of the automobile sector in India.

This rapid expansion of automotive industry in the country is in turn boosting the growth of antimicrobial additives market. Both manufacturers and consumers are gradually shifting their preference towards more efficient and hygienic products. They are replacing conventional materials such as glass and metals, with antimicrobial plastics which will continue to boost sales in the antimicrobial additives in the market.

MarketNage
Become a MarketNgage Insider

A unified Market Research Subscription Platform, built for today's disparate research needs.

Category-wise Insights

Which Application Contributes Most to the Antimicrobial Additives Market?

“Plastics to Remain the Most Lucrative Application for Antimicrobial Additives”

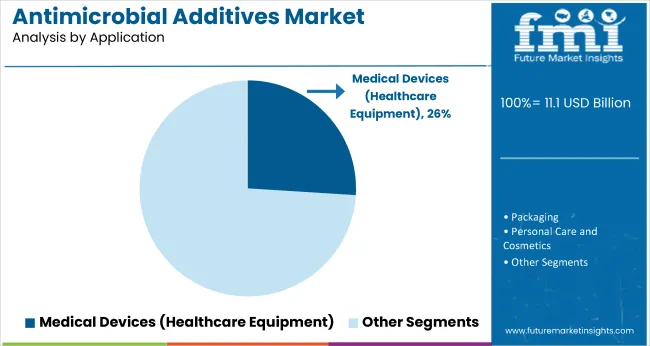
As per FMI, plastic segment is likely to hold the largest share of around 31.80% din the global antimicrobial additives market during the forecast period. This can be attributed to rising demand for plastics with antimicrobial additives across numerous end-use industries.

Plastic is susceptible to microbial attack and can result in physical degradation, staining, and odors. This will eventually lead to the potential loss of product integrity. In order to prevent the growth of microbes, manufacturers increasingly use antimicrobic additives.

The antimicrobic additives offer very valuable protection for the polymers and prevent the growth of the micro-organism. Theya maintain the aesthetic appeal and reduce undesirable reactions from the micro-organism.

Addition of antimicrobial additives also increase the tensile strength and life of the plastic. Owing to the various benefits of antimicrobial additives, they are used in various applications such as housewares plastics, commercial plastics, building products, medical devices and others.

What is the Growth Outlook of the Antimicrobial Additives in Automotive Sector?

“Demand for Antimicrobial Additives to Grow at a Considerable Pace in Automotive Sector”

Based on end use, FMI predicts the automotive segment to grow at a strong pace during the forecast period, owing to the rising need for improving passenger safety and increasing usage of antimicrobial plastics in vehicles.

Drivers often come into contact with different high- touch surfaces over the course of the day such as door handles, ATM buttons, fuel pumps, shopping trolleys, etc. All of these surfaces are covered with microbes which eventually get transferred into the interior of the car, steering of the wheel, handbrake, gear stick and other parts of the vehicle. In order to tackle this, manufacturers use antimicrobial additives in various parts of vehicles.

Thus, increasing need for protecting passengers and vehicles from the micro-organism will continue to push the demand for antimicrobial additives during the forecast period.

Similarly, growing consumer demand for vehicles and rapidly expanding automobile sector will boost the growth of the antimicrobial additives market over the coming years.

Competitive Landscape

Key market participants in the global industry are working on new formulations of antimicrobial products as well as producing and developing more sustainable ones. They have shifted their preference towards edible and biobased antimicrobial additives owing to the regulatory pressure for safer additives.

Besides this, they are acquiring other companies to generate more revenue and increase market volume. For instance:

  • In September 2021, Biocote unveiled new innovative antimicrobial solutions at Interplas exhibition 2021 held at the NEC in Birmingham.
  • In 2021, radical Materials launched a new antimicrobial additives under its SteriTouch brand.

Scope of Report

Attribute

Details

Estimated Market Size (2022)

US$ 12,711.5 Mn

Projected Market Size (2032)

US$ 27,955.6 Mn

Anticipated Growth Rate (2022-2032)

8.2 %

Forecast Period

2022-2032

Historical Data Available for

2013-2021

Market Analysis

USS Million for Value and Tons for Volume

Key Countries Covered

U.S., Canada, Brazil, Mexico, Germany, Italy, France, U.K., Spain, BENELUX, Russia, China, Japan, South Korea, India, ASEAN, ANZ, GCC Countries, Turkey, Northern Africa, South Africa

Key Segments Covered

Application, End Use, and Region

Key Companies Profiled

  • Akzonobel N.V.
  • BASF SE
  • The Dow Chemical Company
  • Sanitized AG
  • Steri touch Ltd
  • Biocote Ltd.
  • Life Material Technologies Limited
  • Momentive Performance Materials Inc.
  • Clariant Chemicals India Ltd.
  • Nanobiomatters

Report Coverage

Market Forecast, Company Share Analysis, Competition Intelligence, DROT Analysis, Market Dynamics and Challenges, and Strategic Growth Initiatives

Antimicrobial additive Market Segmentation

By Application:

  • Fabric / Textile
  • Inks
  • Paints and Coatings
  • Paper
  • Plastic
  • Silicone & Rubber
  • Others

By End Use:

  • Automotive
  • Building and Construction
  • Electronics
  • Food and Beverages
  • Healthcare
  • Other

By Region:

  • North America
  • Latin America
  • Europe
  • East Asia
  • South Asia & Pacific
  • Middle East & Africa

Frequently Asked Questions

The global antimicrobial additive market is estimated to reach a valuation of US$ 12,711.5 Mn in 2022.

As per FMI, the global antimicrobial additives market will grow at 8.2% CAGR through 2032.

The antimicrobial additives market is likely to reach a valuation of US$ 27,955.6 Mn in 2032

Plastic will remain the most profitable application for antimicrobial additives, accounting for a share of 31.80 % of the global market.

Healthcare and Automotive are the leading end-use industries for antimicrobial additives.

Akzonobel N.V, BASF SE, The Dow Chemical Company, Sanitized AG, Steri touch Ltd, Biocote Ltd. and others are identified as the key manufacturers of the antimicrobial additives.

Healthcare will remain the key end use segment in the global antimicrobial additives market accounting for about 33.20 % of the overall market share.

The top countries driving antimicrobial additives demand are the U.S., Japan, and Germany.

Table of Content

1. Executive Summary

    1.1. Global Market Outlook

    1.2. Demand Side Trends

    1.3. Supply Side Trends

    1.4. Technology Roadmap

    1.5. Analysis and Recommendations

2. Market Overview

    2.1. Market Coverage / Taxonomy

    2.2. Market Definition / Scope / Limitations

3. Key Market Trends

    3.1. Key Trends Impacting the Market

    3.2. Product Innovation / Development Trends

4. Key Success Factors

    4.1. Product Adoption / Usage Analysis

    4.2. Product USPs / Features

    4.3. Strategic Promotional Strategies

5. Global Market Demand Analysis 2013-2021 and Forecast, 2022–2032

    5.1. Historical Market Volume (Tons) Analysis, 2013-2021

    5.2. Current and Future Market Volume (Tons) Projections, 2022–2032

    5.3. Y-o-Y Growth Trend Analysis

6. Global Market - Pricing Analysis

    6.1. Regional Pricing Analysis By Product Type

    6.2. Global Average Pricing Analysis Benchmark

7. Global Market Demand (in Value or Size in US$ Mn) Analysis 2013-2021 and Forecast, 2022–2032

    7.1. Historical Market Value (US$ Mn) Analysis, 2013-2021

    7.2. Current and Future Market Value (US$ Mn) Projections, 2022–2032

        7.2.1. Y-o-Y Growth Trend Analysis

        7.2.2. Absolute $ Opportunity Analysis

8. Market Background

    8.1. Macro-Economic Factors

        8.1.1. Global GDP Growth Outlook

        8.1.2. Global Healthcare Industry Outlook

        8.1.3. Global Automotive Industry Outlook

        8.1.4. Global Food and Beverages Industry Outlook

        8.1.5. textile Industry Outlook

        8.1.6. Global Plastic Industry Outlook

        8.1.7. Global Paints and Coating sector Overview

        8.1.8. Other Macro-economic Factors

    8.2. Forecast Factors - Relevance & Impact

        8.2.1. Top Companies Historical Growth

        8.2.2. GDP Growth forecast

        8.2.3. Global Urbanization Growth Outlook

        8.2.4. Demand from End Use Industries

        8.2.5. Other Forecast Factors

    8.3. Value Chain Analysis

        8.3.1. Distributors

        8.3.2. Product Manufacturers

        8.3.3. End Users

    8.4. COVID-19 Crisis – Impact Assessment

        8.4.1. Current Statistics

        8.4.2. Short-Mid-Long Term Outlook

        8.4.3. Likely Rebound

    8.5. Market Dynamics

        8.5.1. Drivers

        8.5.2. Restraints

        8.5.3. Opportunity Analysis

    8.6. Global Supply Demand Analysis

9. Global Market Analysis 2013-2021 and Forecast 2022–2032, By Application

    9.1. Introduction / Key Findings

    9.2. Historical Market Size (US$ Mn) and Volume Analysis By Application, 2013-2021

    9.3. Current and Future Market Size (US$ Mn) and Volume Analysis and Forecast By Application, 2022–2032

        9.3.1. Fabric / Textile

        9.3.2. Inks

        9.3.3. Paints and Coatings

        9.3.4. Paper

        9.3.5. Plastics

        9.3.6. Silicone & Rubber

        9.3.7. Other

    9.4. Market Attractiveness Analysis By Application

10. Global Market Analysis 2013-2021 and Forecast 2022–2032, By End Use

    10.1. Introduction / Key Findings

    10.2. Historical Market Size (US$ Mn) and Volume Analysis By End Use, 2013-2021

    10.3. Current and Future Market Size (US$ Mn) and Volume Analysis and Forecast By End Use, 2022–2032

        10.3.1. Automotive

        10.3.2. Building and Construction

        10.3.3. Electronics

        10.3.4. Food and Beverages

        10.3.5. Healthcare

        10.3.6. Others

    10.4. Market Attractiveness Analysis By End Use

11. Global Market Analysis 2013-2021 and Forecast 2022–2032, by Region

    11.1. Introduction

    11.2. Historical Market Size (US$ Mn) and Volume Analysis By Region, 2013-2021

    11.3. Current Market Size (US$ Mn) and Volume Analysis and Forecast By Region, 2022–2032

        11.3.1. North America

        11.3.2. Latin America

        11.3.3. Europe

        11.3.4. East Asia

        11.3.5. South Asia and Pacific

        11.3.6. Middle East & Africa

    11.4. Market Attractiveness Analysis By Region

12. North America Market Analysis 2013-2021 and Forecast 2022–2032

    12.1. Introduction

    12.2. Pricing Analysis

    12.3. Historical Market Size (US$ Mn) and Volume Trend Analysis By Market Taxonomy, 2013-2021

    12.4. Market Size (US$ Mn) and Volume Forecast By Market Taxonomy, 2022–2032

        12.4.1. By Country

            12.4.1.1. U.S.

            12.4.1.2. Canada

        12.4.2. By Application

        12.4.3. By End Use

    12.5. Market Attractiveness Analysis

        12.5.1. By Country

        12.5.2. By Application

        12.5.3. By End Use

    12.6. Market Trends

    12.7. Key Market Participants - Intensity Mapping

    12.8. Drivers and Restraints - Impact Analysis

13. Latin America Market Analysis 2013-2021 and Forecast 2022–2032

    13.1. Introduction

    13.2. Pricing Analysis

    13.3. Historical Market Size (US$ Mn) and Volume Trend Analysis By Market Taxonomy, 2013-2021

    13.4. Market Size (US$ Mn) and Volume Forecast By Market Taxonomy, 2022–2032

        13.4.1. By Country

            13.4.1.1. Brazil

            13.4.1.2. Mexico

            13.4.1.3. Rest of Latin America

        13.4.2. By Application

        13.4.3. By End Use

    13.5. Market Attractiveness Analysis

        13.5.1. By Country

        13.5.2. By Application

        13.5.3. By End Use

    13.6. Market Trends

    13.7. Key Market Participants - Intensity Mapping

    13.8. Drivers and Restraints - Impact Analysis

14. Europe Market Analysis 2013-2021 and Forecast 2022–2032

    14.1. Introduction

    14.2. Pricing Analysis

    14.3. Historical Market Size (US$ Mn) and Volume Trend Analysis By Market Taxonomy, 2013-2021

    14.4. Market Size (US$ Mn) and Volume Forecast By Market Taxonomy, 2022–2032

        14.4.1. By Country

            14.4.1.1. Germany

            14.4.1.2. Italy

            14.4.1.3. France

            14.4.1.4. U.K.

            14.4.1.5. Spain

            14.4.1.6. BENELUX

            14.4.1.7. Russia

            14.4.1.8. Rest of Europe

        14.4.2. By Application

        14.4.3. By End Use

    14.5. Market Attractiveness Analysis

        14.5.1. By Country

        14.5.2. By Application

        14.5.3. By End Use

    14.6. Market Trends

    14.7. Key Market Participants - Intensity Mapping

    14.8. Drivers and Restraints - Impact Analysis

15. South Asia and Pacific Market Analysis 2013-2021 and Forecast 2022–2032

    15.1. Introduction

    15.2. Pricing Analysis

    15.3. Historical Market Size (US$ Mn) and Volume Trend Analysis By Market Taxonomy, 2013-2021

    15.4. Market Size (US$ Mn) and Volume Forecast By Market Taxonomy, 2022–2032

        15.4.1. By Country

            15.4.1.1. India

            15.4.1.2. ASEAN

            15.4.1.3. Oceania

            15.4.1.4. Rest of South Asia & Pacific

        15.4.2. By Application

        15.4.3. By End Use

    15.5. Market Attractiveness Analysis

        15.5.1. By Country

        15.5.2. By Application

        15.5.3. By End Use

    15.6. Market Trends

    15.7. Key Market Participants - Intensity Mapping

    15.8. Drivers and Restraints - Impact Analysis

16. East Asia Market Analysis 2013-2021 and Forecast 2022–2032

    16.1. Introduction

    16.2. Pricing Analysis

    16.3. Historical Market Size (US$ Mn) and Volume Trend Analysis By Market Taxonomy, 2013-2021

    16.4. Market Size (US$ Mn) and Volume Forecast By Market Taxonomy, 2022–2032

        16.4.1. By Country

            16.4.1.1. China

            16.4.1.2. Japan

            16.4.1.3. South Korea

        16.4.2. By Application

        16.4.3. By End Use

    16.5. Market Attractiveness Analysis

        16.5.1. By Country

        16.5.2. By Application

        16.5.3. By End Use

    16.6. Market Trends

    16.7. Key Market Participants - Intensity Mapping

    16.8. Drivers and Restraints - Impact Analysis

17. Middle East and Africa Market Analysis 2013-2021 and Forecast 2022–2032

    17.1. Introduction

    17.2. Pricing Analysis

    17.3. Historical Market Size (US$ Mn) and Volume Trend Analysis By Market Taxonomy, 2013-2021

    17.4. Market Size (US$ Mn) and Volume Forecast By Market Taxonomy, 2022–2032

        17.4.1. By Country

            17.4.1.1. GCC Countries

            17.4.1.2. Turkey

            17.4.1.3. Northern Africa

            17.4.1.4. South Africa

            17.4.1.5. Rest of Middle East and Africa

        17.4.2. By Application

        17.4.3. By End Use

    17.5. Market Attractiveness Analysis

        17.5.1. By Country

        17.5.2. By Application

        17.5.3. By End Use

    17.6. Market Trends

    17.7. Key Market Participants - Intensity Mapping

    17.8. Drivers and Restraints - Impact Analysis

18. Country Wise Market Analysis 2021-2031

    18.1. Introduction

        18.1.1. Market Value Proportion Analysis, By Key Countries

        18.1.2. Global Vs. Country Growth Comparison

    18.2. U.S. Market Analysis

        18.2.1. By Application

        18.2.2. By End Use

    18.3. Canada Market Analysis

        18.3.1. By Application

        18.3.2. By End Use

    18.4. Mexico Market Analysis

        18.4.1. By Application

        18.4.2. By End Use

    18.5. Brazil Market Analysis

        18.5.1. By Application

        18.5.2. By End Use

    18.6. Germany Market Analysis

        18.6.1. By Application

        18.6.2. By End Use

    18.7. Italy Market Analysis

        18.7.1. By Application

        18.7.2. By End Use

    18.8. France Market Analysis

        18.8.1. By Application

        18.8.2. By End Use

    18.9. U.K. Market Analysis

        18.9.1. By Application

        18.9.2. By End Use

    18.10. Spain Market Analysis

        18.10.1. By Application

        18.10.2. By End Use

    18.11. Russia Market Analysis

        18.11.1. By Application

        18.11.2. By End Use

    18.12. China Market Analysis

        18.12.1. By Application

        18.12.2. By End Use

    18.13. Japan Market Analysis

        18.13.1. By Application

        18.13.2. By End Use

    18.14. S. Korea Market Analysis

        18.14.1. By Application

        18.14.2. By End Use

    18.15. India Market Analysis

        18.15.1. By Application

        18.15.2. By End Use

    18.16. ASEAN Market Analysis

        18.16.1. By Application

        18.16.2. By End Use

    18.17. Australia and New Zealand Market Analysis

        18.17.1. By Application

        18.17.2. By End Use

    18.18. Turkey Market Analysis

        18.18.1. By Application

        18.18.2. By End Use

    18.19. South Africa Market Analysis

        18.19.1. By Application

        18.19.2. By End Use

19. Market Structure Analysis

    19.1. Market Analysis by Tier of Companies (Antimicrobial Additives)

    19.2. Market Share Analysis of Top Players

    19.3. Market Presence Analysis

        19.3.1. By Product type

        19.3.2. By Regional Footprint

20. Competition Analysis

    20.1. Competition Dash Application

    20.2. Competition Benchmarking

    20.3. Competition Deep Dive

        20.3.1. Akzonobel N.V.

            20.3.1.1. Overview

            20.3.1.2. Product Portfolio

            20.3.1.3. Profitability by Market Segments (Product/Channel/Region)

            20.3.1.4. Sales Footprint

            20.3.1.5. Strategy Overview

        20.3.2. BASF SE

            20.3.2.1. Overview

            20.3.2.2. Product Portfolio

            20.3.2.3. Profitability by Market Segments (Product/Channel/Region)

            20.3.2.4. Sales Footprint

            20.3.2.5. Strategy Overview

        20.3.3. Dow Chemical Company

            20.3.3.1. Overview

            20.3.3.2. Product Portfolio

            20.3.3.3. Profitability by Market Segments (Product/Channel/Region)

            20.3.3.4. Sales Footprint

            20.3.3.5. Strategy Overview

        20.3.4. Sanitized A.G.

            20.3.4.1. Overview

            20.3.4.2. Product Portfolio

            20.3.4.3. Profitability by Market Segments (Product/Channel/Region)

            20.3.4.4. Sales Footprint

            20.3.4.5. Strategy Overview

        20.3.5. SteriTouch Ltd.

            20.3.5.1. Overview

            20.3.5.2. Product Portfolio

            20.3.5.3. Profitability by Market Segments (Product/Channel/Region)

            20.3.5.4. Sales Footprint

            20.3.5.5. Strategy Overview

        20.3.6. Biocote Ltd.

            20.3.6.1. Overview

            20.3.6.2. Product Portfolio

            20.3.6.3. Profitability by Market Segments (Product/Channel/Region)

            20.3.6.4. Sales Footprint

            20.3.6.5. Strategy Overview

        20.3.7. Life Material Technologies Limited

            20.3.7.1. Overview

            20.3.7.2. Product Portfolio

            20.3.7.3. Profitability by Market Segments (Product/Channel/Region)

            20.3.7.4. Sales Footprint

            20.3.7.5. Strategy Overview

        20.3.8. Momentive Performance Materials Inc.

            20.3.8.1. Overview

            20.3.8.2. Product Portfolio

            20.3.8.3. Profitability by Market Segments (Product/Channel/Region)

            20.3.8.4. Sales Footprint

            20.3.8.5. Strategy Overview

        20.3.9. Clariant Chemicals India Ltd

            20.3.9.1. Overview

            20.3.9.2. Product Portfolio

            20.3.9.3. Profitability by Market Segments (Product/Channel/Region)

            20.3.9.4. Sales Footprint

            20.3.9.5. Strategy Overview

        20.3.10. Nanobiomatters

            20.3.10.1. Overview

            20.3.10.2. Product Portfolio

            20.3.10.3. Profitability by Market Segments (Product/Channel/Region)

            20.3.10.4. Sales Footprint

            20.3.10.5. Strategy Overview

21. Assumptions and Acronyms Used

22. Research Methodology
Customize this Report

Let us know your requirement to get
100% FREE customization

List of Tables

Table 01: Global Market Value (US$ Mn) and Volume (Tons) Forecast by Application, 2013-2032

Table 02: Global Market Value (US$ Mn) and Volume (Tons) Forecast by End Use, 2013-2032

Table 03: Global Market Value (US$ Mn) and Volume (Tons) Forecast by Region, 2013-2032

Table 04: North America Market Volume (Tons) & Value (US$ Mn) Forecast by Country, 2013-2032

Table 05: North America Market Value (US$ Mn) and Volume (Tons) Forecast by Application, 2013-2032

Table 06: North America Market Value (US$ Mn) and Volume (Tons) Forecast by End Use, 2013-2032

Table 07: Latin America Market Volume (Tons) & Value (US$ Mn) Forecast by Country, 2013-2032

Table 08: Latin America Market Value (US$ Mn) and Volume (Tons) Forecast by Application, 2013-2032

Table 09: Latin America Market Value (US$ Mn) and Volume (Tons) Forecast by End Use, 2013-2032

Table 10: Europe Market Volume (Tons) Forecast by Country 2013-2032

Table 11: Europe Market Value (US $ Mn) Forecast by Country, 2013-2032

Table 12: Europe Market Value (US$ Mn) and Volume (Tons) Forecast by Application, 2013-2032

Table 13: Europe Market Value (US$ Mn) and Volume (Tons) Forecast by End Use, 2013-2032

Table 14: South Asia & Pacific Market Volume (Tons) & Value (US$ Mn) Forecast by Country,2013-2032

Table 15: South Asia & Pacific Market Value (US$ Mn) and Volume (Tons) Forecast by Application, 2013-2032

Table 16: South Asia & Pacific Market Value (US$ Mn) and Volume (Tons) Forecast by End Use, 2013-2032

Table 17: East Asia Market Volume (Tons) & Value (US$ Mn) Forecast by Country, 2013-2032

Table 18: East Asia Market Value (US$ Mn) and Volume (Tons) Forecast by Application, 2013-2032

Table 19: East Asia Market Value (US$ Mn) and Volume (Tons) Forecast by End Use, 2013-2032

Table 20: Middle East & Africa Market Volume (Tons) & Value (US$ Mn) Forecast by Country, 2013-2032

Table 21: Middle East and Africa Market Value (US$ Mn) and Volume (Tons) Forecast by Application, 2013-2032

Table 22: Middle East and Africa Market Value (US$ Mn) and Volume (Tons) Forecast by End Use, 2013-2032
Nikhil Kaitwade
Principal Consultant
LinkedIn
Talk to Analyst

Find your sweet spots for generating winning opportunities in this market.

Talk to Analyst

List of Charts

Figure 01: Global Historical Market Volume (Tons) Analysis, 2013-2021

Figure 02: Global Current and Future Market Volume (Tons) Analysis, 2022-2032

Figure 03: Global Historical Value (US$ Mn), 2013-2021

Figure 04: Global Value (US$ Mn) Forecast, 2022 – 2032

Figure 05: Global Market Absolute $ Opportunity, 2013 to 2022 and 2032

Figure 06: Global Market Share and BPS Analysis by Application– 2022 and 2032

Figure 07: Global Market Y-o-Y Growth Projections by Application, 2021-2032

Figure 08: Global Market Attractiveness Index by Application, 2022 and 2032

Figure 09: Market Absolute $ Opportunity by Fabric/ Textile Application Segment, 2013-2021 and 2022-2032

Figure 10: Market Absolute $ Opportunity by Paints and Coatings Segment, 2013-2021 and 2022-2032

Figure 11: Market Absolute $ Opportunity by Inks Segment, 2013-2021 and 2022-2032

Figure 12: Market Absolute $ Opportunity by Paper Segment, 2013-2021 and 2022-2032

Figure 13: Market Absolute $ Opportunity by Plastic Segment, 2013-2021 and 2022-2032

Figure 14: Market Absolute $ Opportunity by Silicone & Rubber Segment, 2013-2021 and 2022-2032

Figure 15: Global Market Share and BPS Analysis by End Use– 2022 and 2032

Figure 16: Global Market Y-o-Y Growth Projections by End Use, 2021-2032

Figure 17: Global Market Attractiveness Index by End Use, 2022 and 2032

Figure 18: Market Absolute $ Opportunity by Automotive Segment, 2013-2021 and 2022-2032

Figure 19: Market Absolute $ Opportunity by Building & Construction Segment, 2013-2021 and 2022-2032

Figure 20: Market Absolute $ Opportunity by Electronics Segment, 2013-2021 and 2022-2032

Figure 21: Market Absolute $ Opportunity by Food and Beverage Segment, 2013-2021 and 2022-2032

Figure 22: Market Absolute $ Opportunity by Healthcare Segment, 2013-2021 and 2022-2032

Figure 23: Market Absolute $ Opportunity by Others Segment, 2013-2021 and 2022-2032

Figure 24: Global Market Share and BPS Analysis by Region– 2022 and 2032

Figure 25: Global Market Y-o-Y Growth Projections by Region, 2021-2032

Figure 26: Global Market Attractiveness Index by Region, 2022 and 2032

Figure 27: Market Absolute $ Opportunity by North America, 2013-2021 and 2022 – 2032

Figure 28: Market Absolute $ Opportunity by Latin America, 2013-2021 and 2022 – 2032

Figure 29: Market Absolute $ Opportunity by Europe Region, 2013-2021 and 2022 – 2032

Figure 30: Market Absolute $ Opportunity by East Asia Region, 2013-2021 and 2022 – 2032

Figure 31: Market Absolute $ Opportunity by South Asia Pacific Region, 2013-2021 and 2022 – 2032

Figure 32: Market Absolute $ Opportunity by Middle East & Africa Region, 2013-2021 and 2022 – 2032

Figure 33: North America Market BPS Analysis by Country– 2022 & 2032

Figure 34: North America Market Y-o-Y Growth by Country, 2021– 2032

Figure 35: North America Market Attractiveness Analysis by Country, 2022– 2032

Figure 36: North America Market Share and BPS Analysis by Application– 2022 and 2032

Figure 37: North America Market Y-o-Y Growth Projections by Application, 2021-2032

Figure 38: North America Market Attractiveness Index by Application, 2022 and 2032

Figure 39: North America Market Share and BPS Analysis by End Use– 2022 and 2032

Figure 40: North America Market Y-o-Y Growth Projections by End Use, 2021-2032

Figure 41: North America Market Attractiveness Index by End Use, 2022 and 2032

Figure 42: Latin America Market BPS Analysis by Country– 2022 & 2032

Figure 43: Latin America Market Y-o-Y Growth by Country, 2021– 2032

Figure 44: Latin America Market Attractiveness Analysis by Country, 2022– 2032

Figure 45: Latin America Market Share and BPS Analysis by Application– 2022 and 2032

Figure 46: Latin America Market Y-o-Y Growth Projections by Application, 2021-2032

Figure 47: Latin America Market Attractiveness Index by Application, 2022 and 2032

Figure 48: Latin America Market Share and BPS Analysis by End Use– 2022 and 2032

Figure 49: Latin America Market Y-o-Y Growth Projections by End Use, 2021-2032

Figure 50: Latin America Market Attractiveness Index by End Use, 2022 and 2032

Figure 51: Europe Market BPS Analysis by Country– 2022 & 2032

Figure 52: Europe Market Y-o-Y Growth by Country, 2021– 2032

Figure 53: Europe Market Attractiveness Analysis by Country, 2022– 2032

Figure 54: Europe Market Share and BPS Analysis by Application– 2022 and 2032

Figure 55: Europe Market Y-o-Y Growth Projections by Application, 2021-2032

Figure 56: Europe Market Attractiveness Index by Application, 2022 and 2032

Figure 57: Europe Market Share and BPS Analysis by End Use– 2022 and 2032

Figure 58: Europe Market Y-o-Y Growth Projections by End Use, 2021-2032

Figure 59: Europe Market Attractiveness Index by End Use, 2022 and 2032

Figure 60: South Asia & Pacific Market BPS Analysis by Country– 2022 & 2032

Figure 61: South Asia & Pacific Market Y-o-Y Growth by Country, 2021– 2032

Figure 62: South Asia & Pacific Market Attractiveness Analysis by Country, 2022– 2032

Figure 63: South Asia & Pacific Market Share and BPS Analysis by Application– 2022 and 2032

Figure 64: South Asia & Pacific Market Y-o-Y Growth Projections by Application, 2021-2032

Figure 65: South Asia & Pacific Market Attractiveness Index by Application, 2022 and 2032

Figure 66: South Asia & Pacific Market Share and BPS Analysis by End Use– 2022 and 2032

Figure 67: South Asia & Pacific Market Y-o-Y Growth Projections by End Use, 2021-2032

Figure 68: South Asia & Pacific Market Attractiveness Index by End Use, 2022 and 2032

Figure 69: East Asia Market BPS Analysis by Country– 2022 & 2032

Figure 70: East Asia Market Y-o-Y Growth by Country, 2021– 2032

Figure 71: East Asia Market Attractiveness Analysis by Country, 2022– 2032

Figure 72: East Asia Market Share and BPS Analysis by Application– 2022 and 2032

Figure 73: East Asia Market Y-o-Y Growth Projections by Application, 2021-2032

Figure 74: East Asia Market Attractiveness Index by Application, 2022 and 2032

Figure 75: East Asia Market Share and BPS Analysis by End Use– 2022 and 2032

Figure 76: East Asia Market Y-o-Y Growth Projections by End Use, 2021-2032

Figure 77: East Asia Market Attractiveness Index by End Use, 2022 and 2032

Figure 78: Middle East & Africa Market BPS Analysis by Country– 2022 & 2032

Figure 79: Middle East & Africa Market Y-o-Y Growth by Country, 2021– 2032

Figure 80: Middle East & Africa Market Attractiveness Analysis by Country, 2022– 2032

Figure 81: Middle East and Africa Market Share and BPS Analysis by Application– 2022 and 2032

Figure 82: Middle East and Africa Market Y-o-Y Growth Projections by Application, 2021-2032

Figure 83: Middle East and Africa Market Attractiveness Index by Application, 2022 and 2032

Figure 84: Middle East and Africa Market Share and BPS Analysis by End Use– 2022 and 2032

Figure 85: Middle East and Africa Market Y-o-Y Growth Projections by End Use, 2021-2032

Figure 86: Middle East and Africa Market Attractiveness Index by End Use, 2022 and 2032

Need specific information?

Request Customization

Explore Chemicals & Materials Insights

View Reports

Recommendations

Chemicals & Materials

Aluminum Chemicals Market

Published : February 2022

Chemicals & Materials

Membrane Chemicals Market

Published : March 2021

Chemicals & Materials

Mining Flotation Chemicals Market

Published : April 2016

Google translate

Antimicrobial Additives Market