Antimicrobial Packaging Ingredients for Food Packaging Market Size and Share Forecast Outlook 2025 to 2035

The global Antimicrobial Packaging Ingredients for Food Packaging market is forecast to reach USD 3,056.8 million in 2025 and grow to USD 4,657.0 million by 2035, registering a CAGR of 4.3% during the period.
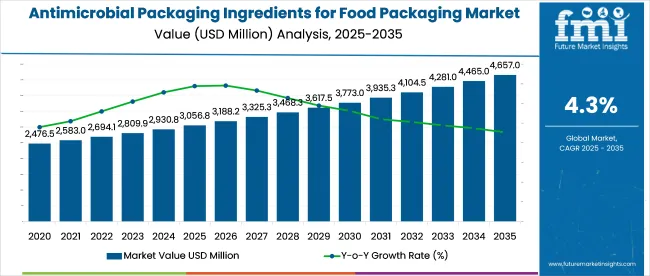
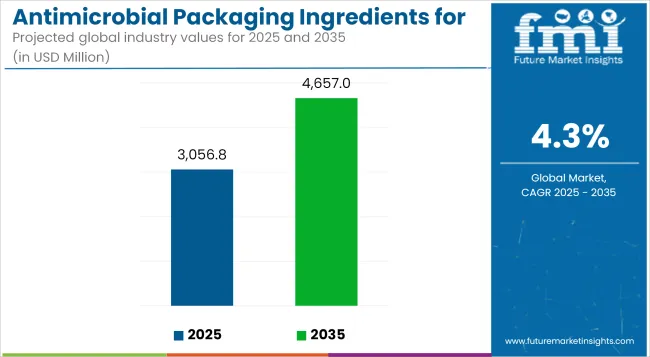
Quick Stats for Antimicrobial Packaging Ingredients for Food Packaging Market

  • Largest Ingredient by Share (2025): Organic Acids - 29%
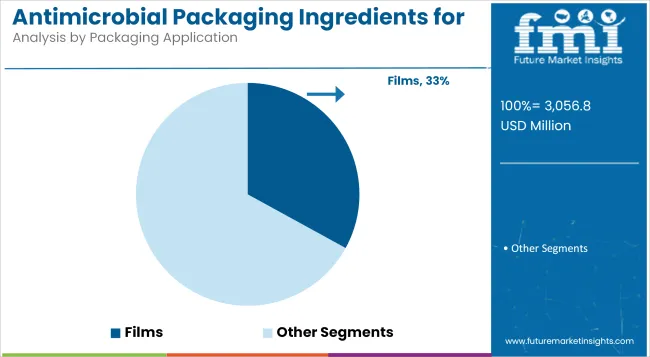
  • Top Packaging Application (2025): Films - 33%
  • Leading Technology (2025): Active Packaging - 61%
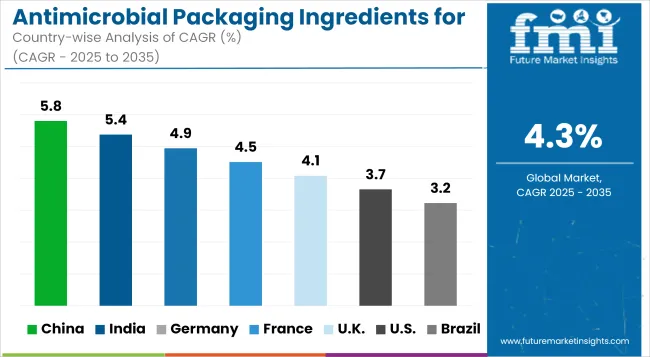
  • Most Lucrative Market (2025): China - CAGR 5.8%
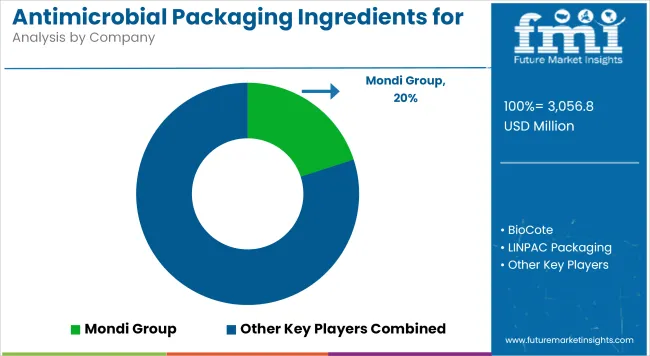
  • Top Company by Share (2025): Mondi Group - 20%

Antimicrobial Packaging Ingredients For Food Packaging Market

Attribute Detail
Market Size (2025) USD 3,056.8 million
Market Size (2035) USD 4,657.0 million
CAGR (2025 to 2035) 4.3%

Growth is being driven by the increasing need to extend food shelf life, reduce microbial contamination, and comply with evolving food safety regulations across key economies. In 2025, this market will represent approximately 2.1% of the broader food packaging industry, which continues to prioritize freshness-retention and spoilage-prevention functionalities.

Market expansion is supported by strong demand for extended shelf-life packaging across perishable food categories, with antimicrobial films gaining traction due to ease of integration into existing production lines. Regulatory alignment with global food safety standards, particularly in the EU and China, has created a compliance-driven push for embedded antimicrobial ingredients.

However, growth is tempered by high cost premiums on bio-based or functional additives, which can inflate packaging unit costs by 12-18%, limiting adoption among mid-tier food processors. Technical challenges around material compatibility and migration testing also continue to slow scalability in developing economies.

Antimicrobial Packaging Ingredients for Food Packaging Market by Top Investment Segments

The Antimicrobial Packaging Ingredients for Food Packaging market is segmented into organic acids; bacteriocins; essential oils; enzymes; metal ions & oxidizers; and others by antimicrobial ingredient; controlled release packaging and active packaging by technology; pouches; cartons; trays; bags; films; and cups & lids by packaging applications; food & beverage; cosmetics & personal care; consumer electronics; and healthcare by end use; North America; Latin America; Western Europe; Eastern Europe; South Asia and Pacific; East Asia; and Middle East & Africa by region.
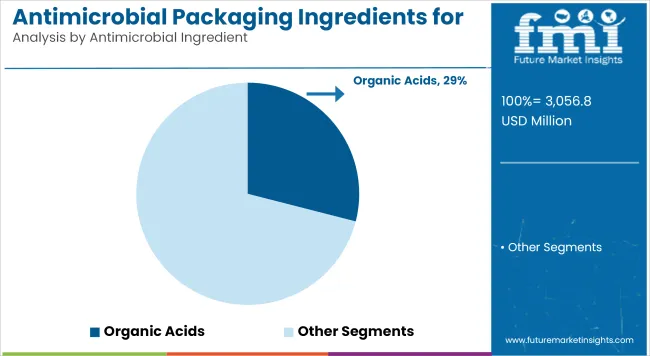
By Antimicrobial Ingredient, Organic Acid will Hold Leading Share

Antimicrobial Packaging Ingredients For Food Packaging Market By Antrimivrobal Ingredient

Organic acids will lead in 2025 with a 29.1% share, driven by their wide regulatory acceptance and broad-spectrum activity across dairy, meat, and ready-to-eat food packaging. Their low migration rates and effectiveness at lower concentrations give them a clear margin advantage, especially in film-based formats.

Growth is supported by two factors

  • Iincreased adoption of bio-based packaging in North America and Europe, where organic acids are preferred for safety compliance
  • Their stability across temperature variations, reducing product returns and waste by 11-14%.

However, essential oils are emerging as a potential disruptor. With a CAGR of 4.9% over 2025 to 2035, their penetration is improving in premium segments, especially for active packaging in fresh produce. Their volatility remains a limitation, but microencapsulation tech could raise adoption and offset loss rates.
  • Organic acids: 29.1% share in 2025; favored for dairy and meat applications (FMI, 2025)

By Technology - Active Packaging to Lead Through 2035

Antimicrobial Packaging Ingredients For Food Packaging Market By Technology

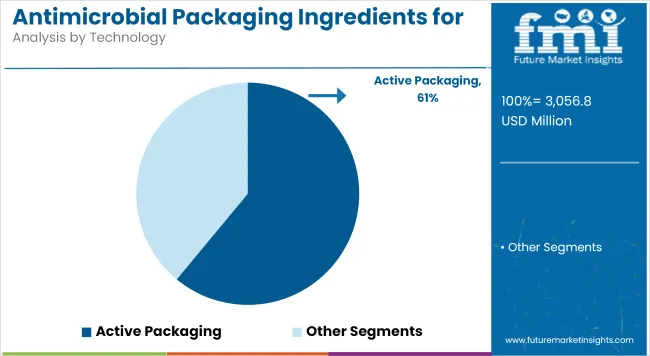
Active packaging will dominate the technology segment in 2025, accounting for 61.2% of total market value. Its leadership stems from superior compatibility with antimicrobial films, bags, and trays used for fresh-cut produce, bakery, and dairy categories. The integration of antimicrobial agents directly into packaging layers extends shelf life by up to 30%, driving adoption in short-cycle food supply chains.

Two primary forces sustain this lead

  • Increased compliance demand under EU 450/2009 regulations for food contact materials, where active systems meet functional barrier standards
  • Logistics optimization, where retailers cite up to 15% reduction in spoilage losses with embedded active formats.

Controlled release packaging is lagging in share, currently at 38.8%, but is gaining visibility in export packaging. It’s particularly suited for long-haul chilled meat and seafood, though slower commercial rollouts in Asia-Pacific restrain uptake.
  • Active packaging: 61.2% share in 2025; 30% longer shelf-life in dairy (FMI, 2025)

By Packaging Application - Films to Lead Through 2035

Antimicrobial Packaging Ingredients For Food Packaging Market By Packaging Application

Films will lead the packaging application segment with a 33.1% share in 2025. Their dominance is tied to widespread use in both flexible and rigid formats across high-turnover food categories such as bakery, dairy, and fresh produce. Films allow seamless embedding of antimicrobial ingredients, with low material disruption and scalable printability-key for high-speed FMCG operations.

Two structural levers underpin growth

  • Global uptick in single-serve and portion-controlled food units, where antimicrobial films prevent surface contamination during handling and transit
  • Improved recyclability of coated films, which boosts regulatory approval and retailer preference in the EU and Japan.

However, trays and pouches are gaining share in chilled meat and ready-to-eat segments. These formats offer deeper cavity protection and controlled gas exchange, enabling antimicrobial integration for high-protein, short-shelf-life SKUs.
  • Films: 33.1% share in 2025; preferred in bakery and produce packaging (FMI, 2025)

Country-wise Outlook - Performance to Vary Widely by Regulatory Push and Tech Adoption

Growth trajectories for Antimicrobial Packaging Ingredients for Food Packaging diverge sharply across key markets, shaped by national food safety mandates, local processing scale, and innovation uptake in packaging tech.

In the United States, growth will be steady as FDA-compliant antimicrobial packaging gains traction in large-scale food processors. High consumer awareness of foodborne risks, along with tech-forward adoption in meat and produce categories, sustains demand.

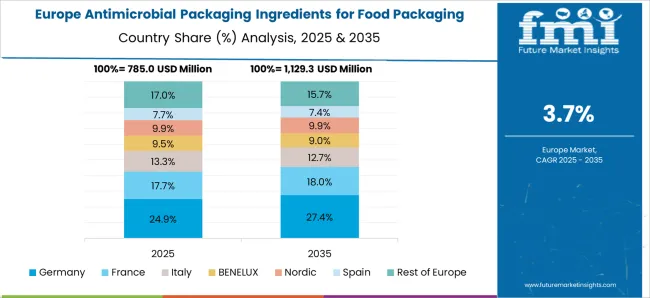
China is set to lead global growth, driven by its dual mandate of food waste reduction and hygiene enforcement post-pandemic. Local manufacturers are scaling active packaging faster than peers, aided by provincial subsidies on functional packaging lines. Germany and France will maintain a regulatory-led pace, where EU alignment on migration limits and clean-label packaging favors organic acids and essential oils. However, SME adoption remains uneven due to cost hurdles.

The UK market is adapting slower post-Brexit, with delayed regulatory harmonization and fragmented retailer guidelines, though niche innovations in pouches and trays are emerging in chilled and organic foods. Japan shows stable growth anchored in high retail hygiene standards and R&D-backed tech collaborations, especially in antimicrobial films for convenience and ready-meal packaging.
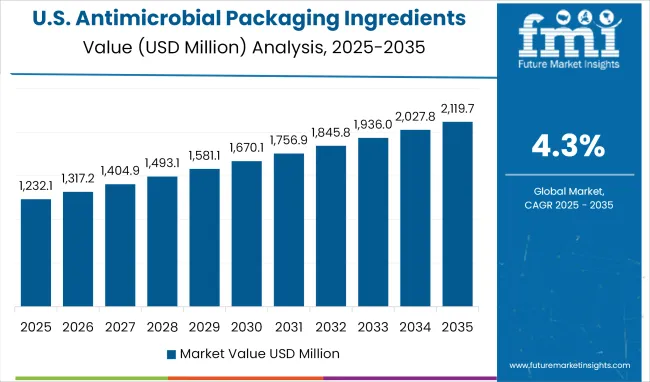
United States - Scale-Driven Adoption in a Highly Regulated Food System

The USA Antimicrobial Packaging Ingredients for Food Packaging market is projected to reach USD 792.6 million in 2025 and USD 1,169.5 million by 2035, registering a CAGR of 4.0%. Growth remains tied to institutional demand from meat and dairy processors operating under USDA and FDA mandates for microbial safety.

Margins are protected by vertical integration among major players and high-volume adoption of active packaging. However, uptake among mid-size processors is constrained by testing costs-antimicrobial packaging adds 10-14% to unit cost.

Federal grants under FSMA Section 204 have supported digitized traceability pilots that indirectly favor antimicrobial packaging. Consumer surveys (USDA, 2025) show 63% of shoppers associate antimicrobial labels with freshness and hygiene.

  • FSMA-driven investment in food traceability tech
  • 63% of consumers link antimicrobials to hygiene
  • 10-14% cost premium a barrier for mid-scale processors

United Kingdom - Fragmented Regulation Slows Post-Brexit Momentum

The UK market is valued at USD 188.1 million in 2025 and will grow to USD 277.2 million by 2035, expanding at a 4.0% CAGR. Post-Brexit divergence in safety standards has slowed rollout among small and mid-sized packaging firms.

Although chilled meats and dairy dominate application areas, testing and dual-standard compliance inflate costs by 7.4%. Retailer demand is inconsistent, further delaying large-scale adoption.

FSA guidance on antimicrobial migration is advisory, not enforceable, creating hesitation in investment. BRC reports show 44% of private-label food brands delaying adoption until after 2027.

  • Brexit causes dual-standard friction in packaging
  • 7.4% rise in unit cost for antimicrobial variants
  • 44% of brands delaying investment until clarity

France - Regulatory Backing Drives Uptake in Retail Chains

France’s market is expected to hit USD 213.7 million in 2025 and USD 316.9 million by 2035, with a CAGR of 4.1%. Regulatory alignment with EU migration and safety directives makes France a high-compliance market, favoring ingredients like organic acids and essential oils.

Antimicrobial films have gained traction in cheese, salad, and bakery chains. INRAE trials showed spoilage cuts of up to 26%-prompting chain-wide deployment by 2026.

Still, artisanal producers show resistance due to margin constraints and limited technical expertise. National grants for circular packaging exclude many antimicrobial solutions, adding friction.
  • INRAE study: 26% spoilage drop in packaged salad
  • Chain retailers rapidly scaling antimicrobial films
  • Limited SME participation due to cost and grant exclusion

Germany - Compliance-First Market with Controlled Rollout

Germany’s market stands at USD 237.5 million in 2025, reaching USD 353.6 million by 2035, with a CAGR of 4.1%. Food-grade antimicrobials are widely accepted under EU law, especially in meat, deli, and dairy applications.

Retailers lead demand, but implementation across supply chains remains cautious. Strict testing under BfR and EFSA rules elongates time-to-market, slowing innovation cycles for smaller packaging converters.

Consumer trust remains high: over 70% of surveyed shoppers express confidence in antimicrobial-labeled packaging. However, technical interoperability with recycling systems remains a minor drag.

  • 70% consumer trust in labeled antimicrobial packs
  • Regulatory testing slows SME rollouts
  • High adoption in dairy, cured meats, and salads

Japan - Retail Hygiene Culture Enables Steady Uptake

Japan’s market is estimated at USD 192.0 million in 2025 and projected to reach USD 284.8 million by 2035, expanding at a 4.0% CAGR. Growth is powered by urban convenience chains and strong retail hygiene mandates.

Antimicrobial films are used across bento, chilled noodles, and bakery items. R&D partnerships between packaging firms and food majors continue to drive innovation in active packaging with precision-dose antimicrobial delivery.

Cost sensitivity is minimal in high-end formats, though rollout in mid-tier supermarkets remains cautious. Consumer awareness campaigns by Japan Packaging Institute show 61% recognition of antimicrobial labeling by 2025.
  • Strong uptake in convenience store chilled foods
  • R&D-led packaging innovation in food majors
  • 61% consumer recognition of antimicrobial labels

Antimicrobial Packaging Ingredients for Food Packaging for Food Packaging Market Players

Antimicrobial Packaging Ingredients For Food Packaging Market By Company

The players in the Antimicrobial Packaging Ingredients for Food Packaging market are focusing on ingredient-function integration and scalable active packaging formats to meet evolving safety mandates and shelf-life demands. Mondi Group, BioCote, and LINPAC Packaging have expanded their antimicrobial portfolios through vertical integration and cross-sector collaborations with food processors and packaging machinery manufacturers.

Mondi Group holds a leading position, with an estimated 20% share in 2025, driven by its antimicrobial film lines tailored for dairy, bakery, and produce. BioCote has strengthened its additive business by partnering with packaging OEMs across North America and Europe. LINPAC Packaging’s focus on ready-meal and meat trays with built-in antimicrobial layers has helped it secure contracts with Tier-1 European retailers.

Market expansion is also supported by regional players such as Uflex Ltd. and Coveris Holdings S.A., who are developing controlled-release solutions for emerging Asian markets. Regulatory tightening in China and the EU has pushed Reynolds Group and Dunmore Corporation to invest in migration-tested antimicrobial barrier coatings.

Over 2025 to 2028, companies that can demonstrate EU-compliant antimicrobial efficacy and recyclability will gain faster traction. Players lacking in-house R&D or regulatory testing capabilities risk being marginalized.

Report Scope

Metric Details
Market Name Antimicrobial Packaging Ingredients for Food Packaging for Food Packaging Market
Base Year 2024
Forecast Period 2025 to 2035
2025 Market Size USD 3,056.8 million
2035 Market Size USD 4,657.0 million
CAGR (2025-2035) 4.3%
Units Revenue (USD Million)
Segments Covered Antimicrobial Ingredient, Technology, Packaging Application, End Use, Region
Antimicrobial Ingredient Organic Acids, Bacteriocins, Essential Oils, Enzymes, Metal Ions & Oxidizers, Others
Technology Active Packaging, Controlled Release Packaging
Packaging Application Pouches, Cartons, Trays, Bags, Films, Cups & Lids
End Use Food & Beverage, Cosmetics & Personal Care, Consumer Electronics, Healthcare
Regions Covered North America, Latin America, Western Europe, Eastern Europe, South Asia & Pacific, East Asia, Middle East & Africa
Key Countries United States, United Kingdom, France, Germany, Japan, China, South Korea, India
Top Companies Mondi Group, BioCote, LINPAC Packaging, Reynolds Group, Dunmore Corporation, Uflex Ltd., Coveris Holdings S.A., PacMoore Products Inc., B&G Products Ltd., ALUF Plastic Inc., Hexis S.A., WestRock Company

Key Segments

By Antimicrobial Ingredient:

  • Organic Acids
  • Bacteriocins
  • Essential Oils
  • Enzymes
  • Metal Ions & Oxidizers
  • Others

By Technology:

  • Controlled Release Packaging
  • Active Packaging

By Packaging Applications:

  • Pouches
  • Cartons
  • Trays
  • Bags
  • Films
  • Cups & Lids

By End Use:

  • Food & Beverage
  • Cosmetics & Personal Care
  • Consumer Electronics
  • Healthcare

By Region:

  • North America
  • Latin America
  • Europe
  • East Asia
  • South Asia
  • Oceania
  • The Middle East & Africa

Table of Content

  1. Executive Summary
    • Global Market Outlook
    • Demand-side Trends
    • Supply-side Trends
    • Technology Roadmap Analysis
    • Analysis and Recommendations
  2. Market Overview
    • Market Coverage/Taxonomy
    • Market Definition/Scope/Limitations
  3. Market Background
    • Market Dynamics
      • Drivers
      • Restraints
      • Opportunity
      • Trends
    • Scenario Forecast
      • Demand in Optimistic Scenario
      • Demand in Likely Scenario
      • Demand in Conservative Scenario
    • Opportunity Map Analysis
    • Product Life Cycle Analysis
    • Supply Chain Analysis
      • Supply Side Participants and their Roles
        • Producers
        • Mid-Level Participants (Traders/ Agents/ Brokers)
        • Wholesalers and Distributors
      • Value Added and Value Created at Node in the Supply Chain
      • List of Raw Material Suppliers
      • List of Existing and Potential Buyer’s
    • Investment Feasibility Matrix
    • Value Chain Analysis
      • Profit Margin Analysis
      • Wholesalers and Distributors
      • Retailers
    • PESTLE and Porter’s Analysis
    • Regulatory Landscape
      • By Key Regions
      • By Key Countries
    • Regional Parent Market Outlook
    • Production and Consumption Statistics
    • Import and Export Statistics
  4. Global Market Analysis 2020 to 2024 and Forecast, 2025 to 2035
    • Historical Market Size Value (USD Million) & Volume (Metric Tons) Analysis, 2020 to 2024
    • Current and Future Market Size Value (USD Million) & Volume (Metric Tons) Projections, 2025 to 2035
      • Y-o-Y Growth Trend Analysis
      • Absolute $ Opportunity Analysis
  5. Global Market Pricing Analysis 2020 to 2024 and Forecast 2025 to 2035
  6. Global Market Analysis 2020 to 2024 and Forecast 2025 to 2035, By Antimicrobial Ingredient
    • Introduction/Key Findings
    • Historical Market Size Value (USD Million) & Volume (Metric Tons) Analysis By Antimicrobial Ingredient, 2020 to 2024
    • Current and Future Market Size Value (USD Million) & Volume (Metric Tons) Analysis and Forecast By Antimicrobial Ingredient, 2025 to 2035
      • Organic Acids
      • Bacteriocins
      • Essential Oils
      • Enzymes
      • Metal Ions & Oxidizers
      • Others
    • Y-o-Y Growth Trend Analysis By Antimicrobial Ingredient, 2020 to 2024
    • Absolute $ Opportunity Analysis By Antimicrobial Ingredient, 2025 to 2035
  7. Global Market Analysis 2020 to 2024 and Forecast 2025 to 2035, By Technology
    • Introduction/Key Findings
    • Historical Market Size Value (USD Million) & Volume (Metric Tons) Analysis By Technology, 2020 to 2024
    • Current and Future Market Size Value (USD Million) & Volume (Metric Tons) Analysis and Forecast By Technology, 2025 to 2035
      • Controlled Release Packaging
      • Active Packaging
    • Y-o-Y Growth Trend Analysis By Technology, 2020 to 2024
    • Absolute $ Opportunity Analysis By Technology, 2025 to 2035
  8. Global Market Analysis 2020 to 2024 and Forecast 2025 to 2035, By Packaging Applications
    • Introduction/Key Findings
    • Historical Market Size Value (USD Million) & Volume (Metric Tons) Analysis By Packaging Applications, 2020 to 2024
    • Current and Future Market Size Value (USD Million) & Volume (Metric Tons) Analysis and Forecast By Packaging Applications, 2025 to 2035
      • Pouches
      • Cartons
      • Trays
      • Bags
      • Films
      • Cups & Lids
    • Y-o-Y Growth Trend Analysis By Packaging Applications, 2020 to 2024
    • Absolute $ Opportunity Analysis By Packaging Applications, 2025 to 2035
  9. Global Market Analysis 2020 to 2024 and Forecast 2025 to 2035, By End Use
    • Introduction/Key Findings
    • Historical Market Size Value (USD Million) & Volume (Metric Tons) Analysis By End Use, 2020 to 2024
    • Current and Future Market Size Value (USD Million) & Volume (Metric Tons) Analysis and Forecast By End Use, 2025 to 2035
      • Food & Beverage
      • Cosmetics & Personal Care
      • Consumer Electronics
      • Healthcare
    • Y-o-Y Growth Trend Analysis By End Use, 2020 to 2024
    • Absolute $ Opportunity Analysis By End Use, 2025 to 2035
  10. Global Market Analysis 2020 to 2024 and Forecast 2025 to 2035, By Region
    • Introduction
    • Historical Market Size Value (USD Million) & Volume (Metric Tons) Analysis By Region, 2020 to 2024
    • Current Market Size Value (USD Million) & Volume (Metric Tons) Analysis and Forecast By Region, 2025 to 2035
      • North America
      • Latin America
      • Western Europe
      • Eastern Europe
      • East Asia
      • South Asia & Pacific
      • Middle East and Africa
    • Market Attractiveness Analysis By Region
  11. North America Market Analysis 2020 to 2024 and Forecast 2025 to 2035, By Country
    • Historical Market Size Value (USD Million) & Volume (Metric Tons) Trend Analysis By Market Taxonomy, 2020 to 2024
    • Market Size Value (USD Million) & Volume (Metric Tons) Forecast By Market Taxonomy, 2025 to 2035
      • By Country
        • USA
        • Canada
        • Mexico
      • By Antimicrobial Ingredient
      • By Technology
      • By Packaging Applications
      • By End Use
    • Market Attractiveness Analysis
      • By Country
      • By Antimicrobial Ingredient
      • By Technology
      • By Packaging Applications
      • By End Use
    • Key Takeaways
  12. Latin America Market Analysis 2020 to 2024 and Forecast 2025 to 2035, By Country
    • Historical Market Size Value (USD Million) & Volume (Metric Tons) Trend Analysis By Market Taxonomy, 2020 to 2024
    • Market Size Value (USD Million) & Volume (Metric Tons) Forecast By Market Taxonomy, 2025 to 2035
      • By Country
        • Brazil
        • Argentina
        • Rest of LATAM
      • By Antimicrobial Ingredient
      • By Technology
      • By Packaging Applications
      • By End Use
    • Market Attractiveness Analysis
      • By Country
      • By Antimicrobial Ingredient
      • By Technology
      • By Packaging Applications
      • By End Use
    • Key Takeaways
  13. Western Europe Market Analysis 2020 to 2024 and Forecast 2025 to 2035, By Country
    • Historical Market Size Value (USD Million) & Volume (Metric Tons) Trend Analysis By Market Taxonomy, 2020 to 2024
    • Market Size Value (USD Million) & Volume (Metric Tons) Forecast By Market Taxonomy, 2025 to 2035
      • By Country
        • Germany
        • Italy
        • France
        • UK
        • Spain
        • BENELUX
        • Nordic
        • Rest of W.Europe
      • By Antimicrobial Ingredient
      • By Technology
      • By Packaging Applications
      • By End Use
    • Market Attractiveness Analysis
      • By Country
      • By Antimicrobial Ingredient
      • By Technology
      • By Packaging Applications
      • By End Use
    • Key Takeaways
  14. Eastern Europe Market Analysis 2020 to 2024 and Forecast 2025 to 2035, By Country
    • Historical Market Size Value (USD Million) & Volume (Metric Tons) Trend Analysis By Market Taxonomy, 2020 to 2024
    • Market Size Value (USD Million) & Volume (Metric Tons) Forecast By Market Taxonomy, 2025 to 2035
      • By Country
        • Russia
        • Hungary
        • Poland
        • Balkan & Baltics
        • Rest of E. Europe
      • By Antimicrobial Ingredient
      • By Technology
      • By Packaging Applications
      • By End Use
    • Market Attractiveness Analysis
      • By Country
      • By Antimicrobial Ingredient
      • By Technology
      • By Packaging Applications
      • By End Use
    • Key Takeaways
  15. East Asia Market Analysis 2020 to 2024 and Forecast 2025 to 2035, By Country
    • Historical Market Size Value (USD Million) & Volume (Metric Tons) Trend Analysis By Market Taxonomy, 2020 to 2024
    • Market Size Value (USD Million) & Volume (Metric Tons) Forecast By Market Taxonomy, 2025 to 2035
      • By Country
        • China
        • Japan
        • South Korea
      • By Antimicrobial Ingredient
      • By Technology
      • By Packaging Applications
      • By End Use
    • Market Attractiveness Analysis
      • By Country
      • By Antimicrobial Ingredient
      • By Technology
      • By Packaging Applications
      • By End Use
    • Key Takeaways
  16. South Asia & Pacific Market Analysis 2020 to 2024 and Forecast 2025 to 2035, By Country
    • Historical Market Size Value (USD Million) & Volume (Metric Tons) Trend Analysis By Market Taxonomy, 2020 to 2024
    • Market Size Value (USD Million) & Volume (Metric Tons) Forecast By Market Taxonomy, 2025 to 2035
      • By Country
        • India
        • Australia & New Zealand
        • ASEAN
        • Rest of SAP
      • By Antimicrobial Ingredient
      • By Technology
      • By Packaging Applications
      • By End Use
    • Market Attractiveness Analysis
      • By Country
      • By Antimicrobial Ingredient
      • By Technology
      • By Packaging Applications
      • By End Use
    • Key Takeaways
  17. Middle East and Africa Market Analysis 2020 to 2024 and Forecast 2025 to 2035, By Country
    • Historical Market Size Value (USD Million) & Volume (Metric Tons) Trend Analysis By Market Taxonomy, 2020 to 2024
    • Market Size Value (USD Million) & Volume (Metric Tons) Forecast By Market Taxonomy, 2025 to 2035
      • By Country
        • GCC Countries
        • Northern Africa
        • South Africa
        • Turkiye
        • Rest of MEA
      • By Antimicrobial Ingredient
      • By Technology
      • By Packaging Applications
      • By End Use
    • Market Attractiveness Analysis
      • By Country
      • By Antimicrobial Ingredient
      • By Technology
      • By Packaging Applications
      • By End Use
    • Key Takeaways
  18. Key Countries Market Analysis
    • USA
      • Pricing Analysis
      • Market Share Analysis, 2024
        • By Antimicrobial Ingredient
        • By Technology
        • By Packaging Applications
        • By End Use
    • Canada
      • Pricing Analysis
      • Market Share Analysis, 2024
        • By Antimicrobial Ingredient
        • By Technology
        • By Packaging Applications
        • By End Use
    • Brazil
      • Pricing Analysis
      • Market Share Analysis, 2024
        • By Antimicrobial Ingredient
        • By Technology
        • By Packaging Applications
        • By End Use
    • Mexico
      • Pricing Analysis
      • Market Share Analysis, 2024
        • By Antimicrobial Ingredient
        • By Technology
        • By Packaging Applications
        • By End Use
    • Argentina
      • Pricing Analysis
      • Market Share Analysis, 2024
        • By Antimicrobial Ingredient
        • By Technology
        • By Packaging Applications
        • By End Use
  19. Market Structure Analysis
    • Competition Dashboard
    • Competition Benchmarking
    • Market Share Analysis of Top Players
      • By Regional
      • By Antimicrobial Ingredient
      • By Technology
      • By Packaging Applications
      • By End Use
  20. Competition Analysis
    • Competition Deep Dive
      • Mondi Group
        • Overview
        • Product Portfolio
        • Profitability by Market Segments (Product/Age /Sales Channel/Region)
        • Sales Footprint
        • Strategy Overview
          • Marketing Strategy
          • Product Strategy
          • Channel Strategy
      • BioCote
        • Overview
        • Product Portfolio
        • Profitability by Market Segments (Product/Age /Sales Channel/Region)
        • Sales Footprint
        • Strategy Overview
          • Marketing Strategy
          • Product Strategy
          • Channel Strategy
      • LINPAC Packaging
        • Overview
        • Product Portfolio
        • Profitability by Market Segments (Product/Age /Sales Channel/Region)
        • Sales Footprint
        • Strategy Overview
          • Marketing Strategy
          • Product Strategy
          • Channel Strategy
      • Reynolds Group
        • Overview
        • Product Portfolio
        • Profitability by Market Segments (Product/Age /Sales Channel/Region)
        • Sales Footprint
        • Strategy Overview
          • Marketing Strategy
          • Product Strategy
          • Channel Strategy
      • Dunmore Corporation
        • Overview
        • Product Portfolio
        • Profitability by Market Segments (Product/Age /Sales Channel/Region)
        • Sales Footprint
        • Strategy Overview
          • Marketing Strategy
          • Product Strategy
          • Channel Strategy
      • Uflex Ltd.
        • Overview
        • Product Portfolio
        • Profitability by Market Segments (Product/Age /Sales Channel/Region)
        • Sales Footprint
        • Strategy Overview
          • Marketing Strategy
          • Product Strategy
          • Channel Strategy
      • Coveris Holdings S.A
        • Overview
        • Product Portfolio
        • Profitability by Market Segments (Product/Age /Sales Channel/Region)
        • Sales Footprint
        • Strategy Overview
          • Marketing Strategy
          • Product Strategy
          • Channel Strategy
      • PacMoore Products Inc.
        • Overview
        • Product Portfolio
        • Profitability by Market Segments (Product/Age /Sales Channel/Region)
        • Sales Footprint
        • Strategy Overview
          • Marketing Strategy
          • Product Strategy
          • Channel Strategy
      • B&G Products Ltd.
        • Overview
        • Product Portfolio
        • Profitability by Market Segments (Product/Age /Sales Channel/Region)
        • Sales Footprint
        • Strategy Overview
          • Marketing Strategy
          • Product Strategy
          • Channel Strategy
      • ALUF Plastic Inc.
        • Overview
        • Product Portfolio
        • Profitability by Market Segments (Product/Age /Sales Channel/Region)
        • Sales Footprint
        • Strategy Overview
          • Marketing Strategy
          • Product Strategy
          • Channel Strategy
      • Hexis S.A
        • Overview
        • Product Portfolio
        • Profitability by Market Segments (Product/Age /Sales Channel/Region)
        • Sales Footprint
        • Strategy Overview
          • Marketing Strategy
          • Product Strategy
          • Channel Strategy
      • WestRock Company
        • Overview
        • Product Portfolio
        • Profitability by Market Segments (Product/Age /Sales Channel/Region)
        • Sales Footprint
        • Strategy Overview
          • Marketing Strategy
          • Product Strategy
          • Channel Strategy
  21. Assumptions & Acronyms Used
  22. Research Methodology

List of Tables

  • Table 1: Global Market Value (USD Million) Forecast by Region, 2020-2035
  • Table 2: Global Market Volume (Metric Tons) Forecast by Region, 2020-2035
  • Table 3: Global Market Value (USD Million) Forecast by Antimicrobial Ingredient, 2020-2035
  • Table 4: Global Market Volume (Metric Tons) Forecast by Antimicrobial Ingredient, 2020-2035
  • Table 5: Global Market Value (USD Million) Forecast by Technology, 2020-2035
  • Table 6: Global Market Volume (Metric Tons) Forecast by Technology, 2020-2035
  • Table 7: Global Market Value (USD Million) Forecast by Packaging Applications, 2020-2035
  • Table 8: Global Market Volume (Metric Tons) Forecast by Packaging Applications, 2020-2035
  • Table 9: Global Market Value (USD Million) Forecast by End Use, 2020-2035
  • Table 10: Global Market Volume (Metric Tons) Forecast by End Use, 2020-2035
  • Table 11: North America Market Value (USD Million) Forecast by Country, 2020-2035
  • Table 12: North America Market Volume (Metric Tons) Forecast by Country, 2020-2035
  • Table 13: North America Market Value (USD Million) Forecast by Antimicrobial Ingredient, 2020-2035
  • Table 14: North America Market Volume (Metric Tons) Forecast by Antimicrobial Ingredient, 2020-2035
  • Table 15: North America Market Value (USD Million) Forecast by Technology, 2020-2035
  • Table 16: North America Market Volume (Metric Tons) Forecast by Technology, 2020-2035
  • Table 17: North America Market Value (USD Million) Forecast by Packaging Applications, 2020-2035
  • Table 18: North America Market Volume (Metric Tons) Forecast by Packaging Applications, 2020-2035
  • Table 19: North America Market Value (USD Million) Forecast by End Use, 2020-2035
  • Table 20: North America Market Volume (Metric Tons) Forecast by End Use, 2020-2035
  • Table 21: Latin America Market Value (USD Million) Forecast by Country, 2020-2035
  • Table 22: Latin America Market Volume (Metric Tons) Forecast by Country, 2020-2035
  • Table 23: Latin America Market Value (USD Million) Forecast by Antimicrobial Ingredient, 2020-2035
  • Table 24: Latin America Market Volume (Metric Tons) Forecast by Antimicrobial Ingredient, 2020-2035
  • Table 25: Latin America Market Value (USD Million) Forecast by Technology, 2020-2035
  • Table 26: Latin America Market Volume (Metric Tons) Forecast by Technology, 2020-2035
  • Table 27: Latin America Market Value (USD Million) Forecast by Packaging Applications, 2020-2035
  • Table 28: Latin America Market Volume (Metric Tons) Forecast by Packaging Applications, 2020-2035
  • Table 29: Latin America Market Value (USD Million) Forecast by End Use, 2020-2035
  • Table 30: Latin America Market Volume (Metric Tons) Forecast by End Use, 2020-2035
  • Table 31: Western Europe Market Value (USD Million) Forecast by Country, 2020-2035
  • Table 32: Western Europe Market Volume (Metric Tons) Forecast by Country, 2020-2035
  • Table 33: Western Europe Market Value (USD Million) Forecast by Antimicrobial Ingredient, 2020-2035
  • Table 34: Western Europe Market Volume (Metric Tons) Forecast by Antimicrobial Ingredient, 2020-2035
  • Table 35: Western Europe Market Value (USD Million) Forecast by Technology, 2020-2035
  • Table 36: Western Europe Market Volume (Metric Tons) Forecast by Technology, 2020-2035
  • Table 37: Western Europe Market Value (USD Million) Forecast by Packaging Applications, 2020-2035
  • Table 38: Western Europe Market Volume (Metric Tons) Forecast by Packaging Applications, 2020-2035
  • Table 39: Western Europe Market Value (USD Million) Forecast by End Use, 2020-2035
  • Table 40: Western Europe Market Volume (Metric Tons) Forecast by End Use, 2020-2035
  • Table 41: Eastern Europe Market Value (USD Million) Forecast by Country, 2020-2035
  • Table 42: Eastern Europe Market Volume (Metric Tons) Forecast by Country, 2020-2035
  • Table 43: Eastern Europe Market Value (USD Million) Forecast by Antimicrobial Ingredient, 2020-2035
  • Table 44: Eastern Europe Market Volume (Metric Tons) Forecast by Antimicrobial Ingredient, 2020-2035
  • Table 45: Eastern Europe Market Value (USD Million) Forecast by Technology, 2020-2035
  • Table 46: Eastern Europe Market Volume (Metric Tons) Forecast by Technology, 2020-2035
  • Table 47: Eastern Europe Market Value (USD Million) Forecast by Packaging Applications, 2020-2035
  • Table 48: Eastern Europe Market Volume (Metric Tons) Forecast by Packaging Applications, 2020-2035
  • Table 49: Eastern Europe Market Value (USD Million) Forecast by End Use, 2020-2035
  • Table 50: Eastern Europe Market Volume (Metric Tons) Forecast by End Use, 2020-2035
  • Table 51: East Asia Market Value (USD Million) Forecast by Country, 2020-2035
  • Table 52: East Asia Market Volume (Metric Tons) Forecast by Country, 2020-2035
  • Table 53: East Asia Market Value (USD Million) Forecast by Antimicrobial Ingredient, 2020-2035
  • Table 54: East Asia Market Volume (Metric Tons) Forecast by Antimicrobial Ingredient, 2020-2035
  • Table 55: East Asia Market Value (USD Million) Forecast by Technology, 2020-2035
  • Table 56: East Asia Market Volume (Metric Tons) Forecast by Technology, 2020-2035
  • Table 57: East Asia Market Value (USD Million) Forecast by Packaging Applications, 2020-2035
  • Table 58: East Asia Market Volume (Metric Tons) Forecast by Packaging Applications, 2020-2035
  • Table 59: East Asia Market Value (USD Million) Forecast by End Use, 2020-2035
  • Table 60: East Asia Market Volume (Metric Tons) Forecast by End Use, 2020-2035
  • Table 61: South Asia & Pacific Market Value (USD Million) Forecast by Country, 2020-2035
  • Table 62: South Asia & Pacific Market Volume (Metric Tons) Forecast by Country, 2020-2035
  • Table 63: South Asia & Pacific Market Value (USD Million) Forecast by Antimicrobial Ingredient, 2020-2035
  • Table 64: South Asia & Pacific Market Volume (Metric Tons) Forecast by Antimicrobial Ingredient, 2020-2035
  • Table 65: South Asia & Pacific Market Value (USD Million) Forecast by Technology, 2020-2035
  • Table 66: South Asia & Pacific Market Volume (Metric Tons) Forecast by Technology, 2020-2035
  • Table 67: South Asia & Pacific Market Value (USD Million) Forecast by Packaging Applications, 2020-2035
  • Table 68: South Asia & Pacific Market Volume (Metric Tons) Forecast by Packaging Applications, 2020-2035
  • Table 69: South Asia & Pacific Market Value (USD Million) Forecast by End Use, 2020-2035
  • Table 70: South Asia & Pacific Market Volume (Metric Tons) Forecast by End Use, 2020-2035
  • Table 71: Middle East and Africa Market Value (USD Million) Forecast by Country, 2020-2035
  • Table 72: Middle East and Africa Market Volume (Metric Tons) Forecast by Country, 2020-2035
  • Table 73: Middle East and Africa Market Value (USD Million) Forecast by Antimicrobial Ingredient, 2020-2035
  • Table 74: Middle East and Africa Market Volume (Metric Tons) Forecast by Antimicrobial Ingredient, 2020-2035
  • Table 75: Middle East and Africa Market Value (USD Million) Forecast by Technology, 2020-2035
  • Table 76: Middle East and Africa Market Volume (Metric Tons) Forecast by Technology, 2020-2035
  • Table 77: Middle East and Africa Market Value (USD Million) Forecast by Packaging Applications, 2020-2035
  • Table 78: Middle East and Africa Market Volume (Metric Tons) Forecast by Packaging Applications, 2020-2035
  • Table 79: Middle East and Africa Market Value (USD Million) Forecast by End Use, 2020-2035
  • Table 80: Middle East and Africa Market Volume (Metric Tons) Forecast by End Use, 2020-2035

List of Figures

  • Figure 1: Global Market Volume (Metric Tons) Forecast 2020-2035
  • Figure 2: Global Market Pricing Analysis
  • Figure 3: Global Market Value (USD Million) Forecast 2020-2035
  • Figure 4: Global Market Value Share and BPS Analysis by Antimicrobial Ingredient, 2025 and 2035
  • Figure 5: Global Market Y-o-Y Growth Comparison by Antimicrobial Ingredient, 2025-2035
  • Figure 6: Global Market Attractiveness Analysis by Antimicrobial Ingredient
  • Figure 7: Global Market Value Share and BPS Analysis by Technology, 2025 and 2035
  • Figure 8: Global Market Y-o-Y Growth Comparison by Technology, 2025-2035
  • Figure 9: Global Market Attractiveness Analysis by Technology
  • Figure 10: Global Market Value Share and BPS Analysis by Packaging Applications, 2025 and 2035
  • Figure 11: Global Market Y-o-Y Growth Comparison by Packaging Applications, 2025-2035
  • Figure 12: Global Market Attractiveness Analysis by Packaging Applications
  • Figure 13: Global Market Value Share and BPS Analysis by End Use, 2025 and 2035
  • Figure 14: Global Market Y-o-Y Growth Comparison by End Use, 2025-2035
  • Figure 15: Global Market Attractiveness Analysis by End Use
  • Figure 16: Global Market Value (USD Million) Share and BPS Analysis by Region, 2025 and 2035
  • Figure 17: Global Market Y-o-Y Growth Comparison by Region, 2025-2035
  • Figure 18: Global Market Attractiveness Analysis by Region
  • Figure 19: North America Market Incremental $ Opportunity, 2025-2035
  • Figure 20: Latin America Market Incremental $ Opportunity, 2025-2035
  • Figure 21: Western Europe Market Incremental $ Opportunity, 2025-2035
  • Figure 22: Eastern Europe Market Incremental $ Opportunity, 2025-2035
  • Figure 23: East Asia Market Incremental $ Opportunity, 2025-2035
  • Figure 24: South Asia & Pacific Market Incremental $ Opportunity, 2025-2035
  • Figure 25: Middle East and Africa Market Incremental $ Opportunity, 2025-2035
  • Figure 26: North America Market Value Share and BPS Analysis by Country, 2025 and 2035
  • Figure 27: North America Market Value Share and BPS Analysis by Antimicrobial Ingredient, 2025 and 2035
  • Figure 28: North America Market Y-o-Y Growth Comparison by Antimicrobial Ingredient, 2025-2035
  • Figure 29: North America Market Attractiveness Analysis by Antimicrobial Ingredient
  • Figure 30: North America Market Value Share and BPS Analysis by Technology, 2025 and 2035
  • Figure 31: North America Market Y-o-Y Growth Comparison by Technology, 2025-2035
  • Figure 32: North America Market Attractiveness Analysis by Technology
  • Figure 33: North America Market Value Share and BPS Analysis by Packaging Applications, 2025 and 2035
  • Figure 34: North America Market Y-o-Y Growth Comparison by Packaging Applications, 2025-2035
  • Figure 35: North America Market Attractiveness Analysis by Packaging Applications
  • Figure 36: North America Market Value Share and BPS Analysis by End Use, 2025 and 2035
  • Figure 37: North America Market Y-o-Y Growth Comparison by End Use, 2025-2035
  • Figure 38: North America Market Attractiveness Analysis by End Use
  • Figure 39: Latin America Market Value Share and BPS Analysis by Country, 2025 and 2035
  • Figure 40: Latin America Market Value Share and BPS Analysis by Antimicrobial Ingredient, 2025 and 2035
  • Figure 41: Latin America Market Y-o-Y Growth Comparison by Antimicrobial Ingredient, 2025-2035
  • Figure 42: Latin America Market Attractiveness Analysis by Antimicrobial Ingredient
  • Figure 43: Latin America Market Value Share and BPS Analysis by Technology, 2025 and 2035
  • Figure 44: Latin America Market Y-o-Y Growth Comparison by Technology, 2025-2035
  • Figure 45: Latin America Market Attractiveness Analysis by Technology
  • Figure 46: Latin America Market Value Share and BPS Analysis by Packaging Applications, 2025 and 2035
  • Figure 47: Latin America Market Y-o-Y Growth Comparison by Packaging Applications, 2025-2035
  • Figure 48: Latin America Market Attractiveness Analysis by Packaging Applications
  • Figure 49: Latin America Market Value Share and BPS Analysis by End Use, 2025 and 2035
  • Figure 50: Latin America Market Y-o-Y Growth Comparison by End Use, 2025-2035
  • Figure 51: Latin America Market Attractiveness Analysis by End Use
  • Figure 52: Western Europe Market Value Share and BPS Analysis by Country, 2025 and 2035
  • Figure 53: Western Europe Market Value Share and BPS Analysis by Antimicrobial Ingredient, 2025 and 2035
  • Figure 54: Western Europe Market Y-o-Y Growth Comparison by Antimicrobial Ingredient, 2025-2035
  • Figure 55: Western Europe Market Attractiveness Analysis by Antimicrobial Ingredient
  • Figure 56: Western Europe Market Value Share and BPS Analysis by Technology, 2025 and 2035
  • Figure 57: Western Europe Market Y-o-Y Growth Comparison by Technology, 2025-2035
  • Figure 58: Western Europe Market Attractiveness Analysis by Technology
  • Figure 59: Western Europe Market Value Share and BPS Analysis by Packaging Applications, 2025 and 2035
  • Figure 60: Western Europe Market Y-o-Y Growth Comparison by Packaging Applications, 2025-2035
  • Figure 61: Western Europe Market Attractiveness Analysis by Packaging Applications
  • Figure 62: Western Europe Market Value Share and BPS Analysis by End Use, 2025 and 2035
  • Figure 63: Western Europe Market Y-o-Y Growth Comparison by End Use, 2025-2035
  • Figure 64: Western Europe Market Attractiveness Analysis by End Use
  • Figure 65: Eastern Europe Market Value Share and BPS Analysis by Country, 2025 and 2035
  • Figure 66: Eastern Europe Market Value Share and BPS Analysis by Antimicrobial Ingredient, 2025 and 2035
  • Figure 67: Eastern Europe Market Y-o-Y Growth Comparison by Antimicrobial Ingredient, 2025-2035
  • Figure 68: Eastern Europe Market Attractiveness Analysis by Antimicrobial Ingredient
  • Figure 69: Eastern Europe Market Value Share and BPS Analysis by Technology, 2025 and 2035
  • Figure 70: Eastern Europe Market Y-o-Y Growth Comparison by Technology, 2025-2035
  • Figure 71: Eastern Europe Market Attractiveness Analysis by Technology
  • Figure 72: Eastern Europe Market Value Share and BPS Analysis by Packaging Applications, 2025 and 2035
  • Figure 73: Eastern Europe Market Y-o-Y Growth Comparison by Packaging Applications, 2025-2035
  • Figure 74: Eastern Europe Market Attractiveness Analysis by Packaging Applications
  • Figure 75: Eastern Europe Market Value Share and BPS Analysis by End Use, 2025 and 2035
  • Figure 76: Eastern Europe Market Y-o-Y Growth Comparison by End Use, 2025-2035
  • Figure 77: Eastern Europe Market Attractiveness Analysis by End Use
  • Figure 78: East Asia Market Value Share and BPS Analysis by Country, 2025 and 2035
  • Figure 79: East Asia Market Value Share and BPS Analysis by Antimicrobial Ingredient, 2025 and 2035
  • Figure 80: East Asia Market Y-o-Y Growth Comparison by Antimicrobial Ingredient, 2025-2035
  • Figure 81: East Asia Market Attractiveness Analysis by Antimicrobial Ingredient
  • Figure 82: East Asia Market Value Share and BPS Analysis by Technology, 2025 and 2035
  • Figure 83: East Asia Market Y-o-Y Growth Comparison by Technology, 2025-2035
  • Figure 84: East Asia Market Attractiveness Analysis by Technology
  • Figure 85: East Asia Market Value Share and BPS Analysis by Packaging Applications, 2025 and 2035
  • Figure 86: East Asia Market Y-o-Y Growth Comparison by Packaging Applications, 2025-2035
  • Figure 87: East Asia Market Attractiveness Analysis by Packaging Applications
  • Figure 88: East Asia Market Value Share and BPS Analysis by End Use, 2025 and 2035
  • Figure 89: East Asia Market Y-o-Y Growth Comparison by End Use, 2025-2035
  • Figure 90: East Asia Market Attractiveness Analysis by End Use
  • Figure 91: South Asia & Pacific Market Value Share and BPS Analysis by Country, 2025 and 2035
  • Figure 92: South Asia & Pacific Market Value Share and BPS Analysis by Antimicrobial Ingredient, 2025 and 2035
  • Figure 93: South Asia & Pacific Market Y-o-Y Growth Comparison by Antimicrobial Ingredient, 2025-2035
  • Figure 94: South Asia & Pacific Market Attractiveness Analysis by Antimicrobial Ingredient
  • Figure 95: South Asia & Pacific Market Value Share and BPS Analysis by Technology, 2025 and 2035
  • Figure 96: South Asia & Pacific Market Y-o-Y Growth Comparison by Technology, 2025-2035
  • Figure 97: South Asia & Pacific Market Attractiveness Analysis by Technology
  • Figure 98: South Asia & Pacific Market Value Share and BPS Analysis by Packaging Applications, 2025 and 2035
  • Figure 99: South Asia & Pacific Market Y-o-Y Growth Comparison by Packaging Applications, 2025-2035
  • Figure 100: South Asia & Pacific Market Attractiveness Analysis by Packaging Applications
  • Figure 101: South Asia & Pacific Market Value Share and BPS Analysis by End Use, 2025 and 2035
  • Figure 102: South Asia & Pacific Market Y-o-Y Growth Comparison by End Use, 2025-2035
  • Figure 103: South Asia & Pacific Market Attractiveness Analysis by End Use
  • Figure 104: Middle East and Africa Market Value Share and BPS Analysis by Country, 2025 and 2035
  • Figure 105: Middle East and Africa Market Value Share and BPS Analysis by Antimicrobial Ingredient, 2025 and 2035
  • Figure 106: Middle East and Africa Market Y-o-Y Growth Comparison by Antimicrobial Ingredient, 2025-2035
  • Figure 107: Middle East and Africa Market Attractiveness Analysis by Antimicrobial Ingredient
  • Figure 108: Middle East and Africa Market Value Share and BPS Analysis by Technology, 2025 and 2035
  • Figure 109: Middle East and Africa Market Y-o-Y Growth Comparison by Technology, 2025-2035
  • Figure 110: Middle East and Africa Market Attractiveness Analysis by Technology
  • Figure 111: Middle East and Africa Market Value Share and BPS Analysis by Packaging Applications, 2025 and 2035
  • Figure 112: Middle East and Africa Market Y-o-Y Growth Comparison by Packaging Applications, 2025-2035
  • Figure 113: Middle East and Africa Market Attractiveness Analysis by Packaging Applications
  • Figure 114: Middle East and Africa Market Value Share and BPS Analysis by End Use, 2025 and 2035
  • Figure 115: Middle East and Africa Market Y-o-Y Growth Comparison by End Use, 2025-2035
  • Figure 116: Middle East and Africa Market Attractiveness Analysis by End Use
  • Figure 117: Global Market - Tier Structure Analysis
  • Figure 118: Global Market - Company Share Analysis

Frequently Asked Questions

What is the market size of Antimicrobial Packaging Ingredients for Food Packaging for food in 2025?

The market is estimated at USD 3,056.8 million in 2025.

What will be the Antimicrobial Packaging Ingredients for Food Packaging market size in 2035?

By 2035, the market is projected to reach USD 4,657.0 million.

What is the growth rate of the Antimicrobial Packaging Ingredients for Food Packaging market from 2025 to 2035?

The market is expected to grow at a CAGR of 4.3% over the forecast period.

Which antimicrobial ingredient holds the largest share in 2025?

Organic acids are expected to lead, holding 29.1% of the market share in 2025.

Which technology segment dominates the market in 2025?

Active packaging will dominate with a 61.2% share in 2025.

Which application type is the most widely used in antimicrobial packaging?

Films are the most used, accounting for 33.1% of total market value in 2025.

Who are the leading companies in the Antimicrobial Packaging Ingredients for Food Packaging market?

Key players include Mondi Group, BioCote, LINPAC Packaging, and Reynolds Group.

Explore Similar Insights

Future Market Insights

Antimicrobial Packaging Ingredients for Food Packaging Market