Reports
- Global Locations -
Headquarters
Future Market Insights, Inc.
Christiana Corporate, 200
Continental Drive, Suite 401,
Newark, Delaware - 19713,
United States
Americas
Future Market Insights, Inc.
616 Corporate Way, Suite 2-9018,
Valley Cottage, NY 10989, United States
MEA
Future Market Insights
1602-6 Jumeirah Bay X2 Tower, Plot No: JLT-PH2-X2A,
Jumeirah Lakes Towers, Dubai,
United Arab Emirates
Europe
Future Market Insights
3rd Floor, 207 Regent Street,
W1B 3HH London
United Kingdom
Asia Pacific
Future Market Insights
Office No. 401-A, 4th Floor,
VANTAGE 9, S.No. 36/1/1,
Baner, Pune 411045, India
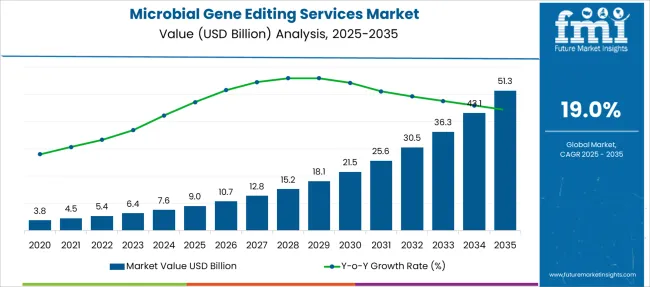
Global microbial gene editing services demand is anticipated to be valued at US$ 5.35 Billion in 2022, forecast to grow at a CAGR of 19% to be valued at US$ 30.5 Billion from 2022 to 2032.
Microbial gene editing is a technology that has the ability to change the DNA of organisms. Microbial gene editing is changing the ways of developing new medical treatments. From treating diseases such as sickle cell and HIV to custom pets and designer babies, microbial gene editing has great potential to affect all areas of life in the near future.
Report Attribute | Details |
---|---|
Estimated Base Year Value (2021) | US$ 4.5 Billion |
Expected Market Value (2022) | US$ 5.35 Billion |
Anticipated Forecast Value (2032) | US$ 30.5 Billion |
Projected Growth Rate (2022 to 2032) | 19% CAGR |
Development of new immunotherapies for diseases such as cancer as the rising prevalence of cancer which will significantly grow in the future will provide an opportunity for microbial gene editing. For instance, the first-ever human trials of CRISPR focused on treating various cancers in China and the first human trials for CRISPR tech in the USA set to focus on diseases such as sickle cell.
Progress in the availability of computational tools and wet-lab genome editing (GE) technologies has greatly expanded the capability for the complex requirements of a system-level investigation of microbes.
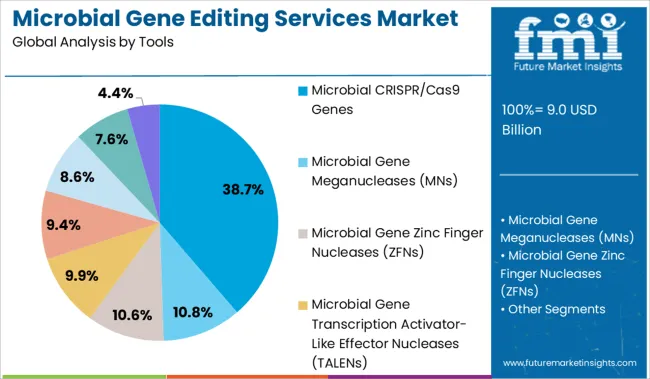
Microbial gene editing tools such as targeting, zinc finger nucleases (ZFNs), meganucleases (MNs), (CRISPR)-associated nuclease Cas9 and transcription activator-like effector nucleases (TALENs), and, creates huge opportunity for the gene editing in the forecast period. All these tools can achieve accurate and precise genetic modifications by inducing targeted DNA double-strand breaks.
Don't pay for what you don't need
Customize your report by selecting specific countries or regions and save 30%!
Recent research and development in genome editing technologies hold promise in the forecast period for the development of innovative therapies. The use of genome tools has the potential to affect various therapeutic areas and hundreds of diseases, common and rare diseases which will significantly boost the market.
Over the years, Increased attention is given to the development of new antimicrobials which fight against antibiotic-resistant bacteria. For instance, Companies such as Nemesis Bioscience and Eligo Bioscience are developing antimicrobial technology and treatments with the help of CRISPR technology. Increasing government funding and the development of fast and easy methods with high efficiency spur the microbial gene editing services market in the forecast period.
Other factors like rising acceptance and increasing medical research and development for gene editing, growth of established and new gene editing tools, and rising clinical trials for diseases as diverse as muscular dystrophy, cancer, and sickle cell anemia will further drive the microbial gene editing services market. In addition to these factors, an increasing number of skilled laborers will create opportunities for the development of new tools in the future which will bring significant growth in the revenue of the microbial gene editing services market in the forecast period.
The challenges associated with the growth of the global microbial gene editing services market are variations in regulatory standards for different regions or countries. Moreover, certain limitations to the available tool and high costs associated with the editing systems might restrain the growth of the microbial gene editing services market.
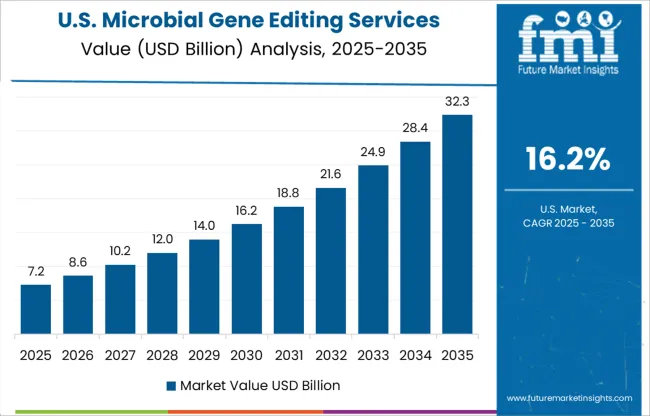
According to Future Market Insights, the North American market for Microbial Gene Editing Services holds the largest revenue share, due to increasing research and development and rising government funding for microbial gene editing research.
For instance, in 2018, The USA National Institutes of Health (NIH) announced to grant US$190 million for genome editing research. The launch of genome editing programs by NIH such as Somatic Cell Genome Editing programs which aims to develop tools for safe and effective genome editing in humans spur the market of North America in the forecast period.
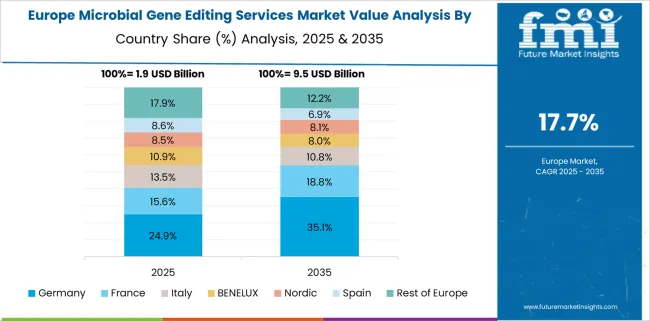
As per the FMI analysis, Europe accounts for the second largest revenue share in the global microbial gene editing services market, owing to the increasing prevalence of diseases such as HIV and Cancer and the development of new innovative technology and new drugs along with the increasing number of skilled laborers. Moreover, rapid growth is expected in the microbial gene editing services market, due to advances in technology and the establishment of scientific research groups and laboratories.
Get the data you need at a Fraction of the cost
Personalize your report by choosing insights you need
and save 40%!
Asia Pacific is expected to witness rapid growth in the microbial gene editing services market, due to increasing awareness of gene editing services in developing countries such as India and improving healthcare infrastructure. China is expected to register significant growth in the microbial gene editing services market, due to favorable regulations and advancements in biotechnology.
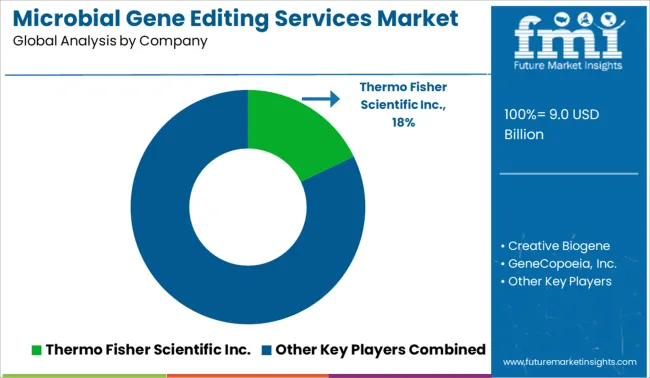
Some of the key participants present in the global microbial gene editing services market include Creative Biogene, GeneCopoeia, Inc., ProteoGenix, Thermo Fisher Scientific Inc., Vigene Biosciences Inc, Biotools Co.Ltd, Cellecta, In, NemaMetrix Inc, GenScript Biotech Corp, OriGene Technologies, Inc, Synbio Technologies LLC, ABM Inc, and Rockland Immunochemicals Inc., among others. Attributed to the presence of such a high number of participants, the market is highly competitive.
Report Attribute | Details |
---|---|
Market Value in 2022 | US$ 5.35 Billion |
Market Value in 2032 | US$ 30.5 Billion |
Growth Rate | CAGR of 19% from 2022 to 2032 |
Base Year for Estimation | 2021 |
Historical Data | 2017 to 2021 |
Forecast Period | 2022 to 2032 |
Quantitative Units | Revenue in USD Million and CAGR from 2022 to 2032 |
Report Coverage | Revenue Forecast, Volume Forecast, Company Ranking, Competitive Landscape, Growth Factors, Trends, and Pricing Analysis |
Segments Covered |
|
Regions Covered |
|
Key Countries Profiled |
|
Key Companies Profiled |
|
Customization | Available Upon Request |
1. Executive Summary | Microbial Gene Editing Services Market 1.1. Global Market Outlook 1.2. Demand-side Trends 1.3. Supply-side Trends 1.4. Technology Roadmap Analysis 1.5. Analysis and Recommendations 2. Market Overview 2.1. Market Coverage / Taxonomy 2.2. Market Definition / Scope / Limitations 3. Market Background 3.1. Market Dynamics 3.1.1. Drivers 3.1.2. Restraints 3.1.3. Opportunity 3.1.4. Trends 3.2. Scenario Forecast 3.2.1. Demand in Optimistic Scenario 3.2.2. Demand in Likely Scenario 3.2.3. Demand in Conservative Scenario 3.3. Opportunity Map Analysis 3.4. Investment Feasibility Matrix 3.5. Value Chain Analysis 3.5.1. Profit Margin Analysis 3.5.2. Service Providers 3.6. PESTLE and Porter’s Analysis 3.7. Regulatory Landscape 3.7.1. By Key Regions 3.7.2. By Key Countries 3.8. Regional Parent Market Outlook 4. Global Market Analysis 2017 to 2021 and Forecast, 2022 to 2032 4.1. Historical Market Size Value (US$ Million) Analysis, 2017 to 2021 4.2. Current and Future Market Size Value (US$ Million) Projections, 2022 to 2032 4.2.1. Y-o-Y Growth Trend Analysis 4.2.2. Absolute $ Opportunity Analysis 5. Global Market Analysis 2017 to 2021 and Forecast 2022 to 2032, By Tools 5.1. Introduction / Key Findings 5.2. Historical Market Size Value (US$ Million) Analysis By Tools, 2017 to 2021 5.3. Current and Future Market Size Value (US$ Million) Analysis and Forecast By Tools, 2022 to 2032 5.3.1. Meganucleases 5.3.2. Zinc Finger Nucleases 5.3.3. Transcription Activator-Like Effector Nucleases 5.3.4. CRISPR/Cas9 5.3.5. Targetrons 5.3.6. Peptide Nucleic Acids 5.3.7. Triplex-Forming Oligonucleotides 5.3.8. Structure-Guided Endonucleases 5.4. Y-o-Y Growth Trend Analysis By Tools, 2017 to 2021 5.5. Absolute $ Opportunity Analysis By Tools, 2022 to 2032 6. Global Market Analysis 2017 to 2021 and Forecast 2022 to 2032, By Application 6.1. Introduction / Key Findings 6.2. Historical Market Size Value (US$ Million) Analysis By Application, 2017 to 2021 6.3. Current and Future Market Size Value (US$ Million) Analysis and Forecast By Application, 2022 to 2032 6.3.1. Industrial Applications 6.3.2. Pharmaceutical Applications 6.3.3. Environmental Applications 6.3.4. Agricultural Applications 6.4. Y-o-Y Growth Trend Analysis By Application, 2017 to 2021 6.5. Absolute $ Opportunity Analysis By Application, 2022 to 2032 7. Global Market Analysis 2017 to 2021 and Forecast 2022 to 2032, By End User 7.1. Introduction / Key Findings 7.2. Historical Market Size Value (US$ Million) Analysis By End User, 2017 to 2021 7.3. Current and Future Market Size Value (US$ Million) Analysis and Forecast By End User, 2022 to 2032 7.3.1. Biotechnological Companies 7.3.2. Pharmaceutical Companies 7.3.3. Contract Research Organizations 7.3.4. Academic Research Institutes 7.4. Y-o-Y Growth Trend Analysis By End User, 2017 to 2021 7.5. Absolute $ Opportunity Analysis By End User, 2022 to 2032 8. Global Market Analysis 2017 to 2021 and Forecast 2022 to 2032, By Region 8.1. Introduction 8.2. Historical Market Size Value (US$ Million) Analysis By Region, 2017 to 2021 8.3. Current Market Size Value (US$ Million) Analysis and Forecast By Region, 2022 to 2032 8.3.1. North America 8.3.2. Latin America 8.3.3. Europe 8.3.4. East Asia 8.3.5. South Asia & Pacific 8.3.6. Middle East and Africa 8.4. Market Attractiveness Analysis By Region 9. North America Market Analysis 2017 to 2021 and Forecast 2022 to 2032, By Country 9.1. Historical Market Size Value (US$ Million) Trend Analysis By Market Taxonomy, 2017 to 2021 9.2. Market Size Value (US$ Million) Forecast By Market Taxonomy, 2022 to 2032 9.2.1. By Country 9.2.1.1. USA 9.2.1.2. Canada 9.2.2. By Tools 9.2.3. By Application 9.2.4. By End User 9.3. Market Attractiveness Analysis 9.3.1. By Country 9.3.2. By Tools 9.3.3. By Application 9.3.4. By End User 9.4. Key Takeaways 10. Latin America Market Analysis 2017 to 2021 and Forecast 2022 to 2032, By Country 10.1. Historical Market Size Value (US$ Million) Trend Analysis By Market Taxonomy, 2017 to 2021 10.2. Market Size Value (US$ Million) Forecast By Market Taxonomy, 2022 to 2032 10.2.1. By Country 10.2.1.1. Mexico 10.2.1.2. Brazil 10.2.1.3. Rest of Latin America 10.2.2. By Tools 10.2.3. By Application 10.2.4. By End User 10.3. Market Attractiveness Analysis 10.3.1. By Country 10.3.2. By Tools 10.3.3. By Application 10.3.4. By End User 10.4. Key Takeaways 11. Europe Market Analysis 2017 to 2021 and Forecast 2022 to 2032, By Country 11.1. Historical Market Size Value (US$ Million) Trend Analysis By Market Taxonomy, 2017 to 2021 11.2. Market Size Value (US$ Million) Forecast By Market Taxonomy, 2022 to 2032 11.2.1. By Country 11.2.1.1. Germany 11.2.1.2. Italy 11.2.1.3. France 11.2.1.4. United Kingdom 11.2.1.5. Spain 11.2.1.6. BENELUX 11.2.1.7. Russia 11.2.1.8. Rest of Europe 11.2.2. By Tools 11.2.3. By Application 11.2.4. By End User 11.3. Market Attractiveness Analysis 11.3.1. By Country 11.3.2. By Tools 11.3.3. By Application 11.3.4. By End User 11.4. Key Takeaways 12. East Asia Market Analysis 2017 to 2021 and Forecast 2022 to 2032, By Country 12.1. Historical Market Size Value (US$ Million) Trend Analysis By Market Taxonomy, 2017 to 2021 12.2. Market Size Value (US$ Million) Forecast By Market Taxonomy, 2022 to 2032 12.2.1. By Country 12.2.1.1. China 12.2.1.2. Japan 12.2.1.3. South Korea 12.2.2. By Tools 12.2.3. By Application 12.2.4. By End User 12.3. Market Attractiveness Analysis 12.3.1. By Country 12.3.2. By Tools 12.3.3. By Application 12.3.4. By End User 12.4. Key Takeaways 13. South Asia & Pacific Market Analysis 2017 to 2021 and Forecast 2022 to 2032, By Country 13.1. Historical Market Size Value (US$ Million) Trend Analysis By Market Taxonomy, 2017 to 2021 13.2. Market Size Value (US$ Million) Forecast By Market Taxonomy, 2022 to 2032 13.2.1. By Country 13.2.1.1. India 13.2.1.2. ASEAN 13.2.1.3. Australia and New Zealand 13.2.1.4. Rest of South Asia & Pacific 13.2.2. By Tools 13.2.3. By Application 13.2.4. By End User 13.3. Market Attractiveness Analysis 13.3.1. By Country 13.3.2. By Tools 13.3.3. By Application 13.3.4. By End User 13.4. Key Takeaways 14. Middle East and Africa Market Analysis 2017 to 2021 and Forecast 2022 to 2032, By Country 14.1. Historical Market Size Value (US$ Million) Trend Analysis By Market Taxonomy, 2017 to 2021 14.2. Market Size Value (US$ Million) Forecast By Market Taxonomy, 2022 to 2032 14.2.1. By Country 14.2.1.1. GCC Countries 14.2.1.2. Turkey 14.2.1.3. South Africa 14.2.1.4. Rest of Middle East and Africa 14.2.2. By Tools 14.2.3. By Application 14.2.4. By End User 14.3. Market Attractiveness Analysis 14.3.1. By Country 14.3.2. By Tools 14.3.3. By Application 14.3.4. By End User 14.4. Key Takeaways 15. Key Countries Market Analysis 15.1. USA 15.1.1. Pricing Analysis 15.1.2. Market Share Analysis, 2021 15.1.2.1. By Tools 15.1.2.2. By Application 15.1.2.3. By End User 15.2. Canada 15.2.1. Pricing Analysis 15.2.2. Market Share Analysis, 2021 15.2.2.1. By Tools 15.2.2.2. By Application 15.2.2.3. By End User 15.3. Mexico 15.3.1. Pricing Analysis 15.3.2. Market Share Analysis, 2021 15.3.2.1. By Tools 15.3.2.2. By Application 15.3.2.3. By End User 15.4. Brazil 15.4.1. Pricing Analysis 15.4.2. Market Share Analysis, 2021 15.4.2.1. By Tools 15.4.2.2. By Application 15.4.2.3. By End User 15.5. Germany 15.5.1. Pricing Analysis 15.5.2. Market Share Analysis, 2021 15.5.2.1. By Tools 15.5.2.2. By Application 15.5.2.3. By End User 15.6. Italy 15.6.1. Pricing Analysis 15.6.2. Market Share Analysis, 2021 15.6.2.1. By Tools 15.6.2.2. By Application 15.6.2.3. By End User 15.7. France 15.7.1. Pricing Analysis 15.7.2. Market Share Analysis, 2021 15.7.2.1. By Tools 15.7.2.2. By Application 15.7.2.3. By End User 15.8. United Kingdom 15.8.1. Pricing Analysis 15.8.2. Market Share Analysis, 2021 15.8.2.1. By Tools 15.8.2.2. By Application 15.8.2.3. By End User 15.9. Spain 15.9.1. Pricing Analysis 15.9.2. Market Share Analysis, 2021 15.9.2.1. By Tools 15.9.2.2. By Application 15.9.2.3. By End User 15.10. BENELUX 15.10.1. Pricing Analysis 15.10.2. Market Share Analysis, 2021 15.10.2.1. By Tools 15.10.2.2. By Application 15.10.2.3. By End User 15.11. Russia 15.11.1. Pricing Analysis 15.11.2. Market Share Analysis, 2021 15.11.2.1. By Tools 15.11.2.2. By Application 15.11.2.3. By End User 15.12. China 15.12.1. Pricing Analysis 15.12.2. Market Share Analysis, 2021 15.12.2.1. By Tools 15.12.2.2. By Application 15.12.2.3. By End User 15.13. Japan 15.13.1. Pricing Analysis 15.13.2. Market Share Analysis, 2021 15.13.2.1. By Tools 15.13.2.2. By Application 15.13.2.3. By End User 15.14. South Korea 15.14.1. Pricing Analysis 15.14.2. Market Share Analysis, 2021 15.14.2.1. By Tools 15.14.2.2. By Application 15.14.2.3. By End User 15.15. India 15.15.1. Pricing Analysis 15.15.2. Market Share Analysis, 2021 15.15.2.1. By Tools 15.15.2.2. By Application 15.15.2.3. By End User 15.16. ASIAN 15.16.1. Pricing Analysis 15.16.2. Market Share Analysis, 2021 15.16.2.1. By Tools 15.16.2.2. By Application 15.16.2.3. By End User 15.17. Australia and New Zealand 15.17.1. Pricing Analysis 15.17.2. Market Share Analysis, 2021 15.17.2.1. By Tools 15.17.2.2. By Application 15.17.2.3. By End User 15.18. GCC Countries 15.18.1. Pricing Analysis 15.18.2. Market Share Analysis, 2021 15.18.2.1. By Tools 15.18.2.2. By Application 15.18.2.3. By End User 15.19. Turkey 15.19.1. Pricing Analysis 15.19.2. Market Share Analysis, 2021 15.19.2.1. By Tools 15.19.2.2. By Application 15.19.2.3. By End User 15.20. South Africa 15.20.1. Pricing Analysis 15.20.2. Market Share Analysis, 2021 15.20.2.1. By Tools 15.20.2.2. By Application 15.20.2.3. By End User 16. Market Structure Analysis 16.1. Competition Dashboard 16.2. Competition Benchmarking 16.3. Market Share Analysis of Top Players 16.3.1. By Regional 16.3.2. By Tools 16.3.3. By Application 16.3.4. By End User 17. Competition Analysis 17.1. Competition Deep Dive 17.1.1. Creative Biogene 17.1.1.1. Overview 17.1.1.2. Product Portfolio 17.1.1.3. Profitability by Market Segments 17.1.1.4. Sales Footprint 17.1.1.5. Strategy Overview 17.1.1.5.1. Marketing Strategy 17.1.1.5.2. Product Strategy 17.1.1.5.3. Channel Strategy 17.1.2. GeneCopoeia, Inc. 17.1.2.1. Overview 17.1.2.2. Product Portfolio 17.1.2.3. Profitability by Market Segments 17.1.2.4. Sales Footprint 17.1.2.5. Strategy Overview 17.1.2.5.1. Marketing Strategy 17.1.2.5.2. Product Strategy 17.1.2.5.3. Channel Strategy 17.1.3. ProteoGenix 17.1.3.1. Overview 17.1.3.2. Product Portfolio 17.1.3.3. Profitability by Market Segments 17.1.3.4. Sales Footprint 17.1.3.5. Strategy Overview 17.1.3.5.1. Marketing Strategy 17.1.3.5.2. Product Strategy 17.1.3.5.3. Channel Strategy 17.1.4. Thermo Fisher Scientific Inc. 17.1.4.1. Overview 17.1.4.2. Product Portfolio 17.1.4.3. Profitability by Market Segments 17.1.4.4. Sales Footprint 17.1.4.5. Strategy Overview 17.1.4.5.1. Marketing Strategy 17.1.4.5.2. Product Strategy 17.1.4.5.3. Channel Strategy 17.1.5. Charles River 17.1.5.1. Overview 17.1.5.2. Product Portfolio 17.1.5.3. Profitability by Market Segments 17.1.5.4. Sales Footprint 17.1.5.5. Strategy Overview 17.1.5.5.1. Marketing Strategy 17.1.5.5.2. Product Strategy 17.1.5.5.3. Channel Strategy 17.1.6. Biotools Co., Ltd 17.1.6.1. Overview 17.1.6.2. Product Portfolio 17.1.6.3. Profitability by Market Segments 17.1.6.4. Sales Footprint 17.1.6.5. Strategy Overview 17.1.6.5.1. Marketing Strategy 17.1.6.5.2. Product Strategy 17.1.6.5.3. Channel Strategy 17.1.7. Cellecta, Inc 17.1.7.1. Overview 17.1.7.2. Product Portfolio 17.1.7.3. Profitability by Market Segments 17.1.7.4. Sales Footprint 17.1.7.5. Strategy Overview 17.1.7.5.1. Marketing Strategy 17.1.7.5.2. Product Strategy 17.1.7.5.3. Channel Strategy 17.1.8. InVivo Biosystems 17.1.8.1. Overview 17.1.8.2. Product Portfolio 17.1.8.3. Profitability by Market Segments 17.1.8.4. Sales Footprint 17.1.8.5. Strategy Overview 17.1.8.5.1. Marketing Strategy 17.1.8.5.2. Product Strategy 17.1.8.5.3. Channel Strategy 17.1.9. GenScript Biotech Corp 17.1.9.1. Overview 17.1.9.2. Product Portfolio 17.1.9.3. Profitability by Market Segments 17.1.9.4. Sales Footprint 17.1.9.5. Strategy Overview 17.1.9.5.1. Marketing Strategy 17.1.9.5.2. Product Strategy 17.1.9.5.3. Channel Strategy 17.1.10. OriGene Technologies, Inc. 17.1.10.1. Overview 17.1.10.2. Product Portfolio 17.1.10.3. Profitability by Market Segments 17.1.10.4. Sales Footprint 17.1.10.5. Strategy Overview 17.1.10.5.1. Marketing Strategy 17.1.10.5.2. Product Strategy 17.1.10.5.3. Channel Strategy 17.1.11. Synbio Technologies LLC 17.1.11.1. Overview 17.1.11.2. Product Portfolio 17.1.11.3. Profitability by Market Segments 17.1.11.4. Sales Footprint 17.1.11.5. Strategy Overview 17.1.11.5.1. Marketing Strategy 17.1.11.5.2. Product Strategy 17.1.11.5.3. Channel Strategy 17.1.12. ABM Inc 17.1.12.1. Overview 17.1.12.2. Product Portfolio 17.1.12.3. Profitability by Market Segments 17.1.12.4. Sales Footprint 17.1.12.5. Strategy Overview 17.1.12.5.1. Marketing Strategy 17.1.12.5.2. Product Strategy 17.1.12.5.3. Channel Strategy 17.1.13. Rockland Immunochemicals Inc. 17.1.13.1. Overview 17.1.13.2. Product Portfolio 17.1.13.3. Profitability by Market Segments 17.1.13.4. Sales Footprint 17.1.13.5. Strategy Overview 17.1.13.5.1. Marketing Strategy 17.1.13.5.2. Product Strategy 17.1.13.5.3. Channel Strategy 18. Assumptions & Acronyms Used 19. Research Methodology
Don't pay for what you don't need
Customize your report by selecting specific countries or regions and save 30%!
Table 1: Global Market Value (US$ Million) Forecast by Region, 2017 to 2032 Table 2: Global Market Value (US$ Million) Forecast by Tools, 2017 to 2032 Table 3: Global Market Value (US$ Million) Forecast by Application, 2017 to 2032 Table 4: Global Market Value (US$ Million) Forecast by End User, 2017 to 2032 Table 5: North America Market Value (US$ Million) Forecast by Country, 2017 to 2032 Table 6: North America Market Value (US$ Million) Forecast by Tools, 2017 to 2032 Table 7: North America Market Value (US$ Million) Forecast by Application, 2017 to 2032 Table 8: North America Market Value (US$ Million) Forecast by End User, 2017 to 2032 Table 9: Latin America Market Value (US$ Million) Forecast by Country, 2017 to 2032 Table 10: Latin America Market Value (US$ Million) Forecast by Tools, 2017 to 2032 Table 11: Latin America Market Value (US$ Million) Forecast by Application, 2017 to 2032 Table 12: Latin America Market Value (US$ Million) Forecast by End User, 2017 to 2032 Table 13: Europe Market Value (US$ Million) Forecast by Country, 2017 to 2032 Table 14: Europe Market Value (US$ Million) Forecast by Tools, 2017 to 2032 Table 15: Europe Market Value (US$ Million) Forecast by Application, 2017 to 2032 Table 16: Europe Market Value (US$ Million) Forecast by End User, 2017 to 2032 Table 17: East Asia Market Value (US$ Million) Forecast by Country, 2017 to 2032 Table 18: East Asia Market Value (US$ Million) Forecast by Tools, 2017 to 2032 Table 19: East Asia Market Value (US$ Million) Forecast by Application, 2017 to 2032 Table 20: East Asia Market Value (US$ Million) Forecast by End User, 2017 to 2032 Table 21: South Asia & Pacific Market Value (US$ Million) Forecast by Country, 2017 to 2032 Table 22: South Asia & Pacific Market Value (US$ Million) Forecast by Tools, 2017 to 2032 Table 23: South Asia & Pacific Market Value (US$ Million) Forecast by Application, 2017 to 2032 Table 24: South Asia & Pacific Market Value (US$ Million) Forecast by End User, 2017 to 2032 Table 25: MEA Market Value (US$ Million) Forecast by Country, 2017 to 2032 Table 26: MEA Market Value (US$ Million) Forecast by Tools, 2017 to 2032 Table 27: MEA Market Value (US$ Million) Forecast by Application, 2017 to 2032 Table 28: MEA Market Value (US$ Million) Forecast by End User, 2017 to 2032
Figure 1: Global Market Value (US$ Million) by Tools, 2022 to 2032 Figure 2: Global Market Value (US$ Million) by Application, 2022 to 2032 Figure 3: Global Market Value (US$ Million) by End User, 2022 to 2032 Figure 4: Global Market Value (US$ Million) by Region, 2022 to 2032 Figure 5: Global Market Value (US$ Million) Analysis by Region, 2017 to 2032 Figure 6: Global Market Value Share (%) and BPS Analysis by Region, 2022 to 2032 Figure 7: Global Market Y-o-Y Growth (%) Projections by Region, 2022 to 2032 Figure 8: Global Market Value (US$ Million) Analysis by Tools, 2017 to 2032 Figure 9: Global Market Value Share (%) and BPS Analysis by Tools, 2022 to 2032 Figure 10: Global Market Y-o-Y Growth (%) Projections by Tools, 2022 to 2032 Figure 11: Global Market Value (US$ Million) Analysis by Application, 2017 to 2032 Figure 12: Global Market Value Share (%) and BPS Analysis by Application, 2022 to 2032 Figure 13: Global Market Y-o-Y Growth (%) Projections by Application, 2022 to 2032 Figure 14: Global Market Value (US$ Million) Analysis by End User, 2017 to 2032 Figure 15: Global Market Value Share (%) and BPS Analysis by End User, 2022 to 2032 Figure 16: Global Market Y-o-Y Growth (%) Projections by End User, 2022 to 2032 Figure 17: Global Market Attractiveness by Tools, 2022 to 2032 Figure 18: Global Market Attractiveness by Application, 2022 to 2032 Figure 19: Global Market Attractiveness by End User, 2022 to 2032 Figure 20: Global Market Attractiveness by Region, 2022 to 2032 Figure 21: North America Market Value (US$ Million) by Tools, 2022 to 2032 Figure 22: North America Market Value (US$ Million) by Application, 2022 to 2032 Figure 23: North America Market Value (US$ Million) by End User, 2022 to 2032 Figure 24: North America Market Value (US$ Million) by Country, 2022 to 2032 Figure 25: North America Market Value (US$ Million) Analysis by Country, 2017 to 2032 Figure 26: North America Market Value Share (%) and BPS Analysis by Country, 2022 to 2032 Figure 27: North America Market Y-o-Y Growth (%) Projections by Country, 2022 to 2032 Figure 28: North America Market Value (US$ Million) Analysis by Tools, 2017 to 2032 Figure 29: North America Market Value Share (%) and BPS Analysis by Tools, 2022 to 2032 Figure 30: North America Market Y-o-Y Growth (%) Projections by Tools, 2022 to 2032 Figure 31: North America Market Value (US$ Million) Analysis by Application, 2017 to 2032 Figure 32: North America Market Value Share (%) and BPS Analysis by Application, 2022 to 2032 Figure 33: North America Market Y-o-Y Growth (%) Projections by Application, 2022 to 2032 Figure 34: North America Market Value (US$ Million) Analysis by End User, 2017 to 2032 Figure 35: North America Market Value Share (%) and BPS Analysis by End User, 2022 to 2032 Figure 36: North America Market Y-o-Y Growth (%) Projections by End User, 2022 to 2032 Figure 37: North America Market Attractiveness by Tools, 2022 to 2032 Figure 38: North America Market Attractiveness by Application, 2022 to 2032 Figure 39: North America Market Attractiveness by End User, 2022 to 2032 Figure 40: North America Market Attractiveness by Country, 2022 to 2032 Figure 41: Latin America Market Value (US$ Million) by Tools, 2022 to 2032 Figure 42: Latin America Market Value (US$ Million) by Application, 2022 to 2032 Figure 43: Latin America Market Value (US$ Million) by End User, 2022 to 2032 Figure 44: Latin America Market Value (US$ Million) by Country, 2022 to 2032 Figure 45: Latin America Market Value (US$ Million) Analysis by Country, 2017 to 2032 Figure 46: Latin America Market Value Share (%) and BPS Analysis by Country, 2022 to 2032 Figure 47: Latin America Market Y-o-Y Growth (%) Projections by Country, 2022 to 2032 Figure 48: Latin America Market Value (US$ Million) Analysis by Tools, 2017 to 2032 Figure 49: Latin America Market Value Share (%) and BPS Analysis by Tools, 2022 to 2032 Figure 50: Latin America Market Y-o-Y Growth (%) Projections by Tools, 2022 to 2032 Figure 51: Latin America Market Value (US$ Million) Analysis by Application, 2017 to 2032 Figure 52: Latin America Market Value Share (%) and BPS Analysis by Application, 2022 to 2032 Figure 53: Latin America Market Y-o-Y Growth (%) Projections by Application, 2022 to 2032 Figure 54: Latin America Market Value (US$ Million) Analysis by End User, 2017 to 2032 Figure 55: Latin America Market Value Share (%) and BPS Analysis by End User, 2022 to 2032 Figure 56: Latin America Market Y-o-Y Growth (%) Projections by End User, 2022 to 2032 Figure 57: Latin America Market Attractiveness by Tools, 2022 to 2032 Figure 58: Latin America Market Attractiveness by Application, 2022 to 2032 Figure 59: Latin America Market Attractiveness by End User, 2022 to 2032 Figure 60: Latin America Market Attractiveness by Country, 2022 to 2032 Figure 61: Europe Market Value (US$ Million) by Tools, 2022 to 2032 Figure 62: Europe Market Value (US$ Million) by Application, 2022 to 2032 Figure 63: Europe Market Value (US$ Million) by End User, 2022 to 2032 Figure 64: Europe Market Value (US$ Million) by Country, 2022 to 2032 Figure 65: Europe Market Value (US$ Million) Analysis by Country, 2017 to 2032 Figure 66: Europe Market Value Share (%) and BPS Analysis by Country, 2022 to 2032 Figure 67: Europe Market Y-o-Y Growth (%) Projections by Country, 2022 to 2032 Figure 68: Europe Market Value (US$ Million) Analysis by Tools, 2017 to 2032 Figure 69: Europe Market Value Share (%) and BPS Analysis by Tools, 2022 to 2032 Figure 70: Europe Market Y-o-Y Growth (%) Projections by Tools, 2022 to 2032 Figure 71: Europe Market Value (US$ Million) Analysis by Application, 2017 to 2032 Figure 72: Europe Market Value Share (%) and BPS Analysis by Application, 2022 to 2032 Figure 73: Europe Market Y-o-Y Growth (%) Projections by Application, 2022 to 2032 Figure 74: Europe Market Value (US$ Million) Analysis by End User, 2017 to 2032 Figure 75: Europe Market Value Share (%) and BPS Analysis by End User, 2022 to 2032 Figure 76: Europe Market Y-o-Y Growth (%) Projections by End User, 2022 to 2032 Figure 77: Europe Market Attractiveness by Tools, 2022 to 2032 Figure 78: Europe Market Attractiveness by Application, 2022 to 2032 Figure 79: Europe Market Attractiveness by End User, 2022 to 2032 Figure 80: Europe Market Attractiveness by Country, 2022 to 2032 Figure 81: East Asia Market Value (US$ Million) by Tools, 2022 to 2032 Figure 82: East Asia Market Value (US$ Million) by Application, 2022 to 2032 Figure 83: East Asia Market Value (US$ Million) by End User, 2022 to 2032 Figure 84: East Asia Market Value (US$ Million) by Country, 2022 to 2032 Figure 85: East Asia Market Value (US$ Million) Analysis by Country, 2017 to 2032 Figure 86: East Asia Market Value Share (%) and BPS Analysis by Country, 2022 to 2032 Figure 87: East Asia Market Y-o-Y Growth (%) Projections by Country, 2022 to 2032 Figure 88: East Asia Market Value (US$ Million) Analysis by Tools, 2017 to 2032 Figure 89: East Asia Market Value Share (%) and BPS Analysis by Tools, 2022 to 2032 Figure 90: East Asia Market Y-o-Y Growth (%) Projections by Tools, 2022 to 2032 Figure 91: East Asia Market Value (US$ Million) Analysis by Application, 2017 to 2032 Figure 92: East Asia Market Value Share (%) and BPS Analysis by Application, 2022 to 2032 Figure 93: East Asia Market Y-o-Y Growth (%) Projections by Application, 2022 to 2032 Figure 94: East Asia Market Value (US$ Million) Analysis by End User, 2017 to 2032 Figure 95: East Asia Market Value Share (%) and BPS Analysis by End User, 2022 to 2032 Figure 96: East Asia Market Y-o-Y Growth (%) Projections by End User, 2022 to 2032 Figure 97: East Asia Market Attractiveness by Tools, 2022 to 2032 Figure 98: East Asia Market Attractiveness by Application, 2022 to 2032 Figure 99: East Asia Market Attractiveness by End User, 2022 to 2032 Figure 100: East Asia Market Attractiveness by Country, 2022 to 2032 Figure 101: South Asia & Pacific Market Value (US$ Million) by Tools, 2022 to 2032 Figure 102: South Asia & Pacific Market Value (US$ Million) by Application, 2022 to 2032 Figure 103: South Asia & Pacific Market Value (US$ Million) by End User, 2022 to 2032 Figure 104: South Asia & Pacific Market Value (US$ Million) by Country, 2022 to 2032 Figure 105: South Asia & Pacific Market Value (US$ Million) Analysis by Country, 2017 to 2032 Figure 106: South Asia & Pacific Market Value Share (%) and BPS Analysis by Country, 2022 to 2032 Figure 107: South Asia & Pacific Market Y-o-Y Growth (%) Projections by Country, 2022 to 2032 Figure 108: South Asia & Pacific Market Value (US$ Million) Analysis by Tools, 2017 to 2032 Figure 109: South Asia & Pacific Market Value Share (%) and BPS Analysis by Tools, 2022 to 2032 Figure 110: South Asia & Pacific Market Y-o-Y Growth (%) Projections by Tools, 2022 to 2032 Figure 111: South Asia & Pacific Market Value (US$ Million) Analysis by Application, 2017 to 2032 Figure 112: South Asia & Pacific Market Value Share (%) and BPS Analysis by Application, 2022 to 2032 Figure 113: South Asia & Pacific Market Y-o-Y Growth (%) Projections by Application, 2022 to 2032 Figure 114: South Asia & Pacific Market Value (US$ Million) Analysis by End User, 2017 to 2032 Figure 115: South Asia & Pacific Market Value Share (%) and BPS Analysis by End User, 2022 to 2032 Figure 116: South Asia & Pacific Market Y-o-Y Growth (%) Projections by End User, 2022 to 2032 Figure 117: South Asia & Pacific Market Attractiveness by Tools, 2022 to 2032 Figure 118: South Asia & Pacific Market Attractiveness by Application, 2022 to 2032 Figure 119: South Asia & Pacific Market Attractiveness by End User, 2022 to 2032 Figure 120: South Asia & Pacific Market Attractiveness by Country, 2022 to 2032 Figure 121: MEA Market Value (US$ Million) by Tools, 2022 to 2032 Figure 122: MEA Market Value (US$ Million) by Application, 2022 to 2032 Figure 123: MEA Market Value (US$ Million) by End User, 2022 to 2032 Figure 124: MEA Market Value (US$ Million) by Country, 2022 to 2032 Figure 125: MEA Market Value (US$ Million) Analysis by Country, 2017 to 2032 Figure 126: MEA Market Value Share (%) and BPS Analysis by Country, 2022 to 2032 Figure 127: MEA Market Y-o-Y Growth (%) Projections by Country, 2022 to 2032 Figure 128: MEA Market Value (US$ Million) Analysis by Tools, 2017 to 2032 Figure 129: MEA Market Value Share (%) and BPS Analysis by Tools, 2022 to 2032 Figure 130: MEA Market Y-o-Y Growth (%) Projections by Tools, 2022 to 2032 Figure 131: MEA Market Value (US$ Million) Analysis by Application, 2017 to 2032 Figure 132: MEA Market Value Share (%) and BPS Analysis by Application, 2022 to 2032 Figure 133: MEA Market Y-o-Y Growth (%) Projections by Application, 2022 to 2032 Figure 134: MEA Market Value (US$ Million) Analysis by End User, 2017 to 2032 Figure 135: MEA Market Value Share (%) and BPS Analysis by End User, 2022 to 2032 Figure 136: MEA Market Y-o-Y Growth (%) Projections by End User, 2022 to 2032 Figure 137: MEA Market Attractiveness by Tools, 2022 to 2032 Figure 138: MEA Market Attractiveness by Application, 2022 to 2032 Figure 139: MEA Market Attractiveness by End User, 2022 to 2032 Figure 140: MEA Market Attractiveness by Country, 2022 to 2032
Recommendations
Explore Healthcare Insights
View Reports