Reports
- Global Locations -
Headquarters
Future Market Insights, Inc.
Christiana Corporate, 200
Continental Drive, Suite 401,
Newark, Delaware - 19713,
United States
Americas
Future Market Insights, Inc.
616 Corporate Way, Suite 2-9018,
Valley Cottage, NY 10989, United States
MEA
Future Market Insights
1602-6 Jumeirah Bay X2 Tower, Plot No: JLT-PH2-X2A,
Jumeirah Lakes Towers, Dubai,
United Arab Emirates
Europe
Future Market Insights
3rd Floor, 207 Regent Street,
W1B 3HH London
United Kingdom
Asia Pacific
Future Market Insights
Office No. 401-A, 4th Floor,
VANTAGE 9, S.No. 36/1/1,
Baner, Pune 411045, India
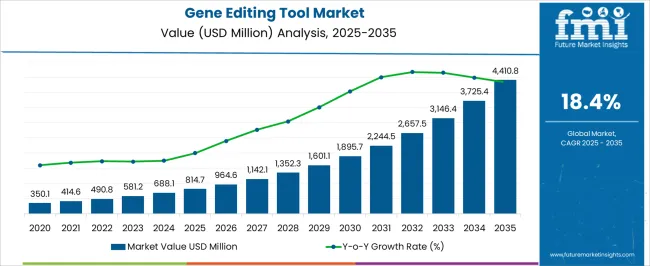
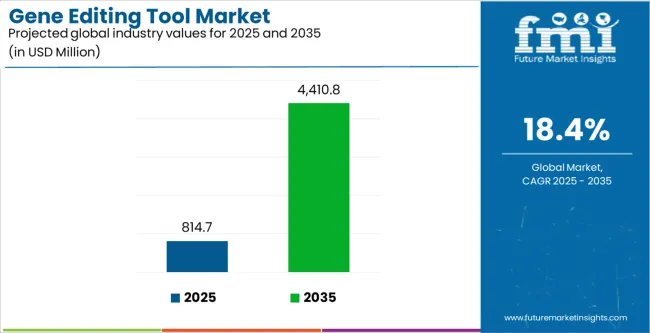
[264 Pages Report] Sales in the global Gene Editing Tools Market are slated to top US$ 481.3 Mn in 2022. Expanding at a healthy 18.8% CAGR, the market size is projected to total US$ 1.6 Bn by 2029.
Attribute | Details |
---|---|
Gene Editing Tools Market Estimated Size 2022 | US$ 481.3 million |
Gene Editing Tools Market Value-based CAGR (2022-2029) | ~ 18.8% |
Gene Editing Tools Market Size in Projected 2029 | US$ 1.6 billion |
The high demand for synthetic genes in various biotechnology domains and the rising implementation of CRISPR DNA editing technology are likely to drive the sales in this market. The rapid development of cutting-edge diagnostic tools to prevent the adverse effects of the COVID-19 pandemic also is anticipated to spur the market in the near future.
The surging applications of genome engineering tools is estimated to intensify the competition between various market players worldwide. Gene editing tools manufacturers are currently focusing on the development of highly adaptable CRISPR editing tools to provide accurate, relatively cost-effective and faster results.
Don't pay for what you don't need
Customize your report by selecting specific countries or regions and save 30%!
Particulars | Details |
---|---|
H1, 2021 | 18.36% |
H1, 2022 Projected | 18.84% |
H1, 2022 Outlook | 17.74% |
BPS Change - H1, 2022 (O) – H1, 2022 (P) | (-) 110 ↓ |
BPS Change – H1, 2022 (O) – H1, 2021 | (-) 62 ↓ |
The comparative analysis and market growth rate of global gene editing tools market as studied by Future Market Insights, will show a negative BPS growth in H1-2022 outlook as compared to H1-2022 projected period by 110 BPS, and, a negative BPS growth is expected in H1-2022 over H1- 2021 duration with 62 Basis Point Share (BPS).
The reduction in the BPS values is associated with the Low editing efficiency and potential toxicity of the currently available delivery systems in gene editing processes. This has found relevance in CRISPR technologies, and is hence a limiting factor for BPS growth.
Conversely, the development of flexible genome editing technologies, and the completion of the Human Genome Project will promote the growth of the overall gene editing tools market, owed to the wide applicability in disease therapeutics, genetic engineering, and basic biomedical research.
The market is highly influenced by the regulatory approvals, ethical guidelines, and innovation factors under the impact of macro and industry factors. The market is subject to developments like, acquisitions and collaborations, and new product development using novel patented technologies. The key developments in the market include the establishment of CRISPR technology, and Retron Library Recombineering (RLR).
The gene editing tools market is expected to register 18.8% CAGR between 2022 and 2029, up from 16.2% CAGR recorded during 2014-2021, predicts Future Market Insights.
The outbreak of the COVID-19 pandemic has resulted in the rapid development of highly effective genome engineering tools to detect genetic variations in the population of viral strains. The U.S. Food and Drug Administration (FDA), issued the ‘Policy for Evaluating Impact of Viral Mutations on COVID-19 Tests’ in February 2021 to deliver recommendations and policies on investigating the potential impact of future and emerging viral mutations of SARS-CoV-2.
Similarly, in March 2021, a team of scientists at the Nanyang Technological University, Singapore, developed a diagnostic test for detecting the virus that causes COVID-19 even after it undergoes mutations. The test is called VaNGuard and it makes use of CRISPR. In a clinical setting, it can be used on crude patient samples without the requirement of RNA purification.
In May 2020, researchers at the Broad Institute of MIT and Harvard have also unveiled a protocol for utilizing the CRISPR-based Specific High Sensitivity Enzymatic Reporter Unlocking (SHERLOCK) technique to detect COVID-19. This novel technique uses synthetic COVID-19 virus RNA fragments for the detection of the COVID-19 target sequences. It can discover these sequences in a range between 20 and 200 aM. Thus, the ongoing development of various CRISPR editing tools by research and educational institutions is likely to propel the market.
The consistent technological advancement in the field of genome engineering tools is projected to drive the market over the forthcoming years. Several biotechnology companies are striving to launch remarkably powerful, precise, easy-to-use, and affordable genome editing techniques to transform the biological research domain.
In April 2021, for instance, six UMass Medical School scientists published a paper in Nature, a prominent research community, to describe the Somatic Cell Genome Editing Consortium’s goals to benchmark and augment the development of effective and safer methods of editing the genomes. The consortium is led by the National Institutes of Health and aims to find out better genome editing tools to edit disease-relevant somatic cells in patients. Spurred by similar other innovations, the demand for these tools is expected to surge in the upcoming years.
The rising awareness regarding the availability of genetically modified animals and crops is set to have a positive impact on the sales of genome editing tools. The increasing focus of various manufacturers on the development of biologics by utilizing synthetic genes and newer biosynthetic pathways in microorganisms is another crucial factor which is expected to propel the market.
“U.S. Market will Pick up Pace as Scientists are Developing New Genome Editing Techniques”
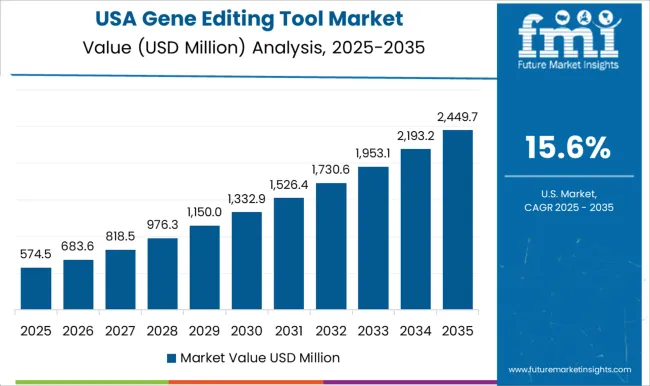
The presence of a robust commercial and research base for the development of advanced therapies is likely to drive the demand for precise genome editing tools in the U.S. The rising number of clinical trials that are being conducted to introduce state-of-the-art stem cell and gene therapies would also propel the demand in the U.S.
In May 2021, researchers at Harvard's Wyss Institute for Biologically Inspired Engineering successfully developed the Retron Library Recombineering (RLR) technique, its new genome editing technique. It would allow scientists to perform millions of genetic experiments simultaneously. Driven by such innovations, the market in the U.S. is set to prosper in the near future.
“Government is Allowing CRISPR DNA Editing of Crops to Enhance Production”
The increasing research activities in the field of gene editing and the rising need to enhance agricultural production in the U.K. are anticipated to spur the Europe market. The surging prevalence of rare diseases in the country is another significant factor that is projected to aid the growth.
For instance, in January 2022, the U.K. government declared that gene editing will result in the development of climate crisis resistant crops. Research activities related to CRISPR DNA editing of plants in the country will become easier than ever owing to the new norms implemented by the government. These regulations are expected to encourage various development efforts, such as field trials. The rising government support to augment the usage of genome engineering tools is estimated to drive the market in the U.K.
“CRISPR Editing Tools are used by Scientists in Japan to Develop Novel Fruits and Vegetables”
The surging focus of many food and agriculture companies operating in Japan on the development of genome edited fruits and vegetables is likely to push the market in East Asia. These companies are striving to unveil new products equipped with beneficial properties to prevent diseases and keep an individual healthy if consumed.
Sanatech Seed launched the first direct consumption genome-edited tomato in Japan in March 2021. Followed by the launch, the Japanese ministries mentioned that the tomatoes will not be regulated as a genetically modified product. These were developed with the help of CRISPR editing tools and contain high levels of an amino acid named gamma-aminobutyric acid (GABA). It would help in lowering the blood pressure and accelerate the feeling of relaxation. The high demand for novel food products from consumers is set to bolster the market in Japan.
“Need to Discover New Treatment Options to Spur Demand for CRISPR Genome Engineering Tools”
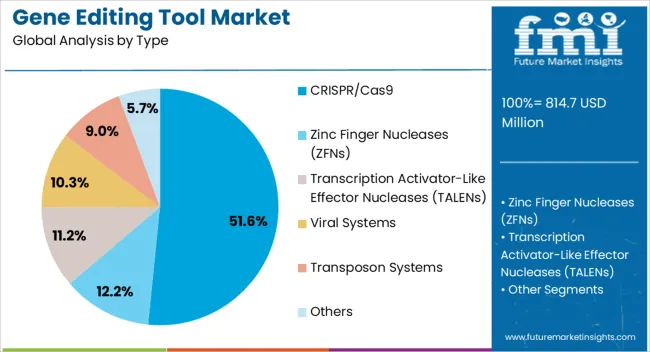
Based on product type, the Clustered Regularly Interspaced Short Palindromic Repeats (CRISPR/Cas9) segment is set to lead the gene editing tools market in the upcoming years. This growth is attributable to the increasing usage of CRISPR DNA editing in human-induced pluripotent stem cells (hiPSCs) associated programs for discovering new treatment options of numerous diseases.
This technology is also expected to be utilized for improving the productivity of CHO cell lines. These cell lines are extensively applied in the production of large molecule therapeutics and their high demand is anticipated to propel the sales of CRISPR genome engineering tools.
“Cell Line Engineering is the Most Preferred Application of Genome Editing Techniques”
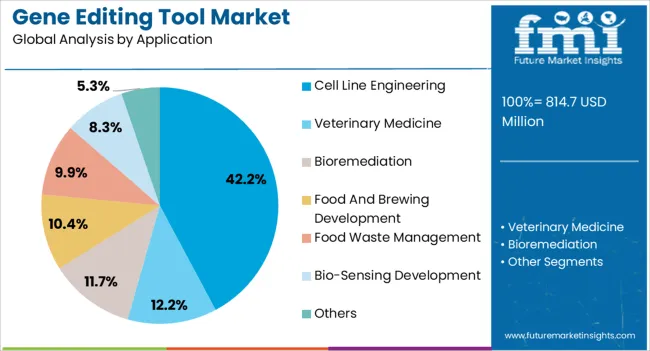
In terms of application, the cell line engineering segment is estimated to account for around 41.6% of the gene editing tools market share in 2022, predicts FMI. The rising application of cell line engineering technology in stem cell research is projected to push the segment in the forthcoming years.
These are utilized for induced pluripotent stem cells (iPSCs) that help in modifying the cell genetically, thereby resulting in the rapid development of iPSCs lines. The emergence of cutting-edge genome editing techniques, such as ZFNs, TALENs, and CRISPR/Cas have made cell engineering cost-effective and convenient, which would help in propelling the segment.
“Biotech and Pharma Companies are Collaborating to Develop Precise Genome Editing Tools”
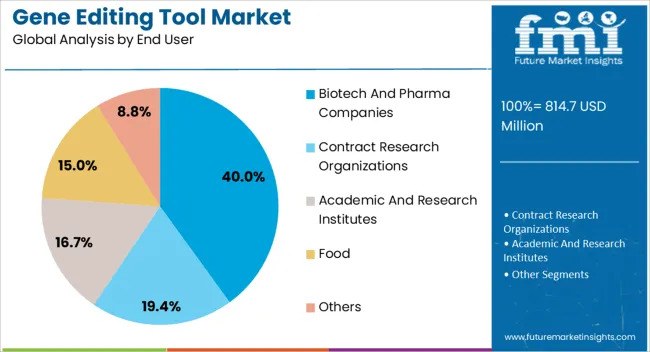
By end user, the biotech and pharma companies segment is likely to dominate in the near future by generating the largest gene editing tools market share in 2029. This growth is attributable to the surging number of research activities happening across the globe among these companies for developing novel therapeutics.
Numerous international pharmaceutical companies are anticipated to join hands with start-up firms to create innovative technologies, which is set to drive the sales of precise genome editing tools. For instance, in April 2021, CANbridge Pharmaceuticals, Inc., which is a renowned biopharmaceutical company, collaborated with LogicBio Therapeutics, Inc., a clinical-stage genetic medicine company.
This partnership would enable the former to get an exclusive license for an investigational in-vivo gene editing technology named LB-001. The technology is based on the latter’s GeneRide platform for the treatment of methylmalonic acidemia (MMA). The development of such products owing to the increasing partnerships among biotech and pharma companies are projected to bolster the demand for precise genome editing techniques.
Get the data you need at a Fraction of the cost
Personalize your report by choosing insights you need
and save 40%!
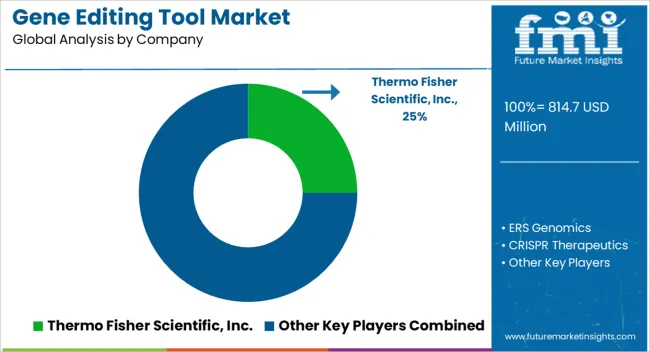
Most of the leading players operating in the global market are focusing on investing in innovative genome engineering tools to cater to the increasing research requirements. Owing to the surging progress in several in vitro cellular and molecular techniques, the research area in genomics is projected to exhibit rapid development. Meanwhile, some of the other key players are undertaking licensing agreements with reputed developers of technology to strengthen their positions in the market.
For instance,
Attribute | Details |
---|---|
Forecast Period | 2014-2021 |
Historical Data Available for | 2022-2029 |
Market Analysis | Units for Volume and US$ Bn for Value |
Key Regions Covered | North America, Latin America, Europe, East Asia, South Asia, Oceania, and the Middle East & Africa. |
Key Countries Covered | United States, Canada, Brazil, Mexico, Germany, UK, France, Italy, Spain, Nordic, Russia, Poland, China, India, Thailand, Indonesia, Australia and New Zealand, Japan, GCC countries, North Africa, South Africa, others. |
Key Market Segments Covered | Product, Application, End User, and Region |
Key Companies Profiled |
|
Pricing | Available upon Request |
BY Product:
BY Application:
BY End User:
BY Region:
1. Executive Summary 1.1. Global Market Outlook 1.2. Demand Side Trends 1.3. Supply Side Trends 1.4. Analysis and Recommendations 2. Market Overview 2.1. Market Coverage / Taxonomy 2.2. Market Definition / Scope / Limitations 3. Key Market Trends 3.1. Key Trends Impacting the Market 3.2. Products Innovation / Key Development Trends 3.3. Product Strategies by Key Manufacturers 4. Key Success Factors 4.1. Product Adoption / Usage Analysis 4.2. Demand for Animal Productivity, Breeding and Therapeutics 4.3. Demand for Livestock Products 4.4. Advancement in Bioremediation and Waste Management 5. Global Market Demand (in Value or Size in US$ Mn) Analysis 2014-2021 and Forecast, 2022-2029 5.1. Historical Market Value (US$ Mn) Analysis, 2014-2021 5.2. Current and Future Market Value (US$ Mn) Projections, 2022-2029 5.2.1. Y-o-Y Growth Trend Analysis 5.2.2. Absolute $ Opportunity Analysis 6. Market Background 6.1. Macro-Economic Factors 6.1.1. Global GDP Growth Outlook 6.1.2. Global Healthcare Expenditure Outlook 6.1.3. R&D Investment Outlook 6.2. Forecast Factors - Relevance & Impact 6.2.1. Increase in R&D Funding and Grants 6.2.2. Increase in Number of Patents Filed 6.2.3. New Product Launches 6.2.4. Investment by Venture Capitalists in Early Stage Biotechs 6.3. Market Dynamics 6.3.1. Drivers 6.3.2. Restraints 6.3.3. Opportunity Analysis 7. Application of in Emerging Areas – Review 7.1. Introduction 7.2. Market Size (US$ Mn) Analysis and Forecast 2022-2029, by Application Area 7.2.1. Veterinary Medicine 7.2.1.1. Animal Therapeutic Products 7.2.1.2. Animal Vaccine Products 7.2.2. Genetic Engineering for Livestock Improvement 7.2.3. Synthetic Biology 7.2.4. Bioremediation 7.2.5. Biosecurity 7.3. Penetration of (%), by Emerging Application Areas 7.3.1. Veterinary Medicine 7.3.2. Genetic Engineering for Livestock Improvement 7.3.3. Synthetic Biology 7.3.4. Bioremediation 7.3.5. Biosecurity 7.4. Penetration of CRISPR (%), by Emerging Application Areas 7.4.1. Veterinary Medicine 7.4.2. Genetic Engineering for Livestock Improvement 7.4.3. Synthetic Biology 7.4.4. Bioremediation 7.4.5. Biosecurity 7.5. Key Trends and Takeaways 8. Global Market Analysis 2014-2021 and Forecast, 2022-2029 By Product Type 8.1. Introduction / Key Findings 8.2. Historical Market Size (US$ Mn) Analysis By Product Type, 2014 - 2021 8.3. Current and Future Market Size (US$ Mn) Analysis and Forecast By Gen Editing Type, 2022-2029 8.3.1. Loss of Function 8.3.2. Gain of Function 8.4. Market Attractiveness Analysis By Product Type 9. Global Market Analysis 2014-2021 and Forecast, 2022-2029, by Application 9.1. Introduction / Key Findings 9.2. Historical Market Size (US$ Mn) and Volume Analysis By Application, 2014 - 2021 9.3. Current and Future Market Size (US$ Mn) Analysis and Forecast By Application, 2022-2029 9.3.1. Veterinary Medicine 9.3.2. Cell Line Engineering 9.3.3. Bioremediation 9.3.4. Food and Brewing Development 9.3.5. Food Waste Management 9.3.6. Bio sensing Development 9.3.7. Others 9.4. Market Attractiveness Analysis By Application 10. Global Market Analysis 2014-2021 and Forecast, 2022-2029, by End User 10.1. Introduction / Key Findings 10.2. Historical Market Size (US$ Mn) By End User, 2014 - 2021 10.3. Current and Future Market Size (US$ Mn) Analysis and Forecast By End User, 2022-2029 10.3.1. Biotech and Pharma Companies 10.3.2. Contract Research Organizations 10.3.3. Academic and Research Institutes 10.3.4. Food Industry 10.3.5. Others 10.4. Market Attractiveness Analysis By End User 11. Global Market Analysis 2014-2021 and Forecast, 2022-2029, by Region 11.1. Introduction 11.2. Historical Market Size (US$ Mn) Analysis By Region, 2014 - 2021 11.3. Current Market Size (US$ Mn) Analysis and Forecast By Region, 2022-2029 11.3.1. North America 11.3.2. Latin America 11.3.3. Europe 11.3.4. East Asia 11.3.5. South Asia 11.3.6. Oceania 11.3.7. MEA 11.4. Market Attractiveness Analysis By Region 12. North America Market Analysis 2014-2021 and Forecast, 2022-2029 12.1. Introduction 12.2. Historical Market Size (US$ Mn) Trend Analysis By Market Taxonomy, 2014 - 2021 12.3. Market Size (US$ Mn) Forecast By Market Taxonomy, 2022-2029 12.3.1. By Country 12.3.1.1. U.S. 12.3.1.2. Canada 12.3.2. By Product Type 12.3.3. By Application Type 12.3.4. By Technology 12.3.5. By End User 12.4. Market Attractiveness Analysis 13. Latin America Market Analysis 2014-2021 and Forecast, 2022-2029 13.1. Introduction 13.2. Historical Market Size (US$ Mn) Trend Analysis By Market Taxonomy, 2014 - 2021 13.3. Market Size (US$ Mn) Forecast By Market Taxonomy, 2022-2029 13.3.1. By Country 13.3.1.1. Brazil 13.3.1.2. Mexico 13.3.1.3. Rest of Latin America 13.3.2. By Product Type 13.3.3. By Application Type 13.3.4. By Technology 13.3.5. By End User 13.4. Market Attractiveness Analysis 14. Europe Market Analysis 2014-2021 and Forecast, 2022-2029 14.1. Introduction 14.2. Historical Market Size (US$ Mn) Trend Analysis By Market Taxonomy, 2014 - 2021 14.3. Market Size (US$ Mn) Forecast By Market Taxonomy, 2022-2029 14.3.1. By Country 14.3.1.1. Germany 14.3.1.2. Italy 14.3.1.3. France 14.3.1.4. U.K. 14.3.1.5. Spain 14.3.1.6. BENELUX 14.3.1.7. Russia 14.3.1.8. Rest of Europe 14.3.2. By Product Type 14.3.3. By Application Type 14.3.4. By Technology 14.3.5. By End User 14.4. Market Attractiveness Analysis 15. East Asia Market Analysis 2014-2021 and Forecast, 2022-2029 15.1. Introduction 15.2. Historical Market Size (US$ Mn) Trend Analysis By Market Taxonomy, 2014 - 2021 15.3. Market Size (US$ Mn) Forecast By Market Taxonomy, 2022-2029 15.3.1. By Country 15.3.1.1. C China 15.3.1.2. Japan 15.3.1.3. South Korea 15.3.2. By Product Type 15.3.3. By Application Type 15.3.4. By Technology 15.3.5. By End User 15.4. Market Attractiveness Analysis 16. South Asia Analysis 2014-2021 and Forecast, 2022-2029 16.1. Introduction 16.2. Historical Market Size (US$ Mn) Trend Analysis By Market Taxonomy, 2014 - 2021 16.3. Market Size (US$ Mn) Forecast By Market Taxonomy, 2022-2029 16.3.1. By Country 16.3.1.1. India 16.3.1.2. Thailand 16.3.1.3. Indonesia 16.3.1.4. Malaysia 16.3.1.5. Rest of South Asia 16.3.2. By Product Type 16.3.3. By Application Type 16.3.4. By Technology 16.3.5. By End User 16.4. Market Attractiveness Analysis 17. Oceania Market Analysis 2014-2021 and Forecast, 2022-2029 17.1. Introduction 17.2. Historical Market Size (US$ Mn) Trend Analysis By Market Taxonomy, 2014 - 2021 17.3. Market Size (US$ Mn) Forecast By Market Taxonomy, 2022-2029 17.3.1. By Country 17.3.1.1. Australia 17.3.1.2. New Zealand 17.3.2. By Product Type 17.3.3. By Application Type 17.3.4. By Technology 17.3.5. By End User 17.4. Market Attractiveness Analysis 18. Middle East and Africa Market Analysis 2014-2021 and Forecast, 2022-2029 18.1. Introduction 18.2. Historical Market Size (US$ Mn) Trend Analysis By Market Taxonomy, 2014 - 2021 18.3. Market Size (US$ Mn) Forecast By Market Taxonomy, 2022-2029 18.3.1. By Country 18.3.1.1. GCC Countries 18.3.1.2. Turkey 18.3.1.3. Northern Africa 18.3.1.4. South Africa 18.3.1.5. Rest of Middle East and Africa 18.3.2. By Product Type 18.3.3. By Application Type 18.3.4. By Technology 18.3.5. By End User 18.4. Market Attractiveness Analysis 19. Market Structure Analysis 19.1. Market Analysis by Tier of Companies 19.2. Market Share Analysis of Top Players 20. Competition Analysis 20.1. Competition Dashboard 20.2. Competition Deep Dive 20.2.1. Thermo Fisher Scientific, Inc. 20.2.1.1. Overview 20.2.1.2. Product Portfolio 20.2.1.3. Sales Footprint 20.2.1.4. Analysis Commentary 20.2.2. ERS Genomics 20.2.3. CRISPR THERAPEUTICS 20.2.4. Merck KGaA 20.2.5. Editas Medicine 20.2.6. GE Healthcare Dharmacon Inc. 20.2.7. Takara Bio USA 20.2.8. New England Biolabs 20.2.9. Horizon Discovery Group plc 20.2.10. Intellia Therapeutics, Inc. 20.2.11. GenScript Biotech Corporation 21. Assumptions and Acronyms Used 22. Research Methodology
Don't pay for what you don't need
Customize your report by selecting specific countries or regions and save 30%!
Table 01: Global Key Company and Product Mapping Table 02: Estimates of Funding Offered by NIH for Various Research, Condition, and Disease Categories (RCDC), 2015-2022 Table 03: Estimates of Funding Offered by NIH for Various Research, Condition, and Disease Categories (RCDC), 2015-2022 Table 04: Estimates of Funding Offered by NIH for Various Research, Condition, and Disease Categories (RCDC), 2015-2022 Table 05: Estimates of Funding Offered by NIH for Various Research, Condition, and Disease Categories (RCDC), 2015-2022 Table 06: Estimated Number of Deaths for the Four Major Cancers by Sex and Age Group, 2017 Table 07: Estimated Volume for Beef and Veal Production - by Region and Countries, 2017 Table 08: Estimated Volume for Beef and Veal Consumption - by Region and Countries, 2017 Table 09: Estimated Volume for Cattle Stocks (in 1,000 head) - by Region and Countries, 2017 Table 10: Estimated Volume for Production (Calf Crop) - by Region and Countries, 2017 Table 11: Estimated Volume for Pork Production - by Region and Countries, 2017 Table 12: Estimated Volume for Pork Consumption - by Region and Countries, 2017 Table 13: Estimated Volume for Swine Stocks (in 1,000 head) - by Region and Countries, 2017 Table 14: Estimated Volume for Production (Pig Crop) - by Region and Countries, 2017 Table 15: Estimated Volume for Chicken Stocks (in 1,000 head) - by Region and Countries, 2017 Table 16: Global Market size (US$ Mn) Analysis 2014–2021 and forecast 2022–2029, By Product Type Table 17: Global Market size (US$ Mn) Analysis 2014–2021 and forecast 2022–2029, By Application Table 18: Global Market size (US$ Mn) Analysis 2014–2021 and forecast 2022–2029, By End User Table 19: Global Market size (US$ Mn) Analysis 2014–2021 and forecast 2022–2029, By Region Table 20: North America Market size (US$ Mn) Analysis 2014–2021 and forecast 2022–2029, By Country Table 21: North America Market size (US$ Mn) Analysis 2014–2021 and forecast 2022–2029, By Product Type Table 22: North America Market size (US$ Mn) Analysis 2014–2021 and forecast 2022–2029, By Application Table 23: North America Market size (US$ Mn) Analysis 2014–2021 and forecast 2022–2029, By End User Table 24: Latin America Market size (US$ Mn) Analysis 2014–2021 and forecast 2022–2029, By Country Table 25: Latin America Market size (US$ Mn) Analysis 2014–2021 and forecast 2022–2029, By Product Type Table 26: Latin America Market size (US$ Mn) Analysis 2014–2021 and forecast 2022–2029, By Application Table 27: Latin America Market size (US$ Mn) Analysis 2014–2021 and forecast 2022–2029, By End User Table 28: Europe Market size (US$ Mn) Analysis 2014–2021 and forecast 2022–2029, By Country Table 29: Europe Market size (US$ Mn) Analysis 2014–2021 and forecast 2022–2029, By Product Type Table 30: Europe Market size (US$ Mn) Analysis 2014–2021 and forecast 2022–2029, By Application Table 31: Europe Market size (US$ Mn) Analysis 2014–2021 and forecast 2022–2029, By End User Table 32: East Asia Market size (US$ Mn) Analysis 2014–2021 and forecast 2022–2029, By Country Table 33: East Asia Market size (US$ Mn) Analysis 2014–2021 and forecast 2022–2029, By Product Type Table 34: East Asia Market size (US$ Mn) Analysis 2014–2021 and forecast 2022–2029, By Application Table 35: East Asia Market size (US$ Mn) Analysis 2014–2021 and forecast 2022–2029, By End User Table 36: South Asia Market size (US$ Mn) Analysis 2014–2021 and forecast 2022–2029, By Country Table 37: South Asia Market size (US$ Mn) Analysis 2014–2021 and forecast 2022–2029, By Product Type Table 38: South Asia Market size (US$ Mn) Analysis 2014–2021 and forecast 2022–2029, By Application Table 39: South Asia Market size (US$ Mn) Analysis 2014–2021 and forecast 2022–2029, By End User Table 40: Oceania Market size (US$ Mn) Analysis 2014–2021 and forecast 2022–2029, By Country Table 41: Oceania Market size (US$ Mn) Analysis 2014–2021 and forecast 2022–2029, By Product Type Table 42: Oceania Market size (US$ Mn) Analysis 2014–2021 and forecast 2022–2029, By Application Table 43: Oceania Market size (US$ Mn) Analysis 2014–2021 and forecast 2022–2029, By End User Table 44: MEA Market size (US$ Mn) Analysis 2014–2021 and forecast 2022–2029, By Country Table 45: MEA Market size (US$ Mn) Analysis 2014–2021 and forecast 2022–2029, By Product Type Table 46: MEA Market size (US$ Mn) Analysis 2014–2021 and forecast 2022–2029, By Application Table 47: MEA Market size (US$ Mn) Analysis 2014–2021 and forecast 2022–2029, By End User
Figure 01: CRISPR-Based Gene Editing Kits (US$), By Region (2017) Figure 02: Global Market Value (US$ Mn) & Y-o-Y Growth (%), 2014–2029 Figure 03: Global Market Absolute $ Opportunity (US$ Mn), 2021–2029 Figure 04: Exponential Increase in CRISPR-related U.S. patent Filings, Number of Patents Filed and Published Applications Figure 05: Global Number of Patents and Other Intellectual Properties Associated with CRISPR Gene Editing, Acquired by Companies & Universities, 2021 Figure 06: Penetration of (%), by Emerging Application Areas Figure 07: Global Market Share Analysis (%) By Product Type, 2022 & 2029 Figure 08: Global Market Y-o-Y Growth (%) By Product Type, 2022–2029 Figure 09: Global Market Value, 2014–2021, Clustered Regularly Interspaced Short Palindromic Repeats (CRISPR/Cas9) Figure 10: Global Market Value, Forecast & Y-o-Y Growth (%), 2022–2029, Clustered Regularly Interspaced Short Palindromic Repeats (CRISPR/Cas9) Figure 11: Global Market Value, 2014–2021, Zinc Finger Nucleases (ZFNs) Figure 12: Global Market Value, Forecast & Y-o-Y Growth (%), 2022–2029, Zinc Finger Nucleases (ZFNs) Figure 13: Global Market Value, 2014–2021, Transcription Activator-Like Effector Nucleases (TALENs) Figure 14: Global Market Value, Forecast & Y-o-Y Growth (%), 2022–2029, Transcription Activator-Like Effector Nucleases (TALENs) Figure 15: Global Market Value, 2014–2021, Viral Systems Figure 16: Global Market Value, Forecast & Y-o-Y Growth (%), 2022–2029, Viral Systems Figure 17: Global Market Value, 2014–2021, Transposon Systems Figure 18: Global Market Value, Forecast & Y-o-Y Growth (%), 2022–2029, Transposon Systems Figure 19: Global Market Value, 2014–2021, Others Figure 20: Global Market Value, Forecast & Y-o-Y Growth (%), 2022–2029, Others Figure 21: Global Market Attractiveness Analysis By Product Type, 2022–2029 Figure 22: Global Market Share Analysis (%) By Application, 2022 & 2029 Figure 23: Global Market Y-o-Y Growth (%) By Application, 2022–2029 Figure 24: Global Market Value, 2014–2021, Veterinary Medicine Figure 25: Global Market Value, Forecast & Y-o-Y Growth (%), 2022–2029, Veterinary Medicine Figure 26: Global Market Value, 2014–2021, Cell Line Engineering Figure 27: Global Market Value, Forecast & Y-o-Y Growth (%), 2022–2029, Cell Line Engineering Figure 28: Global Market Value, 2014–2021, Bioremediation Figure 29: Global Market Value, Forecast & Y-o-Y Growth (%), 2022–2029, Bioremediation Figure 30: Global Market Value, 2014–2021, Food and Brewing Development Figure 31: Global Market Value, Forecast & Y-o-Y Growth (%), 2022–2029, Food and Brewing Development Figure 32: Global Market Value, 2014–2021, Food Waste Management Figure 33: Global Market Value, Forecast & Y-o-Y Growth (%), 2022–2029, Food Waste Management Figure 34: Global Market Value, 2014–2021, Bio Sensing Development Figure 35: Global Market Value, Forecast & Y-o-Y Growth (%), 2022–2029, Bio Sensing Development Figure 36: Global Market Value, 2014–2021, Others Figure 37: Global Market Value, Forecast & Y-o-Y Growth (%), 2022–2029, Others Figure 38: Global Market Attractiveness Analysis By Application, 2022–2029 Figure 39: Global Market Share Analysis (%) By End User, 2022 & 2029 Figure 40: Global Market Y-o-Y Growth (%) By End User, 2022–2029 Figure 41: Global Market Value, 2014–2021, Biotech and Pharma Companies Figure 42: Global Market Value, Forecast & Y-o-Y Growth (%), 2022–2029, Biotech and Pharma Companies Figure 43: Global Market Value, 2014–2021, Contract Research Organizations Figure 44: Global Market Value, Forecast & Y-o-Y Growth (%), 2022–2029, Contract Research Organizations Figure 45: Global Market Value, 2014–2021, Academic and Research Institutes Figure 46: Global Market Value, Forecast & Y-o-Y Growth (%), 2022–2029, Academic and Research Institutes Figure 47: Global Market Value, 2014–2021, Food Industry Figure 48: Global Market Value, Forecast & Y-o-Y Growth (%), 2022–2029, Food Industry Figure 49: Global Market Value, 2014–2021, Others Figure 50: Global Market Value, Forecast & Y-o-Y Growth (%), 2022–2029, Others Figure 51: Global Market Attractiveness Analysis By End User, 2022–2029 Figure 52: Global Market Share Analysis (%) By Region, 2022 & 2029 Figure 53: Global Market Y-o-Y Growth (%) By Region, 2022–2029 Figure 54: Global Market Attractiveness Analysis By Region, 2022–2029 Figure 55: North America Market, by Product Type (2021) Figure 56: North America Market, Snapshot Figure 57: North America Market, by Application (2021) Figure 58: North America Market, by Country (2021) Figure 59: North America Market, by End User (2021) Figure 60: North America Market Size (US$ Mn) Analysis, 2014–2021 Figure 61: North America Market Size (US$ Mn) Forecast & Y-o-Y Growth (%), 2022–2029 Figure 62: North America Market Value, 2014–2021, Clustered Regularly Interspaced Short Palindromic Repeats (CRISPR/Cas9) Figure 63: North America Market Value, Forecast & Y-o-Y Growth (%), 2022–2029, Clustered Regularly Interspaced Short Palindromic Repeats (CRISPR/Cas9) Figure 64: North America Market Value, 2014–2021, Zinc Finger Nucleases (ZFNs) Figure 65: North America Market Value, Forecast & Y-o-Y Growth (%), 2022–2029, Zinc Finger Nucleases (ZFNs) Figure 66: North America Market Value, 2014–2021, Transcription Activator-Like Effector Nucleases (TALENs) Figure 67: North America Market Value, Forecast & Y-o-Y Growth (%), 2022–2029, Transcription Activator-Like Effector Nucleases (TALENs) Figure 68: North America Market Value, 2014–2021, Viral Systems Figure 69: North America Market Value, Forecast & Y-o-Y Growth (%), 2022–2029, Viral Systems Figure 70: North America Market Value, 2014–2021, Transposon Systems Figure 71: North America Market Value, Forecast & Y-o-Y Growth (%), 2022–2029, Transposon Systems Figure 72: North America Market Value, 2014–2021, Others Figure 73: North America Market Value, Forecast & Y-o-Y Growth (%), 2022–2029, Others Figure 74: North America Market Attractiveness Analysis, By Country (2022-2029) Figure 75: North America Market Attractiveness Analysis, By Product Type (2022-2029) Figure 76: North America Market Attractiveness Analysis, By Application (2022-2029) Figure 77: North America Market Attractiveness Analysis, By End User (2022-2029) Figure 78: Latin America Market, by Product Type (2021) Figure 79: Latin America Market, Snapshot Figure 80: Latin America Market, by Application (2021) Figure 81: Latin America Market, by Country (2021) Figure 82: Latin America Market, by End User (2021) Figure 83: Latin America Market Size (US$ Mn) Analysis, 2014–2021 Figure 84: Latin America Market Size (US$ Mn) Forecast & Y-o-Y Growth (%), 2022–2029 Figure 85: Latin America Market Value, 2014–2021, Clustered Regularly Interspaced Short Palindromic Repeats (CRISPR/Cas9) Figure 86: Latin America Market Value, Forecast & Y-o-Y Growth (%), 2022–2029, Clustered Regularly Interspaced Short Palindromic Repeats (CRISPR/Cas9) Figure 87: Latin America Market Value, 2014–2021, Zinc Finger Nucleases (ZFNs) Figure 88: Latin America Market Value, Forecast & Y-o-Y Growth (%), 2022–2029, Zinc Finger Nucleases (ZFNs) Figure 89: Latin America Market Value, 2014–2021, Transcription Activator-Like Effector Nucleases (TALENs) Figure 90: Latin America Market Value, Forecast & Y-o-Y Growth (%), 2022–2029, Transcription Activator-Like Effector Nucleases (TALENs) Figure 91: Latin America Market Value, 2014–2021, Viral Systems Figure 92: Latin America Market Value, Forecast & Y-o-Y Growth (%), 2022–2029, Viral Systems Figure 93: Latin America Market Value, 2014–2021, Transposon Systems Figure 94: Latin America Market Value, Forecast & Y-o-Y Growth (%), 2022–2029, Transposon Systems Figure 95: Latin America Market Value, 2014–2021, Others Figure 96: Latin America Market Value, Forecast & Y-o-Y Growth (%), 2022–2029, Others Figure 97: Latin America Market Attractiveness Analysis, By Country (2022-2029) Figure 98: Latin America Market Attractiveness Analysis, By Product Type (2022-2029) Figure 99: Latin America Market Attractiveness Analysis, By Application (2022-2029) Figure 100: Latin America Market Attractiveness Analysis, By End User (2022-2029) Figure 101: Europe Market, by Product Type (2021) Figure 102: Europe Market, Snapshot Figure 103: Europe Market, by Application (2021) Figure 104: Europe Market, by Country (2021) Figure 105: Europe Market, by End User (2021) Figure 106: Europe Market Size (US$ Mn) Analysis, 2014–2021 Figure 107: Europe Market Size (US$ Mn) Forecast & Y-o-Y Growth (%), 2022–2029 Figure 108: Europe Market Value, 2014–2021, Clustered Regularly Interspaced Short Palindromic Repeats (CRISPR/Cas9) Figure 109: Europe Market Value, Forecast & Y-o-Y Growth (%), 2022–2029, Clustered Regularly Interspaced Short Palindromic Repeats (CRISPR/Cas9) Figure 110: Europe Market Value, 2014–2021, Zinc Finger Nucleases (ZFNs) Figure 111: Europe Market Value, Forecast & Y-o-Y Growth (%), 2022–2029, Zinc Finger Nucleases (ZFNs) Figure 112: Europe Market Value, 2014–2021, Transcription Activator-Like Effector Nucleases (TALENs) Figure 113: Europe Market Value, Forecast & Y-o-Y Growth (%), 2022–2029, Transcription Activator-Like Effector Nucleases (TALENs) Figure 114: Europe Market Value, 2014–2021, Viral Systems Figure 115: Europe Market Value, Forecast & Y-o-Y Growth (%), 2022–2029, Viral Systems Figure 116: Europe Market Value, 2014–2021, Transposon Systems Figure 117: Europe Market Value, Forecast & Y-o-Y Growth (%), 2022–2029, Transposon Systems Figure 118: Europe Market Value, 2014–2021, Others Figure 119: Europe Market Value, Forecast & Y-o-Y Growth (%), 2022–2029, Others Figure 120: Europe Market Attractiveness Analysis, By Country (2022-2029) Figure 121: Europe Market Attractiveness Analysis, By Product Type (2022-2029) Figure 122: Europe Market Attractiveness Analysis, By Application (2022-2029) Figure 123: Europe Market Attractiveness Analysis, By End User (2022-2029) Figure 124: East Asia Market, by Product Type (2021) Figure 125: East Asia Market, Snapshot Figure 126: East Asia Market, by Application (2021) Figure 127: East Asia Market, by Country (2021) and (2029) Figure 128: East Asia Market, by End User (2021) Figure 129: East Asia Market Size (US$ Mn) Analysis, 2014–2021 Figure 130: East Asia Market Size (US$ Mn) Forecast & Y-o-Y Growth (%), 2022–2029 Figure 131: East Asia Market Value, 2014–2021, Clustered Regularly Interspaced Short Palindromic Repeats (CRISPR/Cas9) Figure 132: East Asia Market Value, Forecast & Y-o-Y Growth (%), 2022–2029, Clustered Regularly Interspaced Short Palindromic Repeats (CRISPR/Cas9) Figure 133: East Asia Market Value, 2014–2021, Zinc Finger Nucleases (ZFNs) Figure 134: East Asia Market Value, Forecast & Y-o-Y Growth (%), 2022–2029, Zinc Finger Nucleases (ZFNs) Figure 135: East Asia Market Value, 2014–2021, Transcription Activator-Like Effector Nucleases (TALENs) Figure 136: East Asia Market Value, Forecast & Y-o-Y Growth (%), 2022–2029, Transcription Activator-Like Effector Nucleases (TALENs) Figure 137: East Asia Market Value, 2014–2021, Viral Systems Figure 138: East Asia Market Value, Forecast & Y-o-Y Growth (%), 2022–2029, Viral Systems Figure 139: East Asia Market Value, 2014–2021, Transposon Systems Figure 140: East Asia Market Value, Forecast & Y-o-Y Growth (%), 2022–2029, Transposon Systems Figure 141: East Asia Market Value, 2014–2021, Others Figure 142: East Asia Market Value, Forecast & Y-o-Y Growth (%), 2022–2029, Others Figure 143: East Asia Market Attractiveness Analysis, By Country (2022-2029) Figure 144: East Asia Market Attractiveness Analysis, By Product Type (2022-2029) Figure 145: East Asia Market Attractiveness Analysis, By Application (2022-2029) Figure 146: East Asia Market Attractiveness Analysis, By End User (2022-2029) Figure 147: South Asia Market, by Product Type (2021) Figure 148: South Asia Market, Snapshot Figure 149: South Asia Market, by Application (2021) Figure 150: South Asia Market, by Country (2021) and (2029) Figure 151: South Asia Market, by End User (2021) Figure 152: South Asia Market Size (US$ Mn) Analysis, 2014–2021 Figure 153: South Asia Market Size (US$ Mn) Forecast & Y-o-Y Growth (%), 2022–2029 Figure 154: South Asia Market Value, 2014–2021, Clustered Regularly Interspaced Short Palindromic Repeats (CRISPR/Cas9) Figure 155: South Asia Market Value, Forecast & Y-o-Y Growth (%), 2022–2029, Clustered Regularly Interspaced Short Palindromic Repeats (CRISPR/Cas9) Figure 156: South Asia Market Value, 2014–2021, Zinc Finger Nucleases (ZFNs) Figure 157: South Asia Market Value, Forecast & Y-o-Y Growth (%), 2022–2029, Zinc Finger Nucleases (ZFNs) Figure 158: South Asia Market Value, 2014–2021, Transcription Activator-Like Effector Nucleases (TALENs) Figure 159: South Asia Market Value, Forecast & Y-o-Y Growth (%), 2022–2029, Transcription Activator-Like Effector Nucleases (TALENs) Figure 160: South Asia Market Value, 2014–2021, Viral Systems Figure 161: South Asia Market Value, Forecast & Y-o-Y Growth (%), 2022–2029, Viral Systems Figure 162: South Asia Market Value, 2014–2021, Transposon Systems Figure 163: South Asia Market Value, Forecast & Y-o-Y Growth (%), 2022–2029, Transposon Systems Figure 164: South Asia Market Value, 2014–2021, Others Figure 165: South Asia Market Value, Forecast & Y-o-Y Growth (%), 2022–2029, Others Figure 166: South Asia Market Attractiveness Analysis, By Country (2022-2029) Figure 167: South Asia Market Attractiveness Analysis, By Product Type (2022-2029) Figure 168: South Asia Market Attractiveness Analysis, By Application (2022-2029) Figure 169: South Asia Market Attractiveness Analysis, By End User (2022-2029) Figure 170: Oceania Market, by Product Type (2021) Figure 171: Oceania Market, Snapshot Figure 172: Oceania Market, by Application (2021) Figure 173: Oceania Market, by Country (2021) and (2029) Figure 174: Oceania Market, by End User (2021) Figure 175: Oceania Market Size (US$ Mn) Analysis, 2014–2021 Figure 176: Oceania Market Size (US$ Mn) Forecast & Y-o-Y Growth (%), 2022–2029 Figure 177: Oceania Market Value, 2014–2021, Clustered Regularly Interspaced Short Palindromic Repeats (CRISPR/Cas9) Figure 178: Oceania Market Value, Forecast & Y-o-Y Growth (%), 2022–2029, Clustered Regularly Interspaced Short Palindromic Repeats (CRISPR/Cas9) Figure 179: Oceania Market Value, 2014–2021, Zinc Finger Nucleases (ZFNs) Figure 180: Oceania Market Value, Forecast & Y-o-Y Growth (%), 2022–2029, Zinc Finger Nucleases (ZFNs) Figure 181: Oceania Market Value, 2014–2021, Transcription Activator-Like Effector Nucleases (TALENs) Figure 182: Oceania Market Value, Forecast & Y-o-Y Growth (%), 2022–2029, Transcription Activator-Like Effector Nucleases (TALENs) Figure 183: Oceania Market Value, 2014–2021, Viral Systems Figure 184: Oceania Market Value, Forecast & Y-o-Y Growth (%), 2022–2029, Viral Systems Figure 185: Oceania Market Value, 2014–2021, Transposon Systems Figure 186: Oceania Market Value, Forecast & Y-o-Y Growth (%), 2022–2029, Transposon Systems Figure 187: Oceania Market Value, 2014–2021, Others Figure 188: Oceania Market Value, Forecast & Y-o-Y Growth (%), 2022–2029, Others Figure 189: Oceania Market Attractiveness Analysis, By Country (2022-2029) Figure 190: Oceania Market Attractiveness Analysis, By Product Type (2022-2029) Figure 191: Oceania Market Attractiveness Analysis, By Application (2022-2029) Figure 192: Oceania Market Attractiveness Analysis, By End User (2022-2029) Figure 193: MEA Market, by Product Type (2021) Figure 194: MEA Market, Snapshot Figure 195: MEA Market, by Application (2021) Figure 196: MEA Market, by Country (2021) and (2029) Figure 197: MEA Market, by End User (2021) Figure 198: Oceania Market Size (US$ Mn) Analysis, MEA Figure 199: MEA Market Size (US$ Mn) Forecast & Y-o-Y Growth (%), 2022–2029 Figure 200: MEA Market Value, 2014–2021, Clustered Regularly Interspaced Short Palindromic Repeats (CRISPR/Cas9) Figure 201: MEA Market Value, Forecast & Y-o-Y Growth (%), 2022–2029, Clustered Regularly Interspaced Short Palindromic Repeats (CRISPR/Cas9) Figure 202: MEA Market Value, 2014–2021, Zinc Finger Nucleases (ZFNs) Figure 203: MEA Market Value, Forecast & Y-o-Y Growth (%), 2022–2029, Zinc Finger Nucleases (ZFNs) Figure 204: MEA Market Value, 2014–2021, Transcription Activator-Like Effector Nucleases (TALENs) Figure 205: MEA Market Value, Forecast & Y-o-Y Growth (%), 2022–2029, Transcription Activator-Like Effector Nucleases (TALENs) Figure 206: MEA Market Value, 2014–2021, Viral Systems Figure 207: MEA Market Value, Forecast & Y-o-Y Growth (%), 2022–2029, Viral Systems Figure 208: MEA Market Value, 2014–2021, Transposon Systems Figure 209: MEA Market Value, Forecast & Y-o-Y Growth (%), 2022–2029, Transposon Systems Figure 210: MEA Market Value, 2014–2021, Others Figure 211: MEA Market Value, Forecast & Y-o-Y Growth (%), 2022–2029, Others Figure 212: MEA Market Attractiveness Analysis, By Country (2022-2029) Figure 213: MEA Market Attractiveness Analysis, By Product Type (2022-2029) Figure 214: MEA Market Attractiveness Analysis, By Application (2022-2029) Figure 215: MEA Market Attractiveness Analysis, By End User (2022-2029)
Recommendations
Explore Healthcare Insights
View Reports