Gene Synthesis Market Size and Share Forecast Outlook 2025 to 2035

The global gene synthesis market is estimated to be valued at USD 1,089.3 million in 2025 and is projected to reach USD 6,203.6 million by 2035, registering a compound annual growth rate of 19% over the forecast period.

Quick Stats for Gene Synthesis Market

  • Industry Value (2025): USD 1,089.3 million
  • Forecast Value (2035): USD 6,203.6 million
  • Forecast CAGR: 19%
  • Leading Segment in 2025 (Product Type): Gene Synthesis Services (68.5% share)
  • Key Growth Regions: North America, Asia-Pacific (China, Japan, South Korea)
  • Top Key Players: Thermo Fisher Scientific, GenScript Biotech Corp., Twist Bioscience, Integrated DNA Technologies (IDT), Bioneer Corporation
Metric Value
Market Size in 2025 USD 1,089.3 million
Projected Market Size in 2035 USD 6,203.6 million
CAGR (2025 to 2035) 19%

The gene synthesis market has evolved into a cornerstone of molecular biology and synthetic biology workflows, supporting applications spanning drug discovery, vaccine development, metabolic engineering, and genetic diagnostics.

Advances in DNA synthesis chemistry, error correction technologies, and automation platforms have significantly reduced the cost per base pair, improving turnaround times and enabling large-scale projects that were previously cost-prohibitive.

Increased investments in cell and gene therapy pipelines, coupled with funding for synthetic biology start-ups, have sustained robust demand for synthetic constructs tailored for CRISPR-based editing, protein engineering, and pathway optimization. Regulatory frameworks governing the ethical use and biosafety of synthetic genes are being progressively refined, providing clearer pathways for commercialization.

Analyzing Gene Synthesis Market by Top Investment Segments

Gene Synthesis Services Dominate Owing to Customization, High Accuracy, and Integration with Downstream Molecular Applications

Service Analysis

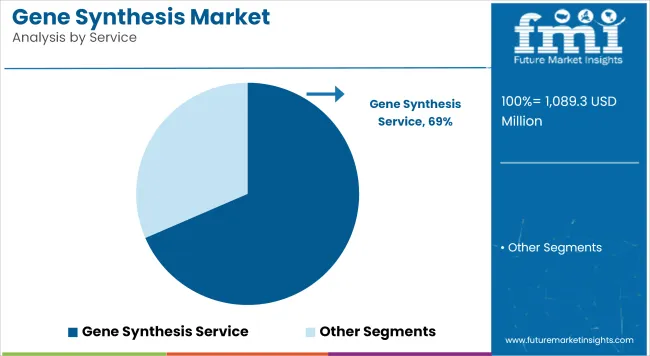
Gene Synthesis Market Analysis By Service

Gene Synthesis Service holds a revenue share of 68.5%, underscoring their critical role in research and industrial applications. The segment’s growth has been driven by increasing demand for tailor-made gene constructs that support drug target validation, vaccine antigen design, and metabolic pathway engineering.

Service providers have differentiated offerings by integrating error correction protocols, automation-enabled high-throughput workflows, and fast delivery times. Biotechnology and pharmaceutical companies have favored outsourcing gene synthesis to accelerate development timelines and reduce internal resource constraints.

Over the forecast period, the segment is expected to maintain a dominant position, supported by advances in bioinformatics-driven design, reductions in synthesis costs, and partnerships enabling end-to-end solutions that integrate synthesis with cloning and expression services.

Biotechnology Companies Are the Leading End Users Due to Their Heavy Investment in Synthetic Genes for Therapeutic Development and Industrial Biotech

End User Analysis

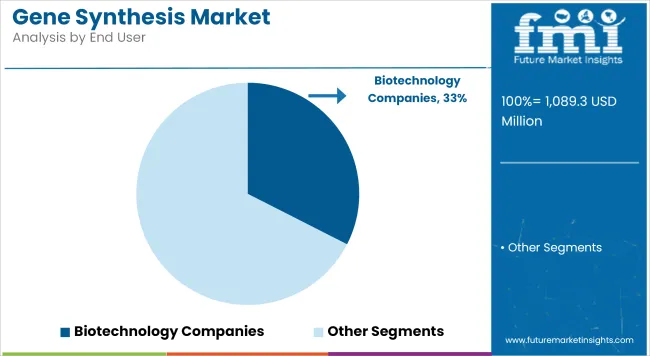
Gene Synthesis Market Analysis By End User

Biotechnology Companies is accounting for 32.5% revenue share, which reflects their pivotal role in driving demand for synthetic DNA constructs. The segment’s expansion has been fueled by robust investment in gene therapy, CAR-T development, microbial strain engineering, and protein therapeutics pipelines.

Companies have leveraged gene synthesis to design optimized sequences, de-risk production workflows, and accelerate time to proof-of-concept. The proliferation of venture funding in synthetic biology start-ups has further strengthened the segment’s contribution.

Challenges and Opportunities

Challenges

Regulatory ambiguity, biosafety, and IP issues

The lack of globally harmonized regulations for synthetic gene production and distribution raises moral dilemmas related to biosecurity and dual-use technologies and interfere with cross-border control of gene-edited constructs. Differing quality standards may also promote variability in the reproducibility of research.

The Intellectual Property Rights disputes surrounding synthetic gene sequences and oligo assembling technologies could restrict collaborations among entities and slow product development. According to WHO, biosafety and governance challenges must be addressed to foster equitable, just, and secure practices of gene synthesis all over the globe.

Opportunities

Growth of synthetic biology, development of therapeutic agents, and design using AI

This increases the growing demand for fast, accurate, scalable gene synthesis services by applications in synthetic biology across healthcare-related industries and agriculture-biotechnology and industrial biotech. Promotional areas include custom gene libraries for antibody discovery, synthetic vaccine design, and biosynthetic pathway optimization.

These technologies are incorporated within gene synthesis pipelines being used for codon optimization, error minimization, and de novo genome design. The use of engineered, synthetic DNA for therapeutic development and preparedness strategies in the long run through pandemics above all demonstrate the strategic value gene synthesis holds in the global security arena.

Country-Wise Outlook

United States

The gene synthesis market in the United States is enjoying strong growth propelled by significant demand in synthetic biology, personalized medicine, and other biologics development. Gene synthesis is most commonly used to construct vaccines, enzyme engineering applications, and CRISPR-based therapeutics in most academic research institutes, biotechnological companies, and pharmaceutical corporations.

As the OECD puts it, the USA leads the world in genomics R&D investment, bolstered by initiatives from NIH, DARPA, and others to boost speed and yield in gene-based solutions. For example, custom genes benefit from cloud-based ordering platforms and automation in DNA assembly, which increases accessibility and lowers turnaround times.
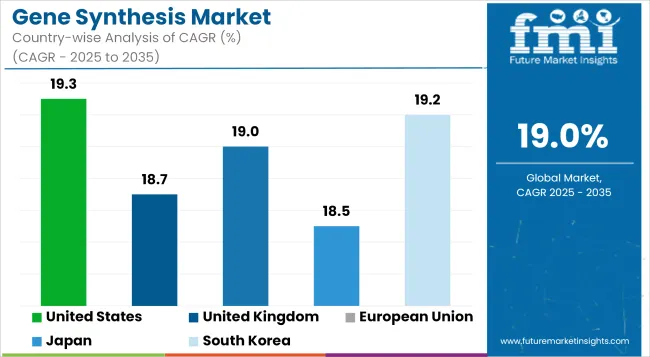
Gene Synthesis Market Cagr Analysis By Country

Country CAGR (2025 to 2035)
United States 19.3%

United Kingdom

The gene synthesis market in the UK is rapidly expanding through strong academic-industry collaboration and support for bio-innovation under the UK Life Sciences Vision. More applications of gene synthesis include the development of vaccines, agricultural biotechnology, and research in cell therapies.

According to OECD, public investment in synthetic biology hubs is facilitating the development of new products, especially in areas such as antimicrobial resistance and green bio-manufacturing. Demand for high-throughput DNA synthesis for gene editing and metabolic pathway engineering boosts growth.

Country CAGR (2025 to 2035)
United Kingdom 18.7%

European Union

The emergence of the European gene synthesis market is characterized by contribution from Germany, France, and the Netherlands, where interlinked biotech clusters contribute to developing industrial enzymes, biopharmaceuticals, and sustainable materials.

According to UN, Horizon Europe funding is providing resources for genomic engineering and gene circuit design, enhancing opportunities for innovations at both academic and commercial levels. The direction taken by the green biotechnology shift and climate-friendly solutions further increases the demand for synthetic gene pathways. Biosecurity and ethical standards for the European Union also set the guide in safe and responsible expansion of the market.

Country CAGR (2025 to 2035)
European Union 19.0%

Japan

Japan's gene synthesis market is stabilizing and growing. Applications are in regenerative medicine, vaccine development, and agricultural biotechnology. Synthetic genes are used for stem cell research and the generation of therapeutic proteins at both universities and life sciences companies.

At present, as reported by OECD, such government support for genomic medicine along with domestic biotech capabilities is expected to result in positive growth for automated gene synthesis services. An increase in the availability of biopharmaceutical start-ups is heralding promising new demand for scalable DNA synthesis, which they require for rapid prototyping and precision medicine pipelines.

Country CAGR (2025 to 2035)
Japan 18.5%

South Korea

South Korea's advanced market in gene synthesis is now witnessing a rapid expansion, primarily due to the growing applications of mRNA therapeutics, gene editing, and microbial engineering. The Korean Bio economy 2030 Strategy has laid down the most important pillars for gene and cell therapies and is expected to drive investments in DNA synthesis infrastructure.

According to OECD, public-private partnerships are producing efficacious new solutions in synthetic biology, particularly with respect to cancer treatments, enzyme production, and vaccine development. Providing high-throughput synthesis capacity, developing customizable gene libraries for both academic and industrial users.

Country CAGR (2025 to 2035)
South Korea 19.2%

Competition Outlook

The competitive landscape is defined by firms investing in automation, proprietary synthesis chemistries, and bioinformatics platforms to reduce error rates and improve delivery speed. Leading players are forming collaborations with pharma and biotech companies to offer integrated solutions spanning design, synthesis, and downstream applications such as cloning and expression.

Additionally, investments are being channelled into cloud-based platforms that streamline ordering and sequence tracking, as well as into AI tools that optimize codon usage and functional design. These strategies are expected to sustain strong competition and drive differentiation over the coming years.

Key Development

In 2024, Twist Bioscience has launched Twist Multiplexed Gene Fragments (MGFs). These pools of directly synthesized double-stranded DNA, up to 500 base pairs, enable high-throughput screening applications with no limit on sequence number.

In 2024, GenScript Biotech has launched GenScript FLASH Gene service, their ultra-fast sequence-to-plasmid (S2P) offering. This new service addresses the urgent need for rapid, high-quality, and cost-efficient delivery of gene constructs, showcasing GenScript's continued innovation in synthetic biology.

Companies

  • Thermo Fisher Scientific
  • GenScript
  • Integrated DNA Technologies
  • Twist Bioscience
  • ATUM
  • Genewiz
  • Blue Heron Biotech
  • DNA 2.0
  • BioCat
  • Biomatik
  • LC Sciences
  • Eurofins Genomics
  • Eurogentec
  • Gene Universal
  • BaseClear
  • Celtek Bioscience
  • DNAVision
  • Biosearch Technologies
  • Bioneer
  • Bio Basic
  • BGI
  • Genescript Biotech Lepu Medical Technology(Beijing)Co.,Ltd
  • BPL Medical Technologies
  • Smith’s Medical (ICU Medical, Inc)
  • BLT Biolight (Guangdong Biolight Meditech Co., Ltd)
  • SternMed GmbH

Key Segmentation

By Service:

  • Gene Synthesis Service
  • Gene Fragments Service
  • GMP Gene Synthesis
  • Others

By Application:

  • Diagnostics
  • Therapeutics
  • Research and Development Activities
  • Others

By End User:

  • Academic and Research Institutes
  • Biotechnology Companies
  • Pharmaceutical Companies
  • Contract Research Organization

By Region:

  • North America
  • Latin America
  • Europe
  • East Asia
  • South Asia
  • Oceania
  • The Middle East and Africa

Table of Content

  1. Executive Summary
  2. Industry Introduction, including Taxonomy and Market Definition
  3. Market Trends and Success Factors, including Macro-economic Factors, Market Dynamics, and Recent Industry Developments
  4. Market Demand Analysis 2020 to 2024 and Forecast 2025 to 2035, including Historical Analysis and Future Projections
  5. Pricing Analysis
  6. Market Analysis 2020 to 2024 and Forecast 2025 to 2035
    • Service
    • Application
    • End User
  7. Market Analysis 2020 to 2024 and Forecast 2025 to 2035, By Service
    • Service
      • Standard Gene Service
      • Express Gene Service
      • Complex Gene Service
      • Custom Service
    • Gene Fragments Service
    • GMP Gene Synthesis
    • Others
  8. Market Analysis 2020 to 2024 and Forecast 2025 to 2035, By Application
    • Diagnostics
    • Therapeutics
    • Research and Development Activities
    • Others
  9. Market Analysis 2020 to 2024 and Forecast 2025 to 2035, By End User
    • Academic and Research Institutes
    • Biotechnology Companies
    • Pharmaceutical Companies
    • Contract Research Organization
  10. Market Analysis 2020 to 2024 and Forecast 2025 to 2035, By Region
    • North America
    • Latin America
    • Western Europe
    • Eastern Europe
    • East Asia
    • South Asia Pacific
    • Middle East and Africa
  11. North America Sales Analysis 2020 to 2024 and Forecast 2025 to 2035, by Key Segments and Countries
  12. Latin America Sales Analysis 2020 to 2024 and Forecast 2025 to 2035, by Key Segments and Countries
  13. Western Europe Sales Analysis 2020 to 2024 and Forecast 2025 to 2035, by Key Segments and Countries
  14. Eastern Europe Sales Analysis 2020 to 2024 and Forecast 2025 to 2035, by Key Segments and Countries
  15. East Asia Sales Analysis 2020 to 2024 and Forecast 2025 to 2035, by Key Segments and Countries
  16. South Asia Pacific Sales Analysis 2020 to 2024 and Forecast 2025 to 2035, by Key Segments and Countries
  17. Middle East and Africa Sales Analysis 2020 to 2024 and Forecast 2025 to 2035, by Key Segments and Countries
  18. Sales Forecast 2025 to 2035 by Service, Application, and End User for 30 Countries
  19. Competition Outlook, including Market Structure Analysis, Company Share Analysis by Key Players, and Competition Dashboard
  20. Company Profile
    • GenScript
    • Brooks Automation, Inc.
    • Boster Biological Technology
    • Twist Bioscience
    • ProteoGenix
    • Biomatik
    • Eurofins Scientific
    • ProMab Biotechnologies, Inc.
    • Thermo Fisher Scientific, Inc.
    • Integrated DNA Technologies, Inc.
    • OriGene Technologies, Inc.

List of Tables

  • Table 1: Global Market Value (USD Million) Forecast by Region, 2020 to 2035
  • Table 2: Global Market Value (USD Million) Forecast by Service Type, 2020 to 2035
  • Table 3: Global Market Value (USD Million) Forecast by Application, 2020 to 2035
  • Table 4: Global Market Value (USD Million) Forecast by End User , 2020 to 2035
  • Table 5: North America Market Value (USD Million) Forecast by Country, 2020 to 2035
  • Table 6: North America Market Value (USD Million) Forecast by Service Type, 2020 to 2035
  • Table 7: North America Market Value (USD Million) Forecast by Application, 2020 to 2035
  • Table 8: North America Market Value (USD Million) Forecast by End User , 2020 to 2035
  • Table 9: Latin America Market Value (USD Million) Forecast by Country, 2020 to 2035
  • Table 10: Latin America Market Value (USD Million) Forecast by Service Type, 2020 to 2035
  • Table 11: Latin America Market Value (USD Million) Forecast by Application, 2020 to 2035
  • Table 12: Latin America Market Value (USD Million) Forecast by End User , 2020 to 2035
  • Table 13: Europe Market Value (USD Million) Forecast by Country, 2020 to 2035
  • Table 14: Europe Market Value (USD Million) Forecast by Service Type, 2020 to 2035
  • Table 15: Europe Market Value (USD Million) Forecast by Application, 2020 to 2035
  • Table 16: Europe Market Value (USD Million) Forecast by End User , 2020 to 2035
  • Table 17: East Asia Market Value (USD Million) Forecast by Country, 2020 to 2035
  • Table 18: East Asia Market Value (USD Million) Forecast by Service Type, 2020 to 2035
  • Table 19: East Asia Market Value (USD Million) Forecast by Application, 2020 to 2035
  • Table 20: East Asia Market Value (USD Million) Forecast by End User , 2020 to 2035
  • Table 21: South Asia Market Value (USD Million) Forecast by Country, 2020 to 2035
  • Table 22: South Asia Market Value (USD Million) Forecast by Service Type, 2020 to 2035
  • Table 23: South Asia Market Value (USD Million) Forecast by Application, 2020 to 2035
  • Table 24: South Asia Market Value (USD Million) Forecast by End User , 2020 to 2035
  • Table 25: Oceania Market Value (USD Million) Forecast by Country, 2020 to 2035
  • Table 26: Oceania Market Value (USD Million) Forecast by Service Type, 2020 to 2035
  • Table 27: Oceania Market Value (USD Million) Forecast by Application, 2020 to 2035
  • Table 28: Oceania Market Value (USD Million) Forecast by End User , 2020 to 2035
  • Table 29: Middle East and Africa Market Value (USD Million) Forecast by Country, 2020 to 2035
  • Table 30: Middle East and Africa Market Value (USD Million) Forecast by Service Type, 2020 to 2035
  • Table 31: Middle East and Africa Market Value (USD Million) Forecast by Application, 2020 to 2035
  • Table 32: Middle East and Africa Market Value (USD Million) Forecast by End User , 2020 to 2035

List of Figures

  • Figure 1: Global Market Value (USD Million) by Service Type, 2025 to 2035
  • Figure 2: Global Market Value (USD Million) by Application, 2025 to 2035
  • Figure 3: Global Market Value (USD Million) by End User , 2025 to 2035
  • Figure 4: Global Market Value (USD Million) by Region, 2025 to 2035
  • Figure 5: Global Market Value (USD Million) Analysis by Region, 2020 to 2035
  • Figure 6: Global Market Value Share (%) and BPS Analysis by Region, 2025 to 2035
  • Figure 7: Global Market Y-o-Y Growth (%) Projections by Region, 2025 to 2035
  • Figure 8: Global Market Value (USD Million) Analysis by Service Type, 2020 to 2035
  • Figure 9: Global Market Value Share (%) and BPS Analysis by Service Type, 2025 to 2035
  • Figure 10: Global Market Y-o-Y Growth (%) Projections by Service Type, 2025 to 2035
  • Figure 11: Global Market Value (USD Million) Analysis by Application, 2020 to 2035
  • Figure 12: Global Market Value Share (%) and BPS Analysis by Application, 2025 to 2035
  • Figure 13: Global Market Y-o-Y Growth (%) Projections by Application, 2025 to 2035
  • Figure 14: Global Market Value (USD Million) Analysis by End User , 2020 to 2035
  • Figure 15: Global Market Value Share (%) and BPS Analysis by End User , 2025 to 2035
  • Figure 16: Global Market Y-o-Y Growth (%) Projections by End User , 2025 to 2035
  • Figure 17: Global Market Attractiveness by Service Type, 2025 to 2035
  • Figure 18: Global Market Attractiveness by Application, 2025 to 2035
  • Figure 19: Global Market Attractiveness by End User , 2025 to 2035
  • Figure 20: Global Market Attractiveness by Region, 2025 to 2035
  • Figure 21: North America Market Value (USD Million) by Service Type, 2025 to 2035
  • Figure 22: North America Market Value (USD Million) by Application, 2025 to 2035
  • Figure 23: North America Market Value (USD Million) by End User , 2025 to 2035
  • Figure 24: North America Market Value (USD Million) by Country, 2025 to 2035
  • Figure 25: North America Market Value (USD Million) Analysis by Country, 2020 to 2035
  • Figure 26: North America Market Value Share (%) and BPS Analysis by Country, 2025 to 2035
  • Figure 27: North America Market Y-o-Y Growth (%) Projections by Country, 2025 to 2035
  • Figure 28: North America Market Value (USD Million) Analysis by Service Type, 2020 to 2035
  • Figure 29: North America Market Value Share (%) and BPS Analysis by Service Type, 2025 to 2035
  • Figure 30: North America Market Y-o-Y Growth (%) Projections by Service Type, 2025 to 2035
  • Figure 31: North America Market Value (USD Million) Analysis by Application, 2020 to 2035
  • Figure 32: North America Market Value Share (%) and BPS Analysis by Application, 2025 to 2035
  • Figure 33: North America Market Y-o-Y Growth (%) Projections by Application, 2025 to 2035
  • Figure 34: North America Market Value (USD Million) Analysis by End User , 2020 to 2035
  • Figure 35: North America Market Value Share (%) and BPS Analysis by End User , 2025 to 2035
  • Figure 36: North America Market Y-o-Y Growth (%) Projections by End User , 2025 to 2035
  • Figure 37: North America Market Attractiveness by Service Type, 2025 to 2035
  • Figure 38: North America Market Attractiveness by Application, 2025 to 2035
  • Figure 39: North America Market Attractiveness by End User , 2025 to 2035
  • Figure 40: North America Market Attractiveness by Country, 2025 to 2035
  • Figure 41: Latin America Market Value (USD Million) by Service Type, 2025 to 2035
  • Figure 42: Latin America Market Value (USD Million) by Application, 2025 to 2035
  • Figure 43: Latin America Market Value (USD Million) by End User , 2025 to 2035
  • Figure 44: Latin America Market Value (USD Million) by Country, 2025 to 2035
  • Figure 45: Latin America Market Value (USD Million) Analysis by Country, 2020 to 2035
  • Figure 46: Latin America Market Value Share (%) and BPS Analysis by Country, 2025 to 2035
  • Figure 47: Latin America Market Y-o-Y Growth (%) Projections by Country, 2025 to 2035
  • Figure 48: Latin America Market Value (USD Million) Analysis by Service Type, 2020 to 2035
  • Figure 49: Latin America Market Value Share (%) and BPS Analysis by Service Type, 2025 to 2035
  • Figure 50: Latin America Market Y-o-Y Growth (%) Projections by Service Type, 2025 to 2035
  • Figure 51: Latin America Market Value (USD Million) Analysis by Application, 2020 to 2035
  • Figure 52: Latin America Market Value Share (%) and BPS Analysis by Application, 2025 to 2035
  • Figure 53: Latin America Market Y-o-Y Growth (%) Projections by Application, 2025 to 2035
  • Figure 54: Latin America Market Value (USD Million) Analysis by End User , 2020 to 2035
  • Figure 55: Latin America Market Value Share (%) and BPS Analysis by End User , 2025 to 2035
  • Figure 56: Latin America Market Y-o-Y Growth (%) Projections by End User , 2025 to 2035
  • Figure 57: Latin America Market Attractiveness by Service Type, 2025 to 2035
  • Figure 58: Latin America Market Attractiveness by Application, 2025 to 2035
  • Figure 59: Latin America Market Attractiveness by End User , 2025 to 2035
  • Figure 60: Latin America Market Attractiveness by Country, 2025 to 2035
  • Figure 61: Europe Market Value (USD Million) by Service Type, 2025 to 2035
  • Figure 62: Europe Market Value (USD Million) by Application, 2025 to 2035
  • Figure 63: Europe Market Value (USD Million) by End User , 2025 to 2035
  • Figure 64: Europe Market Value (USD Million) by Country, 2025 to 2035
  • Figure 65: Europe Market Value (USD Million) Analysis by Country, 2020 to 2035
  • Figure 66: Europe Market Value Share (%) and BPS Analysis by Country, 2025 to 2035
  • Figure 67: Europe Market Y-o-Y Growth (%) Projections by Country, 2025 to 2035
  • Figure 68: Europe Market Value (USD Million) Analysis by Service Type, 2020 to 2035
  • Figure 69: Europe Market Value Share (%) and BPS Analysis by Service Type, 2025 to 2035
  • Figure 70: Europe Market Y-o-Y Growth (%) Projections by Service Type, 2025 to 2035
  • Figure 71: Europe Market Value (USD Million) Analysis by Application, 2020 to 2035
  • Figure 72: Europe Market Value Share (%) and BPS Analysis by Application, 2025 to 2035
  • Figure 73: Europe Market Y-o-Y Growth (%) Projections by Application, 2025 to 2035
  • Figure 74: Europe Market Value (USD Million) Analysis by End User , 2020 to 2035
  • Figure 75: Europe Market Value Share (%) and BPS Analysis by End User , 2025 to 2035
  • Figure 76: Europe Market Y-o-Y Growth (%) Projections by End User , 2025 to 2035
  • Figure 77: Europe Market Attractiveness by Service Type, 2025 to 2035
  • Figure 78: Europe Market Attractiveness by Application, 2025 to 2035
  • Figure 79: Europe Market Attractiveness by End User , 2025 to 2035
  • Figure 80: Europe Market Attractiveness by Country, 2025 to 2035
  • Figure 81: East Asia Market Value (USD Million) by Service Type, 2025 to 2035
  • Figure 82: East Asia Market Value (USD Million) by Application, 2025 to 2035
  • Figure 83: East Asia Market Value (USD Million) by End User , 2025 to 2035
  • Figure 84: East Asia Market Value (USD Million) by Country, 2025 to 2035
  • Figure 85: East Asia Market Value (USD Million) Analysis by Country, 2020 to 2035
  • Figure 86: East Asia Market Value Share (%) and BPS Analysis by Country, 2025 to 2035
  • Figure 87: East Asia Market Y-o-Y Growth (%) Projections by Country, 2025 to 2035
  • Figure 88: East Asia Market Value (USD Million) Analysis by Service Type, 2020 to 2035
  • Figure 89: East Asia Market Value Share (%) and BPS Analysis by Service Type, 2025 to 2035
  • Figure 90: East Asia Market Y-o-Y Growth (%) Projections by Service Type, 2025 to 2035
  • Figure 91: East Asia Market Value (USD Million) Analysis by Application, 2020 to 2035
  • Figure 92: East Asia Market Value Share (%) and BPS Analysis by Application, 2025 to 2035
  • Figure 93: East Asia Market Y-o-Y Growth (%) Projections by Application, 2025 to 2035
  • Figure 94: East Asia Market Value (USD Million) Analysis by End User , 2020 to 2035
  • Figure 95: East Asia Market Value Share (%) and BPS Analysis by End User , 2025 to 2035
  • Figure 96: East Asia Market Y-o-Y Growth (%) Projections by End User , 2025 to 2035
  • Figure 97: East Asia Market Attractiveness by Service Type, 2025 to 2035
  • Figure 98: East Asia Market Attractiveness by Application, 2025 to 2035
  • Figure 99: East Asia Market Attractiveness by End User , 2025 to 2035
  • Figure 100: East Asia Market Attractiveness by Country, 2025 to 2035
  • Figure 101: South Asia Market Value (USD Million) by Service Type, 2025 to 2035
  • Figure 102: South Asia Market Value (USD Million) by Application, 2025 to 2035
  • Figure 103: South Asia Market Value (USD Million) by End User , 2025 to 2035
  • Figure 104: South Asia Market Value (USD Million) by Country, 2025 to 2035
  • Figure 105: South Asia Market Value (USD Million) Analysis by Country, 2020 to 2035
  • Figure 106: South Asia Market Value Share (%) and BPS Analysis by Country, 2025 to 2035
  • Figure 107: South Asia Market Y-o-Y Growth (%) Projections by Country, 2025 to 2035
  • Figure 108: South Asia Market Value (USD Million) Analysis by Service Type, 2020 to 2035
  • Figure 109: South Asia Market Value Share (%) and BPS Analysis by Service Type, 2025 to 2035
  • Figure 110: South Asia Market Y-o-Y Growth (%) Projections by Service Type, 2025 to 2035
  • Figure 111: South Asia Market Value (USD Million) Analysis by Application, 2020 to 2035
  • Figure 112: South Asia Market Value Share (%) and BPS Analysis by Application, 2025 to 2035
  • Figure 113: South Asia Market Y-o-Y Growth (%) Projections by Application, 2025 to 2035
  • Figure 114: South Asia Market Value (USD Million) Analysis by End User , 2020 to 2035
  • Figure 115: South Asia Market Value Share (%) and BPS Analysis by End User , 2025 to 2035
  • Figure 116: South Asia Market Y-o-Y Growth (%) Projections by End User , 2025 to 2035
  • Figure 117: South Asia Market Attractiveness by Service Type, 2025 to 2035
  • Figure 118: South Asia Market Attractiveness by Application, 2025 to 2035
  • Figure 119: South Asia Market Attractiveness by End User , 2025 to 2035
  • Figure 120: South Asia Market Attractiveness by Country, 2025 to 2035
  • Figure 121: Oceania Market Value (USD Million) by Service Type, 2025 to 2035
  • Figure 122: Oceania Market Value (USD Million) by Application, 2025 to 2035
  • Figure 123: Oceania Market Value (USD Million) by End User , 2025 to 2035
  • Figure 124: Oceania Market Value (USD Million) by Country, 2025 to 2035
  • Figure 125: Oceania Market Value (USD Million) Analysis by Country, 2020 to 2035
  • Figure 126: Oceania Market Value Share (%) and BPS Analysis by Country, 2025 to 2035
  • Figure 127: Oceania Market Y-o-Y Growth (%) Projections by Country, 2025 to 2035
  • Figure 128: Oceania Market Value (USD Million) Analysis by Service Type, 2020 to 2035
  • Figure 129: Oceania Market Value Share (%) and BPS Analysis by Service Type, 2025 to 2035
  • Figure 130: Oceania Market Y-o-Y Growth (%) Projections by Service Type, 2025 to 2035
  • Figure 131: Oceania Market Value (USD Million) Analysis by Application, 2020 to 2035
  • Figure 132: Oceania Market Value Share (%) and BPS Analysis by Application, 2025 to 2035
  • Figure 133: Oceania Market Y-o-Y Growth (%) Projections by Application, 2025 to 2035
  • Figure 134: Oceania Market Value (USD Million) Analysis by End User , 2020 to 2035
  • Figure 135: Oceania Market Value Share (%) and BPS Analysis by End User , 2025 to 2035
  • Figure 136: Oceania Market Y-o-Y Growth (%) Projections by End User , 2025 to 2035
  • Figure 137: Oceania Market Attractiveness by Service Type, 2025 to 2035
  • Figure 138: Oceania Market Attractiveness by Application, 2025 to 2035
  • Figure 139: Oceania Market Attractiveness by End User , 2025 to 2035
  • Figure 140: Oceania Market Attractiveness by Country, 2025 to 2035
  • Figure 141: Middle East and Africa Market Value (USD Million) by Service Type, 2025 to 2035
  • Figure 142: Middle East and Africa Market Value (USD Million) by Application, 2025 to 2035
  • Figure 143: Middle East and Africa Market Value (USD Million) by End User , 2025 to 2035
  • Figure 144: Middle East and Africa Market Value (USD Million) by Country, 2025 to 2035
  • Figure 145: Middle East and Africa Market Value (USD Million) Analysis by Country, 2020 to 2035
  • Figure 146: Middle East and Africa Market Value Share (%) and BPS Analysis by Country, 2025 to 2035
  • Figure 147: Middle East and Africa Market Y-o-Y Growth (%) Projections by Country, 2025 to 2035
  • Figure 148: Middle East and Africa Market Value (USD Million) Analysis by Service Type, 2020 to 2035
  • Figure 149: Middle East and Africa Market Value Share (%) and BPS Analysis by Service Type, 2025 to 2035
  • Figure 150: Middle East and Africa Market Y-o-Y Growth (%) Projections by Service Type, 2025 to 2035
  • Figure 151: Middle East and Africa Market Value (USD Million) Analysis by Application, 2020 to 2035
  • Figure 152: Middle East and Africa Market Value Share (%) and BPS Analysis by Application, 2025 to 2035
  • Figure 153: Middle East and Africa Market Y-o-Y Growth (%) Projections by Application, 2025 to 2035
  • Figure 154: Middle East and Africa Market Value (USD Million) Analysis by End User , 2020 to 2035
  • Figure 155: Middle East and Africa Market Value Share (%) and BPS Analysis by End User , 2025 to 2035
  • Figure 156: Middle East and Africa Market Y-o-Y Growth (%) Projections by End User , 2025 to 2035
  • Figure 157: Middle East and Africa Market Attractiveness by Service Type, 2025 to 2035
  • Figure 158: Middle East and Africa Market Attractiveness by Application, 2025 to 2035
  • Figure 159: Middle East and Africa Market Attractiveness by End User , 2025 to 2035
  • Figure 160: Middle East and Africa Market Attractiveness by Country, 2025 to 2035

Frequently Asked Questions

What was the overall size of the gene synthesis market in 2025?

The overall market size for the gene synthesis market was approximately USD 1,089.3 million in 2025.

How big is the gene synthesis market expected to be in 2035?

The gene synthesis market is expected to reach approximately USD 6,203.6 million by 2035.

What will drive the demand for the gene synthesis market during the forecast period?

The demand for gene synthesis is rising due to increasing adoption of synthetic biology techniques, advancements in DNA synthesis technologies, and growing applications in drug discovery.

List the top 5 countries contributing to the gene synthesis market.

The top 5 countries driving the development of the gene synthesis market are the United States, China, Germany, Japan, and the United Kingdom.

Which segment in the service type and end-user is expected to lead in the gene synthesis market?

Custom gene synthesis services and adoption by biotech & pharmaceutical companies are expected to command significant shares over the assessment period.

Explore Similar Insights

Future Market Insights

Gene Synthesis Market