In 2024, the General Purpose Electronic Test and Measurement Instruments industry witnessed steady growth driven by several key technological advancements and industry shifts. The industry witnessed a significant uptick in demand for digital and automated testing solutions, particularly in sectors like automotive and telecommunications.
The shift toward electric vehicles (EVs) and renewable energy systems prompted significant investments in new testing equipment for high-voltage components, battery testing, and power conversion systems. Meanwhile, advancements in 5G technology spurred demand for testing instruments capable of handling higher frequencies and more complex network architectures.
Geographically, North America and Asia-Pacific continued to dominate the industry, with China seeing a surge in demand due to the country's expanding semiconductor and electronics industries. The ongoing miniaturization of electronic devices also required precision testing, which was met with the rise of advanced, compact instruments. However, supply chain disruptions, particularly in semiconductor components, caused occasional delays in production and delivery timelines, slightly dampening overall growth during the year.

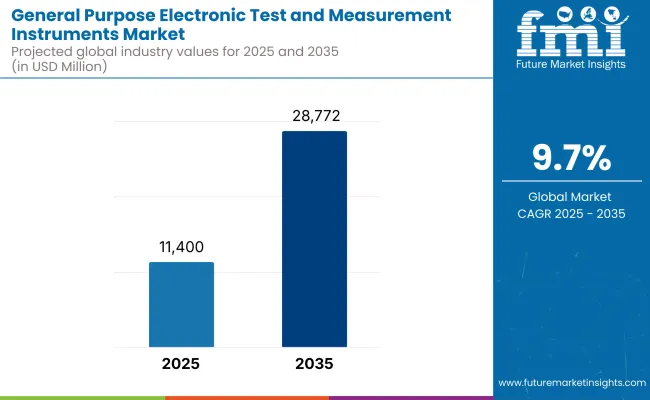
Looking ahead to 2025 and beyond, the industry is expected to maintain its growth trajectory, driven by the expanding need for robust testing solutions in emerging technologies like AI, IoT, and 6G communications. Moreover, the increasing focus on sustainability and energy efficiency will likely encourage further innovation in test and measurement instruments, providing opportunities for industry expansion.
Surveyed Q4 2024, n=500 stakeholder participants evenly distributed across manufacturers, distributors, industrial operators, and regulators in the USA, Western Europe, Japan, and South Korea
Regional Variance
High Variance
Convergent and Divergent Perspectives on ROI
68% of USA stakeholders identified automation as a long-term ROI driver, while only 45% in Japan considered it essential due to high upfront costs.
Consensus
Aluminium Casings: 61% of global stakeholders preferred aluminium enclosures for their heat resistance and durability in harsh industrial environments.
Variance
Shared Challenges
82% cited rising material and semiconductor costs as a significant concern, affecting pricing strategies.
Regional Differences
Manufacturers
Distributors
End-Users (Industrial Operators)
Alignment
74% of global manufacturers plan to invest in IoT-connected test systems for remote diagnostics and predictive maintenance.
Divergence
High Consensus
Accuracy, cost-efficiency, and compliance with environmental standards are shared priorities across all regions.
Key Variances
Strategic Insight
Customizing product offerings based on regional demand-AI-driven solutions in the USA, sustainable designs in Europe, and affordable compact models in Asia-will drive market success.
| Countries | Government Regulations and Impact on Market |
|---|---|
| United States | Regulations: Compliance with FCC (Federal Communications Commission) standards for electromagnetic compatibility (EMC) is mandatory for test equipment, particularly in telecommunications. |
| United Kingdom | Regulations: Test equipment in the UK must comply with UKCA (UK Conformity Assessed) marking for product safety and compliance with EU standards post-Brexit. BS EN 61010-1 is a key safety standard for electrical equipment. |
| France | Regulations: France adheres to CE marking for conformity with EU directives. Compliance with RoHS and WEEE (Waste Electrical and Electronic Equipment) is mandatory for electronic devices, impacting test equipment manufacturers. |
| Germany | Regulations: CE marking is mandatory for test instruments in Germany, ensuring they meet EU regulations. Additionally, test devices used in industries like automotive and aerospace must meet specific DIN standards. RoHS compliance is also essential. |
| Italy | Regulations: Like other EU countries, Italy requires CE marking for compliance with European directives. Italy also adheres to RoHS and WEEE for environmental regulations. |
| South Korea | Regulations: Compliance with KC (Korea Certification) mark is required for all test instruments. South Korea has strict electromagnetic compatibility (EMC) regulations, and KOSHA (Korea Occupational Safety and Health Agency) mandates certain safety standards for test equipment used in hazardous environments. |
| Japan | Regulations: Japan follows PSE (Product Safety Electrical Appliance & Material) certification for electronic devices. The Electrical Appliance and Material Safety Law (DENAN) governs the safety of electrical devices, including testing instruments. |
| China | Regulations: China mandates CCC (China Compulsory Certification) for most electrical products, including test and measurement instruments. RoHS compliance is enforced by the Ministry of Environmental Protection. |
| India | BIS (Bureau of Indian Standards) certification is mandatory for test instruments. RoHS and WEEE compliance are required for environmental standards. Manufacturers must also adhere to EPR (Extended Producer Responsibility) for waste management. CE marking is needed for export. |

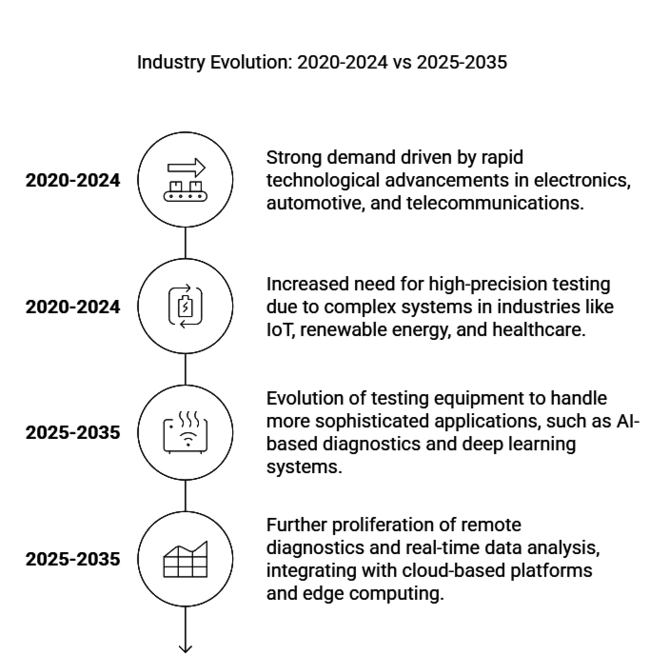
| 2020 to 2024 | 2025 to 2035 |
|---|---|
| Strong demand driven by rapid technological advancements in electronics, automotive, and telecommunications. | Continued expansion fuelled by innovations in AI, automation, and 5G technology. |
| Significant growth in sectors such as automotive (electric vehicles, autonomous driving) and telecommunications (5G rollout). | Ongoing research and early-stage testing of 6G technology, expected to shape future industry trends by the 2030s. |
| Increased need for high-precision testing due to complex systems in industries like IoT, renewable energy, and healthcare. | Rising demand from emerging industries such as quantum computing, autonomous robotics, and advanced semiconductor manufacturing. |
| Focus on product innovation, with companies launching advanced, portable, and multifunctional testing solutions. | Evolution of testing equipment to handle more sophisticated applications, such as AI-based diagnostics and deep learning systems. |
| Continued shift towards smart manufacturing and automation, particularly in developed regions. | Widespread global transition to smart factories, Industry 5.0, and fully autonomous production lines. |
| Challenges in supply chain disruptions and global economic uncertainty, affecting the growth trajectory. | Increased stability in supply chains, with localized manufacturing and optimized global logistics reducing disruptions. |
| A shift towards wireless testing solutions and remote monitoring, accelerated by the COVID-19 pandemic. | Further proliferation of remote diagnostics and real-time data analysis, integrating with cloud-based platforms and edge computing. |
The general purpose electronic test and measurement instruments industry is primarily driven by products like oscilloscopes, mustimeters, signal generators, spectrum analysers, and power supplies. Oscilloscopes and signal generators are leading the industry, particularly due to their application in telecommunications, automotive, aerospace, and industrial sectors. Signal generators and spectrum analysers are experiencing the fastest growth due to the demand from emerging technologies like 5G, IoT, and automotive systems.
Innovations such as digital oscilloscopes with higher bandwidth, real-time analysis, and AI-powered diagnostics are further driving industry expansion. Additionally, the rise in automation, increasing semiconductor complexity, and stringent quality control requirements in electronics manufacturing are accelerating demand for these instruments.
Telecommunications and electronics are the largest end-user sectors, fueled by the rollout of 5G networks and the rise of IoT technologies. The automotive sector, especially with electric vehicles (EVs) and autonomous driving, is the fastest-growing segment for test instruments.
Moreover, the industrial sector also plays a key role here, driven by automation, Industry 4.0, and smart factories. Additionally, the aerospace, defense, and renewable energy industries are increasing demand for testing solutions. Medical applications are emerging as a growth area due to the rise in electronics for diagnostic equipment. The expansion of AI, cloud computing, and semiconductor manufacturing further boosts demand.

| Countries | CAGR (2025 to 2035) |
|---|---|
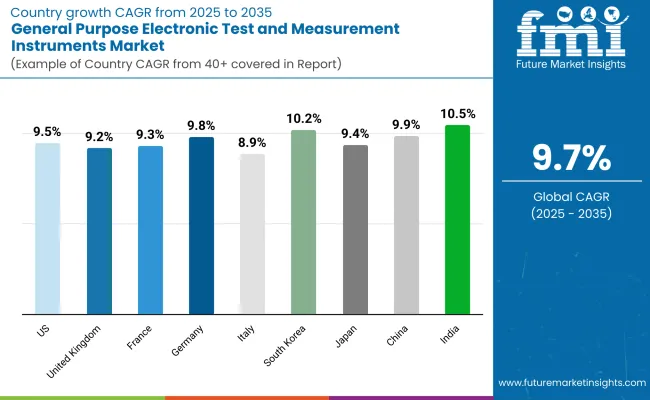
| United States | 9.5% |
| United Kingdom | 9.2% |
| France | 9.3% |
| Germany | 9.8% |
| Italy | 8.9% |
| South Korea | 10.2% |
| Japan | 9.4% |
| China | 9.9% |
| India | 10.5% |
The United States is expected to expand at a CAGR of 9.5% during 2025 to 2035, fueled by the growth in 5G technology, aerospace and defense industries, and semiconductor production. The CHIPS Act of the USA government has provided significant funding to improve local semiconductor manufacturing, decreasing dependence on foreign supply chains and increasing the need for test and measurement equipment.
Moreover, the aerospace and defense sector also plays a significant role in market growth, with spending on radar, electronic warfare, and next-generation communications demanding superior test solutions. Increased emphasis on autonomous transportation and electric mobility further fuels the demand for test equipment in sensor calibration and vehicle electronics. The quest for renewable power, specifically solar and wind power, has boosted investment in power electronics testing.
The United Kingdom is forecast to expand at a CAGR of 9.2% during 2025 to 2035, supported by rising investments in wireless communication infrastructure, automotive electronics, and industrial automation propelling market expansion. The nation's focus on 5G and next-generation 6G networks is also a prime driver, requiring sophisticated RF testing solutions to support telecommunications growth.
Smart grids and renewable energy initiatives are driving demand for precise measurement equipment. Furthermore, the drive for cybersecurity and AI-based applications in industrial and defence industries has created greater demand for electronic testing solutions to guarantee data integrity and system reliability, making the UK a prime position in the developing test and measurement market.
France is expected to grow at a CAGR of 9.3% between 2025 and 2035, led by robust growth by the country's dominance in aerospace, automotive, and industrial automation industries. As the residence of Airbus, which is one of the largest manufacturers of aerospace equipment globally, France has a persistent need for advanced electronic testing technologies in avionics, satellite communications, and defence markets.
Moreover, France is broadening its emphasis on cybersecurity and digital infrastructure, boosting demand for reliable electronic test and measurement tools to provide data protection and system performance. In addition, France's focus on renewable energy sources, including wind power and solar energy, is fuelling the need for electronic testing solutions in power electronics and grid management, further solidifying its status as a key test and measurement instrument market.
Italy is also expected to register a CAGR of 8.9% during the period 2025 to 2035, with growth being propelled by rising investments in industrial automation, renewable energy, and medical electronics. Italy has a strong manufacturing sector in robotics, automotive parts, and aerospace, necessitating advanced testing solutions for quality assurance and precision.
Italy's automation industry is developing fast with the implementation of AI, IoT, and machine learning technology, necessitating sophisticated test and measuring tools for smoother performance. In addition, Italy is investing in renewable energy development, especially solar and wind energy, with high-precision testing equipment to guarantee the efficiency of energy storage and grid management systems. The nation is also developing its transport sector, with growing investment in electric mobility and smart infrastructure.
Germany's market is projected to expand at a CAGR of 9.8%, driven by its leadership in industrial automation, automotive innovation, and semiconductor manufacturing. As a pioneer in Industry 4.0, German companies are investing in AI-powered testing solutions.
The country's significant role in electric vehicle production and battery technology increases the demand for precision measurement tools. Collaborations between universities, research institutions, and private enterprises foster continuous technological advancements. The emphasis on sustainability and carbon-neutral manufacturing further boosts investments in high-precision electronic testing equipment.
South Korea is in the lead at 10.2% CAGR, driven by its supremacy in semiconductor production, 6G research, and consumer electronics. Large firms such as Samsung and SK Hynix make heavy investments in test and measurement technology to keep abreast globally.
Government initiatives supporting AI and quantum computing studies generate demand for high-end testing solutions. Furthermore, South Korea's emphasis on hydrogen energy and innovations in battery technologies boosts the demand for high-end testing solutions for these fields.
Japan's market is projected to grow at a CAGR of 9.4% due to its dominance in precision instruments, robotics, and automotive technology. Large investments in R&D for next-generation telecom networks and AI-based industrial automation are adding to market growth.
Demand for high-frequency testing solutions is on the increase, fuelled by the development of 6G and space exploration initiatives. Japan’s aging infrastructure has led to increased investments in smart city technologies, driving demand for electronic test and measurement equipment.
China is expected to grow at a CAGR of 9.9% driven by its thriving semiconductor industry and large-scale deployment of 5G. Technological self-reliance initiatives of the government and heavy investments in AI, electric vehicles, and quantum computing drive the demand for test and measurement equipment.
Robust manufacturing prowess at home and an increasing export economy boost industry growth. China's leadership in the consumer electronics and telecommunication industries also propels the demand for accurate electronic testing equipment.
India takes the lead in the growth chart with a CAGR of 10.5% due to the fast pace of industrialization, telecom growth, and growing local semiconductor manufacturing. The growth of smart factories, automation, and development of renewable energy infrastructure further fuels market growth. Besides, the demand for 6G research and domestic aerospace development fortifies the test and measurement industry. India's expanding medical technology and defence sectors are also significant drivers of market growth.
In 2024, top leading companies in the electronics testing and measurement industry have taken the initiative to grow along with the industry. Meanwhile, Keysight Technologies remains focused on next-gen solutions for 5G and the semiconductor industries and has also launched new 5G testing tools to meet the demand from mobile networks as well as IoT and automotive industries. Due to strong innovation and a solid portfolio, their AI-enabled testing solutions enable them to maintain a significant share, solidifying their position in this domain.
Two major companies in the test and measurement industry, Tektronix and Keysight, have already introduced new products in 2024. This was to address customer demands, particularly in high-speed data analysis for telecommunications and automotive sectors. Famous for its oscilloscopes and signal generators, Tektronix has managed to keep its edge in the industry by adapting its integrated and modular test strategy as industry demands shift, it increased its industry share through innovation.
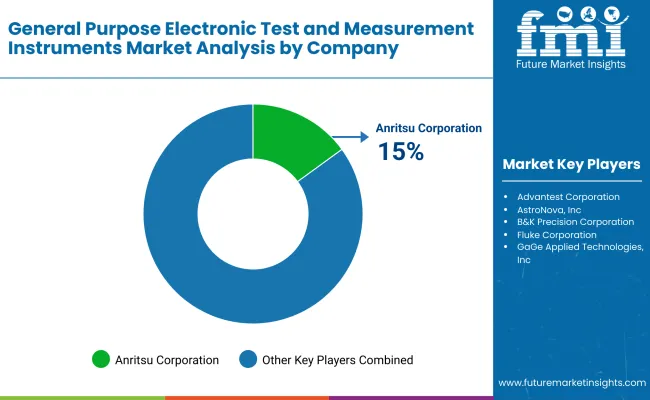
In response to the growing automotive industry's push towards electric vehicles (EVs) and autonomous driving systems, Rohde & Schwarz has announced the introduction of specialized testing instruments. They are also expanding their industry due to their continual investment into 5G and IoT solutions. Notably, Anritsu, a key player in 5G and broadband network testing, has introduced advanced solutions to enhance 5G infrastructure and strengthen its position in the telecom and semiconductor industries.
Industry Share Analysis

Advantest Corporation
Anritsu Corporation
AstroNova, Inc.
B&K Precision Corporation
Fluke Corporation
Fortive Corporation
GaGe Applied Technologies, Inc.
Good Will Instrument Co., Ltd.
Hioki E.E. Corporation
Ideal Industries, Inc.
The development of the industry is prompted by the technological progress, automation, infrastructural investmenets, and sustainable nature on a global scale. With industries worldwide upgrading and new technologies such as 5G, electric vehicles, and Internet of Things (IoT) gaining traction, the demand for high-precision testing instruments, too, is rising. Various economic factors contribute to this growth, including growing investment in R&D, government infrastructure spending, and the transition to automation and smart manufacturing.
In addition, the global shift towards sustainability and adoption of renewable energy sources are expected to create new testing and measurement needs that would further drive demand. By geography, industry is increasing quickly across developed economies where focus is on using technological upgrades and emerging industries driven by rapid industrialization and technology acceptance. These opportunities will drive continued industry growth as innovations emerge and reliance on digital and automated systems increases.
From 2024 and onward, stakeholders have a number of growths opportunities to tap into in the electronics test and measurement industry. An important strategy is to explore emerging industries in regions like Southeast Asia, Latin America, and Africa.
As industrialization increases in these regions, the needs of testing solutions for industries such as telecommunications, automotive, and renewable energy will also grow. In order to seize these opportunities, stakeholders need to think about entering strategic partnerships with local distributors, establishing joint ventures, or creating regional manufacturing hubs to decrease cost and increase industry penetration.
The rapid expansion of 5G networks around the world also translates to considerable growth potential. Specializing in next-generation communication networks enables stakeholders to become a front-runner in this rapidly expanding industry, particularly in areas such as telecommunications and IoT applications.
Electric vehicles (EV) and autonomous driving technology will also create a massive opportunity for the automotive industry. Testing solutions for EV battery systems, electric drivetrains, and autonomous technologies like LiDAR and radar are in high demand due to their critical role in performance and safety. Stakeholders may work with automakers in a partnership to design target-driven tools, therefore entering a new industry that is reputed to grow at an unprecedented rate.
AI and ML can also be integrated into testing instruments to enhance analysis and provide more intelligent comparisons with previous tests. Artificial intelligence is important in streamlining the testing processes, improving accuracy, and decreasing the operational costs involved, thus its utilization in automation would be an area of utmost importance for further development in the coming years.
The industry is divided into digital oscilloscopes, extension-based T&M instruments, network analyzers, multimeters, spectrum analyzers, radio frequency signal generators, microwave signal generators, and others.
The industry is segmented into communications, aerospace & defense, electronics manufacturing, industrial electronics & automotive, and others.
The industry is studied across into North America, Latin America, Western Europe, Eastern Europe, South Asia and Pacific, East Asia, and The Middle East and Africa.
Technological advancements like 5G, electric vehicles, and automation are key drivers.
Telecommunications, automotive, aerospace, and industrial sectors are the main consumers.
The expansion of 5G increases demand for high-performance testing tools for network quality and speed.
AI improves automation, accuracy, and efficiency in data analysis and testing procedures.
The rise of EVs boosts demand for testing solutions in battery systems, drivetrains, and autonomous technologies.


Full Research Suite comprises of:
Market outlook & trends analysis
Interviews & case studies
Strategic recommendations
Vendor profiles & capabilities analysis
5-year forecasts
8 regions and 60+ country-level data splits
Market segment data splits
12 months of continuous data updates
DELIVERED AS:
PDF EXCEL ONLINE
General Intelligent Decision-Making Service Market Size and Share Forecast Outlook 2025 to 2035
General Equipment Rental Services Market Size and Share Forecast Outlook 2025 to 2035
General Surgery Devices Market Insights – Demand and Growth Forecast 2025 to 2035
Generalized Anxiety Disorder Treatment Market Insights by Drug Class, Therapies, Distribution Channel, and Region 2035
Generalized Myasthenia Gravis Management Market - Growth & Treatment Advances 2025 to 2035
General Anesthesia Drugs Market Insights – Trends & Forecast 2025 to 2035
General Purpose DC Contactor Market Size and Share Forecast Outlook 2025 to 2035
Purpose-built Backup Appliance (PBBA) Market Size and Share Forecast Outlook 2025 to 2035
Repurposed Human Immunosuppressants Market Size and Share Forecast Outlook 2025 to 2035
On Purpose Technologies Market Growth - Trends & Forecast 2025 to 2035
Multipurpose Goods Vehicle Market Size and Share Forecast Outlook 2025 to 2035
Special-Purpose Analog-to-Digital Converters (ADCs) Market Forecast and Outlook 2025 to 2035
Special Purpose Needles Market Analysis – Growth & Forecast 2025 to 2035
Riding Multi-Purpose Lawn Mower Market Size and Share Forecast Outlook 2025 to 2035
All Electric Multipurpose Goods Vehicle Market Forecast and Outlook 2025 to 2035
Instruments for Peptide Drug Synthesis Market Size and Share Forecast Outlook 2025 to 2035
qPCR Instruments Market Analysis - Growth, Trends & Forecast 2025 to 2035
Modular Instruments Market Growth – Trends & Forecast 2025 to 2035
Surgical Instruments Tracking System Market Growth - Trends & Forecast 2025 to 2035
Surgical Instruments Packaging Market Size, Share & Forecast 2025 to 2035

Thank you!
You will receive an email from our Business Development Manager. Please be sure to check your SPAM/JUNK folder too.
Chat With
MaRIA