Measurement Technology in Downstream Processing Market growth snapshot

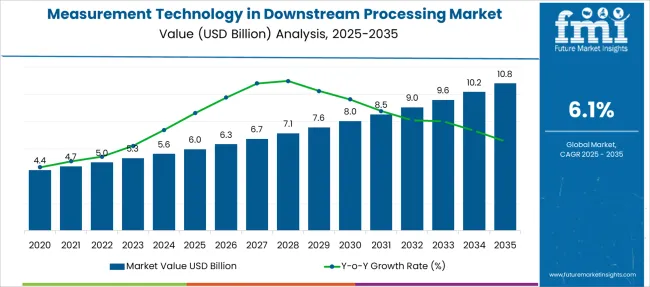
[260 pages Report] The global Measurement Technology in Downstream Processing Market was valued at US$ 5.0 Bn in 2022 and is expected to reach US$ 7.2 Bn by 2028, with, finds Future Market Insights in a recent market survey.

Increasing prevalence of chronic illnesses, especially cardiovascular diseases, cancers, and diabetes across the globe have been the prime reason for investment in biologics market. Rising demand for biologics due to higher efficacy and fewer side effects compared to small molecule drugs give demand for biopharmaceutical production. The preference for purified biopharmaceuticals products has led to the rising demand for purification of modified therapeutic products market.

Precised results required in bioprocessing from past few years has increased the demand for biomedical sensors, device and measurement systems market. Sensor design has also evolved in order to keep pace with the rapidly changing demand of the industry which has created demand for biosensors market. Highly accurate measurement device are required for protein detection which can boost the protein detection quantification market.

Biopharmaceutical downstream process market are generally dominated by chromatographic separations and membrane filtrations for biological products. Thereby, rising the demand for nucleic acid isolation and purification market.

As a majority of activities in biotechnology and life science research are dependent on collaboration and funding’s.  Additionally, due to the strong distribution, several players in the market make their products available around the world using various retailers and distributors.

For instance, in May 2020, Hamilton Company announced that its process analytics (sensors) unit was transitioning to a direct sales model throughout most of the U.S. and Canada.

In addition, protein molecule has various advantages like high specificity, low toxicity and complex functions which are highly adopted by researcher and biopharma industries. Thus, driving the market for proteomics market.

The increase in capacity demands have resulted in equipment needs for bioprocessing, which is only expected to gain further traction over the forecast period. Hence, the demand for measurement sensors is likely to stay high over the forecast period.

Don't pay for what you don't need

Customize your report by selecting specific countries or regions and save 30%!

How The Market Progressed Till June 2022?

Particulars Details
H1, 2021 6.09%
H1, 2022 Projected 6.15%
H1, 2022 Outlook 6.05%
BPS Change - H1, 2022 (O) - H1, 2022 (P) (-) 10 ↓
BPS Change - H1, 2022 (O) - H1, 2021 (-) 4 ↓

A comparative analysis about the market growth rates and development prospects in the global measurement technology in downstream processing market has been presented by FMI. The market is subject to be influenced by regulatory approvals for biologics and innovation factors in accordance with impact of macro and industry factors.

Online digital holographic microscopy when monitoring a bioreactor culture, and nano-plasmonic sensing are major progresses in this market.

As per the analysis by Future Market Insights, the market will decrease by 4 Basis Point Share (BPS) between H1-2021 and H1-2022(O). Major reasons for this decrease in BPS is attributed to the presence of flocculants during downstream processing of pharmaceutical proteins, impacting quality by design aspects of process development.

The market witnessed a decline in growth rate by 10 BPS between the periods of H1-2022 outlook over H1-2022 projected.

Other market segments are set to perform fairly and attain promising growth prospects in the next half of projection period. There are some relevant deterrent points that affect the industry growth, including the market entry of biosimilars and increasing costs in research and development of new drugs.

In addition, rising costs per approved drug and reduced sales of off-patent blockbuster drugs due to price competition from a variety of biosimilar competitors might affect the growth of the measurement technology in downstream processing market.

Measurement technology in downstream processing market Outlook

Data Points Market Insights
Market Value 2021 USD 4.7 billion
Forecasted Global Market Value (2028) USD 7.2 billion
Market Growth Rate 2022-2028 6.1%
Top 5 Countries % Share 58.3%
Key Players Companies are like Applikon Biotechnology Inc.; Sartorius AG; Broadley-James Corporation; Thermo Fisher Scientific Inc.; Hamilton Company give 8% market share.

2012-2021 Measurement technology in downstream processing market Demand Outlook Compared to 2022-2028 Forecast

Sales of measurement technology in downstream processing market grew at a CAGR of 5.6% between 2012 and 2021.

There is a high demand for high precision, continuous feedback sensors in bioprocessing to get precise results. Several standard operating procedures (SOPs) call for continuous feedback and process control for measuring key parameters such as pH, DO, temperature etc. This create demand for sensors in measurement technology in downstream processing market.

New and innovative sensor technologies and smart bioprocess control equipment can enhance process development at the bench or lab scale and lead to a better route to scale up operations. In larger scale operations, especially in commercial manufacturing, GMP regulations apply due to which process deviations can result in significant losses to revenue and production thus creating the need for precise measuring devices.

Measurement Technology in Downstream Processing Market

Therefore, the use of improved sensor technology is crucial in optimizing processing parameters and thus is likely to drive the growth of measurement technology in downstream processing market.

Considering this, it is expected for the global measurement technology in downstream processing market to grow at a CAGR of 6.1% through 2028.

What is COVID-19 Impact on measurement technology in downstream processing market?

The Covid-19 pandemic has created varied effects on the measurement technology in downstream processing market. While the initial days of the pandemic in 2020 were characterized by supply chain disruptions, the market has now effectively contended with these disruptions.

Though certain supply chain related alterations for the market are a permanent feature that will continue for at least the next ten years, the larger take away for the market is now in terms of consumption patterns and demand for measurement technology in downstream processing in terms of Products that are sought after.

Additionally, Consumer behavior connected to epidemiological stages and government responses to the pandemic is resulting in escalation, accumulation, and early recovery of the market.

Sabyasachi Ghosh
Sabyasachi Ghosh

Principal Consultant

Talk to Analyst

Find your sweet spots for generating winning opportunities in this market.

Which Factors Are Restraining Demand for Measurement technology in downstream processing market?

High failure rates in conventional sensors limiting use in large-scale applications is expected to hamper the growth of market over the forecast period. Conventional sensors such as electrochemical DO probes have exhibited high failure rates due to deposition at the membrane where process liquid contact occurs.

Continuous biopharmaceutical manufacturing may be consistent with FDA’s Quality by Design (QbD) efforts, but there is still untapped potential for manufacturers of bioprocessing equipment to improve product quality assurance.

Sensors contributes in providing product quality, lowering the manufacturing cycle time, and reducing capital costs & time by stabilizing bioprocessing operations. So, failure of this sensors may result in declining the market growth to some extent for the Measurement technology in downstream processing market.
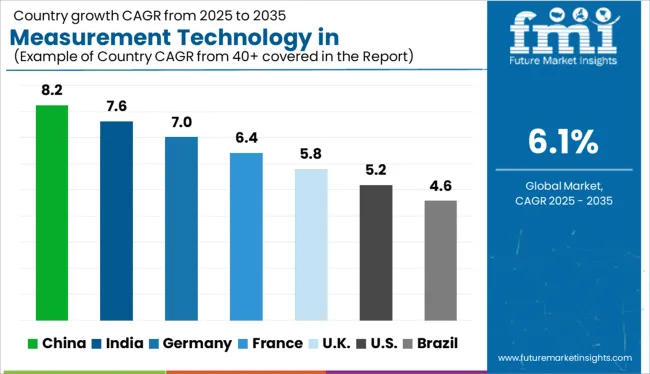
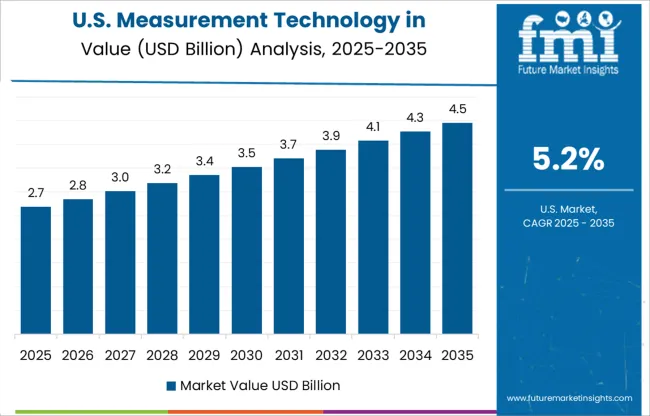
Country-wise Insights

What Makes the U.S. a Large Market for Measurement technology in downstream processing market?

The U.S. is estimated to account for over 95.3% of the North America measurement technology in downstream processing market demand in 2022. High adoption rate of automated in bioprocessing system.

Many bioprocessing vendors in U.S are adopting developed technologies that typically address automation challenges, extending from software development and integration, to continuous process. Accessibility of technical resources and an enhanced knowledge to improve the quality of research and success rates, thereby bringing more novel therapeutics to the market.
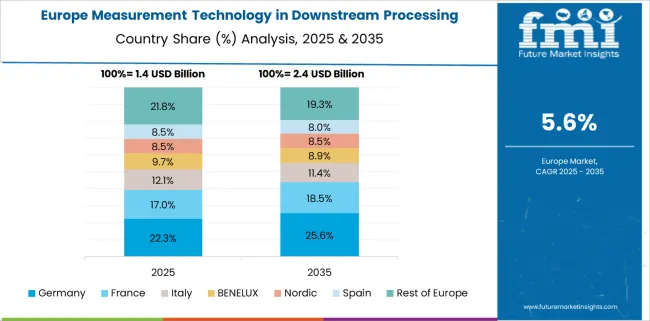
Why is Germany Considered a Lucrative in Measurement technology in downstream process market?

Germany is estimated to account for 34.5% market share in Europe in 2022. Factors such as increase in presence of research and development program, adequate research infrastructure with satisfactory results for biologics is boosting the demand for measurement technology in downstream processing market in Germany.

To enable collaboration and cross-functional research and development, several different for-profit and not-for-profit agencies have come forth to bringing innovative therapeutic biological options for chronic disease. This bring positive growth for market in Germany.

What are the Factors Fueling the Demand for measurement technology in downstream processing market in China?

China is estimated to account for 49.8% of the East Asia market by 2022 owing to shift of investment in R&D and technology, especially in the life sciences, from North America and Europe to Asia Pacific.

China government have started taking initiatives to support growth of the local biotechnology industry by offering tax exclusions for R&D, increased budgets and funding’s. So more focus is generated to develop effective measuring tool for biological products for measurement technology in downstream processing market.

How will the Measurement technology in downstream processing market growth Across India?

Demand for measurement technology in downstream processing market in India is expected to rise at an impressive growth opportunities with 9.6% CAGR over the forecast period.

Developing countries like India have ample qualified manpower and skilled labor at reasonable costs thereby raising the scope for attracting outsourcing of biotechnology projects this is responsible for the growth of the market in India.

Get the data you need at a Fraction of the cost

Personalize your report by choosing insights you need
and save 40%!

Category-wise Insights

Demand for Sensors to continue gaining Traction by Product?

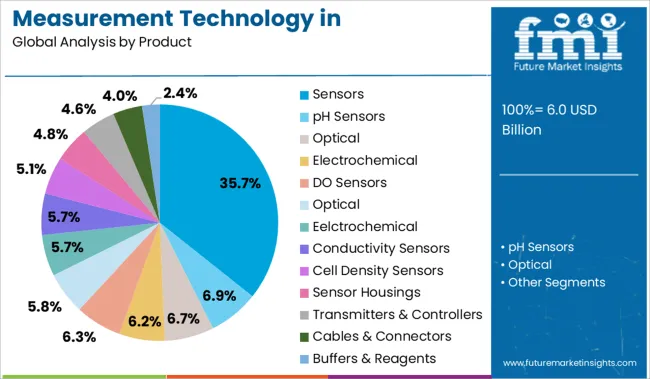
By Product, the sensors segment is anticipated to hold the maximum share of 49.8% in 2022.  Sensors play important role in biological production and technological advancement in sensor which will give boost to market.

Life science and downstream processing technology have moved to a great extent of sensing and automated process control as new technologies including wireless sensors such as VisiPro DO sensor, Contactless optical DO sensors etc. are introduced in the market. This provides huge opportunity for product business to existing players in the market

This advanced sensors are highly adopted by researcher and biopharmaceutical companies, due to which there is a significant demand for sensors over the forecast period.

Why Single-use by modality have high adoption?

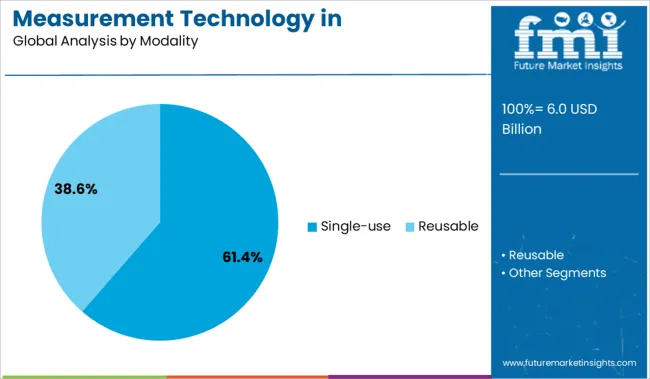
Demand for single-use by modality are expected to rise at an impressive 6.9% CAGR over the forecast period. Due to its numerous advantage of single-use unit measurement technology in downstream processing for step by steps detection in various analytical system as well as optimization, and elimination of standardization steps, the market is witness growth during the forecast period.

Moreover, single-use measuring products are rapidly becoming commonplace at not just the lab or bench scale, but also at commercial scale due to ease of use and limited potential for cross-contamination which give global traction to measurement technology in downstream processing market.

Which End User will hold the most of the market share?

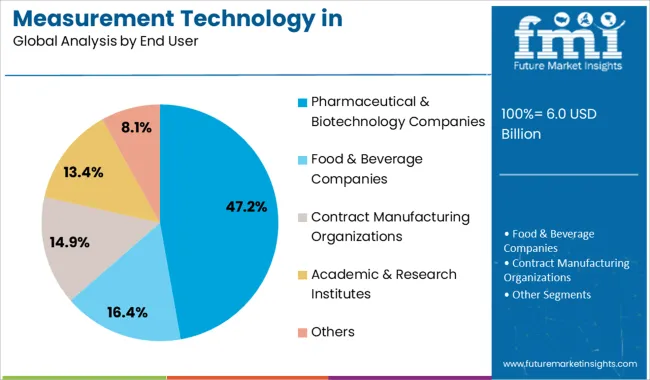
By end user, pharmaceutical & biotechnology company segment lead the market with market share of 42.8% in 2022. Most of the pharma and biopharma players focus in collaboration with research institutes to increase their product portfolio.

Moreover, most of companies’ revenue is spend towardss research and development department where measuring tool is highly used. So, large biopharmaceutical companies hold large share in measurement technology in downstream processing market.
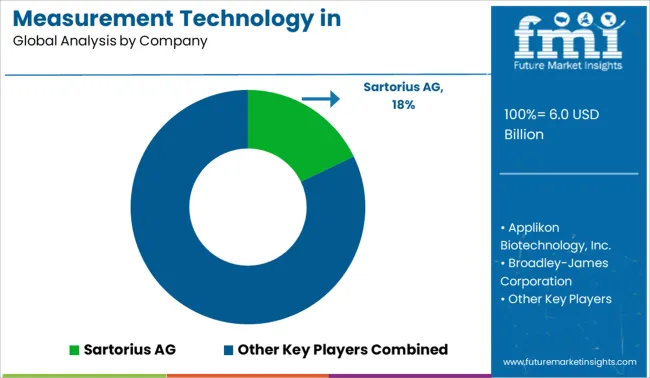
Competitive Landscape

Companies operating in the measurement technology in downstream processing market devices are actively seeking to strengthen their position through expansion, and merger & acquisition, with established as well as emerging market players.

Some of the recent instances include:

  • In April 2021, Thermo Fisher Scientific Acquired PPD, Inc., a Leading Clinical Research Organization to Further expands service offering to pharma and biotech customers.
  • In 2021, Sartorius strengthens its product portfolio with respect to cell and gene therapy by acquiring a key stake in CellGenix.

Scope of the Report

Attribute Details
Forecast Period 2022 to 2028
Historical Data Available for 2012 to 2021
Market Analysis USD Billion for Value and Volume in Unit
Key Countries Covered USA, Canada, Brazil, Mexico, Argentina, Germany, UK, France, Italy, Spain, BENELUX, Russia, Poland, Nordic, China, Japan, South Korea, India, Australia, New Zealand, GCC Countries, South Africa
Key Segments Covered Product, Modality, End User and Region
Key Companies Profiled Applikon Biotechnology Inc.; Sartorius AG; Broadley-James Corporation; Thermo Fisher Scientific Inc.; Hamilton Company; Waters Corporation; PreSens Precision Sensing GmbH; PendoTECH LLC; Endress+Hauser AG; Mettler-Toledo International Inc.; Metroglas AG; Madison; YSI; Evoqua; Sensorex; Forbes
Report Coverage Market Forecast, Competition Intelligence, DROT Analysis, Market Dynamics and Challenges, Strategic Growth Initiatives
Customization & Pricing Available upon Request

Measurement technology in downstream processing market by Category

By Product:

  • Sensors
    • pH Sensors
      • Optical
      • Electrochemical
    • DO Sensors
      • Optical
      • Eelctrochemical
    • Conductivity Sensors
    • Cell Density Sensors
  • Sensor Housings
  • Transmitters & Controllers
  • Cables & Connectors
  • Buffers & Reagents

By Modality:

  • Single-use
  • Reusable

By End User:

  • Pharmaceutical & Biotechnology Companies
  • Food & Beverage Companies
  • Contract Manufacturing Organizations
  • Academic & Research Institutes
  • Others

By Region:

  • North America
  • Latin America
  • Western Europe
  • Eastern Europe
  • Asia-Pacific excluding Japan
  • Japan
  • Middle East & Africa

Frequently Asked Questions

How is the value for measurement technology in downstream processing market currently worth?

The global measurement technology in downstream processing market is worth US$ 4.7 Bn in 2021 and is set to expand with CAGR of 6.1% over forecast period.

What will be demand outlook/sales forecast of measurement technology in downstream processing market?

The market is expected to reach US$ 7.2 Bn by the end of 2028.

What was Historical market CAGR?

The sales of measurement technology in downstream processing market have grown at a CAGR of nearly 5.6% between 2012 and 2021.

What are the top 5 countries driving demand for measurement technology in downstream processing market?

U.S., Germany, U.K., china and japan are the top 5 countries that are driving the demand for Tinnitus Management.

What is the Western Europe market Outlook?

Western Europe is one of the key region dominating with 40.5% market share in 2022.

Table of Content
1. Executive Summary

    1.1. Market Overview

    1.2. Market Analysis

    1.3. FMI Analysis and Recommendations

    1.4. Wheel of Fortune

2. Market Introduction

    2.1. Market Definition

    2.2. Market Taxonomy

3. Market Viewpoint

    3.1. Macro-Economic Factors

    3.2. Opportunity Analysis

    3.3. Pricing Analysis

4. North America Market Analysis 2012–2021 and Forecast 2022–2028

    4.1. Introduction

    4.2. Pricing Analysis

    4.3. Regional Market Dynamics

        4.3.1. Drivers

        4.3.2. Restraints

        4.3.3. Trends

    4.4. Historical Market Size (US$ Mn) and Volume By Country, 2012-2021

        4.4.1. U.S.

        4.4.2. Canada

    4.5. Market Size (US$ Mn) and Volume Forecast By Country, 2022-2028

        4.5.1. U.S.

        4.5.2. Canada

    4.6. Historical Market Size (US$ Mn) and Volume By Product Type, 2012-2021

        4.6.1. Sensors

            4.6.1.1. pH Sensors

                4.6.1.1.1. Optical

                4.6.1.1.2. Electrochemical

            4.6.1.2. Dissolved Oxygen (DO) Sensors

                4.6.1.2.1. Optical

                4.6.1.2.2. Electrochemical

            4.6.1.3. ORP Sensors

            4.6.1.4. Conductivity Sensors

            4.6.1.5. Cell Density Sensors

        4.6.2. Sensor Housings

        4.6.3. Transmitters and Controllers

        4.6.4. Cables and Connectors

        4.6.5. Buffers and Standard Reagents

    4.7. Market Size (US$ Mn) and Volume Forecast By Product Type, 2022-2028

        4.7.1. Sensors

            4.7.1.1. pH Sensors

                4.7.1.1.1. Optical

                4.7.1.1.2. Electrochemical

            4.7.1.2. Dissolved Oxygen (DO) Sensors

                4.7.1.2.1. Optical

                4.7.1.2.2. Electrochemical

            4.7.1.3. ORP Sensors

            4.7.1.4. Conductivity Sensors

            4.7.1.5. Cell Density Sensors

        4.7.2. Sensor Housings

        4.7.3. Transmitters and Controllers

        4.7.4. Cables and Connectors

        4.7.5. Buffers and Standard Reagents

    4.8. Historical Market Size (US$ Mn) and Volume By Modality, 2012-2021

        4.8.1. Single-use

        4.8.2. Reusable

    4.9. Market Size (US$ Mn) and Volume Forecast By Modality, 2022-2028

        4.9.1. Single-use

        4.9.2. Reusable

    4.10. Historical Market Size (US$ Mn) By End User, 2012-2021

        4.10.1. Biopharmaceutical Companies

        4.10.2. Food & Beverage Companies

        4.10.3. Contract Manufacturing Organizations

        4.10.4. Academic and Research Institutes

        4.10.5. Others

    4.11. Market Size (US$ Mn) Forecast By End User, 2022-2028

        4.11.1. Biopharmaceutical Companies

        4.11.2. Food & Beverage Companies

        4.11.3. Contract Manufacturing Organizations

        4.11.4. Academic and Research Institutes

        4.11.5. Others

    4.12. Drivers and Restraints: Impact Analysis

    4.13. Market Attractiveness Analysis

        4.13.1. By Country

        4.13.2. By Product Type

        4.13.3. By Modality

        4.13.4. By End User

    4.14. Key Representative Market Participants

    4.15. Key Participants Market Presence (Intensity Map)

5. Latin America Market Analysis 2012–2021 and Forecast 2022–2028

    5.1. Introduction

    5.2. Pricing Analysis

    5.3. Regional Market Dynamics

        5.3.1. Drivers

        5.3.2. Restraints

        5.3.3. Trends

    5.4. Historical Market Size (US$ Mn) and Volume By Country, 2012-2021

        5.4.1. Brazil

        5.4.2. Mexico

        5.4.3. Rest of Latin America

    5.5. Market Size (US$ Mn) and Volume Forecast By Country, 2022-2028

        5.5.1. Brazil

        5.5.2. Mexico

        5.5.3. Argentina

        5.5.4. Rest of Latin America

    5.6. Historical Market Size (US$ Mn) and Volume By Product Type, 2012-2021

        5.6.1. Sensors

            5.6.1.1. pH Sensors

                5.6.1.1.1. Optical

                5.6.1.1.2. Electrochemical

            5.6.1.2. Dissolved Oxygen (DO) Sensors

                5.6.1.2.1. Optical

                5.6.1.2.2. Electrochemical

            5.6.1.3. ORP Sensors

            5.6.1.4. Conductivity Sensors

            5.6.1.5. Cell Density Sensors

        5.6.2. Transmitters and Controllers

        5.6.3. Sensor Housings

        5.6.4. Cables and Connectors

        5.6.5. Buffers and Standard Reagents

    5.7. Market Size (US$ Mn) and Volume Forecast By Product Type, 2022-2028

        5.7.1. Sensors

            5.7.1.1. pH Sensors

                5.7.1.1.1. Optical

                5.7.1.1.2. Electrochemical

            5.7.1.2. Dissolved Oxygen (DO) Sensors

                5.7.1.2.1. Optical

                5.7.1.2.2. Electrochemical

            5.7.1.3. ORP Sensors

            5.7.1.4. Conductivity Sensors

            5.7.1.5. Cell Density Sensors

        5.7.2. Transmitters and Controllers

        5.7.3. Sensor Housings

        5.7.4. Cables and Connectors

        5.7.5. Buffers and Standard Reagents

    5.8. Historical Market Size (US$ Mn) and Volume By Modality, 2012-2021

        5.8.1. Single-use

        5.8.2. Reusable

    5.9. Market Size (US$ Mn) and Volume Forecast By Modality, 2022-2028

        5.9.1. Single-use

        5.9.2. Reusable

    5.10. Historical Market Size (US$ Mn) By End User, 2012-2021

        5.10.1. Biopharmaceutical Companies

        5.10.2. Food & Beverage Companies

        5.10.3. Contract Manufacturing Organizations

        5.10.4. Academic and Research Institutes

        5.10.5. Others

    5.11. Market Size (US$ Mn) Forecast By End User, 2022-2028

        5.11.1. Biopharmaceutical Companies

        5.11.2. Food & Beverage Companies

        5.11.3. Contract Manufacturing Organizations

        5.11.4. Academic and Research Institutes

        5.11.5. Others

    5.12. Drivers and Restraints: Impact Analysis

    5.13. Market Attractiveness Analysis

        5.13.1. By Country

        5.13.2. By Product Type

        5.13.3. By Modality

        5.13.4. By End User

    5.14. Key Representative Market Participants

    5.15. Key Participants Market Presence (Intensity Map)

6. Western Europe Market Analysis 2012–2021 and Forecast 2022–2028

    6.1. Introduction

    6.2. Pricing Analysis

    6.3. Regional Market Dynamics

        6.3.1. Drivers

        6.3.2. Restraints

        6.3.3. Trends

    6.4. Historical Market Size (US$ Mn) and Volume By Country, 2012-2021

        6.4.1. Germany

        6.4.2. United Kingdom

        6.4.3. France

        6.4.4. Italy

        6.4.5. Spain

        6.4.6. Benelux

        6.4.7. Nordic Region

        6.4.8. Rest of Western Europe

    6.5. Market Size (US$ Mn) and Volume Forecast By Country, 2022-2028

        6.5.1. Germany

        6.5.2. United Kingdom

        6.5.3. France

        6.5.4. Italy

        6.5.5. Spain

        6.5.6. Benelux

        6.5.7. Nordic Region

        6.5.8. Rest of Western Europe

    6.6. Historical Market Size (US$ Mn) and Volume By Product Type, 2012-2021

        6.6.1. Sensors

            6.6.1.1. pH Sensors

                6.6.1.1.1. Optical

                6.6.1.1.2. Electrochemical

            6.6.1.2. Dissolved Oxygen (DO) Sensors

                6.6.1.2.1. Optical

                6.6.1.2.2. Electrochemical

            6.6.1.3. ORP Sensors

            6.6.1.4. Conductivity Sensors

            6.6.1.5. Cell Density Sensors

        6.6.2. Transmitters and Controllers

        6.6.3. Sensor Housings

        6.6.4. Cables and Connectors

        6.6.5. Buffers and Standard Reagents

    6.7. Market Size (US$ Mn) and Volume Forecast By Product Type, 2022-2028

        6.7.1. Sensors

            6.7.1.1. pH Sensors

                6.7.1.1.1. Optical

                6.7.1.1.2. Electrochemical

            6.7.1.2. Dissolved Oxygen (DO) Sensors

                6.7.1.2.1. Optical

                6.7.1.2.2. Electrochemical

            6.7.1.3. ORP Sensors

            6.7.1.4. Conductivity Sensors

            6.7.1.5. Cell Density Sensors

        6.7.2. Transmitters and Controllers

        6.7.3. Sensor Housings

        6.7.4. Cables and Connectors

        6.7.5. Buffers and Standard Reagents

    6.8. Historical Market Size (US$ Mn) and Volume By Modality, 2012-2021

        6.8.1. Single-use

        6.8.2. Reusable

    6.9. Market Size (US$ Mn) and Volume Forecast By Modality, 2022-2028

        6.9.1. Single-use

        6.9.2. Reusable

    6.10. Historical Market Size (US$ Mn) By End User, 2012-2021

        6.10.1. Biopharmaceutical Companies

        6.10.2. Food & Beverage Companies

        6.10.3. Contract Manufacturing Organizations

        6.10.4. Academic and Research Institutes

        6.10.5. Others

    6.11. Market Size (US$ Mn) Forecast By End User, 2022-2028

        6.11.1. Biopharmaceutical Companies

        6.11.2. Food & Beverage Companies

        6.11.3. Contract Manufacturing Organizations

        6.11.4. Academic and Research Institutes

        6.11.5. Others

    6.12. Drivers and Restraints: Impact Analysis

    6.13. Market Attractiveness Analysis

        6.13.1. By Country

        6.13.2. By Product Type

        6.13.3. By Modality

        6.13.4. By End User

    6.14. Key Representative Market Participants

    6.15. Key Participants Market Presence (Intensity Map)

7. Eastern Europe Market Analysis 2012–2021 and Forecast 2022–2028

    7.1. Introduction

    7.2. Pricing Analysis

    7.3. Regional Market Dynamics

        7.3.1. Drivers

        7.3.2. Restraints

        7.3.3. Trends

    7.4. Historical Market Size (US$ Mn) and Volume By Country, 2012-2021

        7.4.1. Russia

        7.4.2. Poland

        7.4.3. Rest of Eastern Europe

    7.5. Market Size (US$ Mn) and Volume Forecast By Country, 2022-2028

        7.5.1. Russia

        7.5.2. Poland

        7.5.3. Rest of Eastern Europe

    7.6. Historical Market Size (US$ Mn) and Volume By Product Type, 2012-2021

        7.6.1. Sensors

            7.6.1.1. pH Sensors

                7.6.1.1.1. Optical

                7.6.1.1.2. Electrochemical

            7.6.1.2. Dissolved Oxygen (DO) Sensors

                7.6.1.2.1. Optical

                7.6.1.2.2. Electrochemical

            7.6.1.3. ORP Sensors

            7.6.1.4. Conductivity Sensors

            7.6.1.5. Cell Density Sensors

        7.6.2. Transmitters and Controllers

        7.6.3. Sensor Housings

        7.6.4. Cables and Connectors

        7.6.5. Buffers and Standard Reagents

    7.7. Market Size (US$ Mn) and Volume Forecast By Product Type, 2022-2028

        7.7.1. Sensors

            7.7.1.1. pH Sensors

                7.7.1.1.1. Optical

                7.7.1.1.2. Electrochemical

            7.7.1.2. Dissolved Oxygen (DO) Sensors

                7.7.1.2.1. Optical

                7.7.1.2.2. Electrochemical

            7.7.1.3. ORP Sensors

            7.7.1.4. Conductivity Sensors

            7.7.1.5. Cell Density Sensors

        7.7.2. Transmitters and Controllers

        7.7.3. Sensor Housings

        7.7.4. Cables and Connectors

        7.7.5. Buffers and Standard Reagents

    7.8. Historical Market Size (US$ Mn) and Volume By Modality, 2012-2021

        7.8.1. Single-use

        7.8.2. Reusable

    7.9. Market Size (US$ Mn) and Volume Forecast By Modality, 2022-2028

        7.9.1. Single-use

        7.9.2. Reusable

    7.10. Historical Market Size (US$ Mn) By End User, 2012-2021

        7.10.1. Biopharmaceutical Companies

        7.10.2. Food & Beverage Companies

        7.10.3. Contract Manufacturing Organizations

        7.10.4. Academic and Research Institutes

        7.10.5. Others

    7.11. Market Size (US$ Mn) Forecast By End User, 2022-2028

        7.11.1. Biopharmaceutical Companies

        7.11.2. Food & Beverage Companies

        7.11.3. Contract Manufacturing Organizations

        7.11.4. Academic and Research Institutes

        7.11.5. Others

    7.12. Drivers and Restraints: Impact Analysis

    7.13. Market Attractiveness Analysis

        7.13.1. By Country

        7.13.2. By Product Type

        7.13.3. By Modality

        7.13.4. By End User

    7.14. Key Representative Market Participants

    7.15. Key Participants Market Presence (Intensity Map)

8. Asia Pacific excluding Japan Market Analysis 2012–2021 and Forecast 2022–2028

    8.1. Introduction

    8.2. Pricing Analysis

    8.3. Regional Market Dynamics

        8.3.1. Drivers

        8.3.2. Restraints

        8.3.3. Trends

    8.4. Historical Market Size (US$ Mn) and Volume By Country, 2012-2021

        8.4.1. China

        8.4.2. India

        8.4.3. Australia and New Zealand

        8.4.4. South Korea

        8.4.5. Rest of APEJ

    8.5. Market Size (US$ Mn) and Volume Forecast By Country, 2022-2028

        8.5.1. China

        8.5.2. India

        8.5.3. Australia and New Zealand

        8.5.4. South Korea

        8.5.5. Rest of APEJ

    8.6. Historical Market Size (US$ Mn) and Volume By Product Type, 2012-2021

        8.6.1. Sensors

            8.6.1.1. pH Sensors

                8.6.1.1.1. Optical

                8.6.1.1.2. Electrochemical

            8.6.1.2. Dissolved Oxygen (DO) Sensors

                8.6.1.2.1. Optical

                8.6.1.2.2. Electrochemical

            8.6.1.3. ORP Sensors

            8.6.1.4. Conductivity Sensors

            8.6.1.5. Cell Density Sensors

        8.6.2. Transmitters and Controllers

        8.6.3. Sensor Housings

        8.6.4. Cables and Connectors

        8.6.5. Buffers and Standard Reagents

    8.7. Market Size (US$ Mn) and Volume Forecast By Product Type, 2022-2028

        8.7.1. Sensors

            8.7.1.1. pH Sensors

                8.7.1.1.1. Optical

                8.7.1.1.2. Electrochemical

            8.7.1.2. Dissolved Oxygen (DO) Sensors

                8.7.1.2.1. Optical

                8.7.1.2.2. Electrochemical

            8.7.1.3. ORP Sensors

            8.7.1.4. Conductivity Sensors

            8.7.1.5. Cell Density Sensors

        8.7.2. Transmitters and Controllers

        8.7.3. Sensor Housings

        8.7.4. Cables and Connectors

        8.7.5. Buffers and Standard Reagents

    8.8. Historical Market Size (US$ Mn) and Volume By Modality, 2012-2021

        8.8.1. Single-use

        8.8.2. Reusable

    8.9. Market Size (US$ Mn) and Volume Forecast By Modality, 2022-2028

        8.9.1. Single-use

        8.9.2. Reusable

    8.10. Historical Market Size (US$ Mn) By End User, 2012-2021

        8.10.1. Biopharmaceutical Companies

        8.10.2. Food & Beverage Companies

        8.10.3. Contract Manufacturing Organizations

        8.10.4. Contract Research Organizations

        8.10.5. Academic and Research Institutes

        8.10.6. Others

    8.11. Market Size (US$ Mn) Forecast By End User, 2022-2028

        8.11.1. Biopharmaceutical Companies

        8.11.2. Food & Beverage Companies

        8.11.3. Contract Manufacturing Organizations

        8.11.4. Contract Research Organizations

        8.11.5. Academic and Research Institutes

        8.11.6. Others

    8.12. Drivers and Restraints: Impact Analysis

    8.13. Market Attractiveness Analysis

        8.13.1. By Country

        8.13.2. By Product Type

        8.13.3. By Modality

        8.13.4. By End User

    8.14. Key Representative Market Participants

    8.15. Key Participants Market Presence (Intensity Map)

9. Japan Market Analysis 2012–2021 and Forecast 2022–2028

    9.1. Introduction

    9.2. Pricing Analysis

    9.3. Regional Market Dynamics

        9.3.1. Drivers

        9.3.2. Restraints

        9.3.3. Trends

    9.4. Historical Market Size (US$ Mn) and Volume By Product Type, 2012-2021

        9.4.1. Sensors

            9.4.1.1. pH Sensors

                9.4.1.1.1. Optical

                9.4.1.1.2. Electrochemical

            9.4.1.2. Dissolved Oxygen (DO) Sensors

                9.4.1.2.1. Optical

                9.4.1.2.2. Electrochemical

            9.4.1.3. ORP Sensors

            9.4.1.4. Conductivity Sensors

            9.4.1.5. Cell Density Sensors

        9.4.2. Transmitters and Controllers

        9.4.3. Sensor Housings

        9.4.4. Cables and Connectors

        9.4.5. Buffers and Standard Reagents

    9.5. Market Size (US$ Mn) and Volume Forecast By Product Type, 2022-2028

        9.5.1. Sensors

            9.5.1.1. pH Sensors

                9.5.1.1.1. Optical

                9.5.1.1.2. Electrochemical

            9.5.1.2. Dissolved Oxygen (DO) Sensors

                9.5.1.2.1. Optical

                9.5.1.2.2. Electrochemical

            9.5.1.3. ORP Sensors

            9.5.1.4. Conductivity Sensors

            9.5.1.5. Cell Density Sensors

        9.5.2. Transmitters and Controllers

        9.5.3. Sensor Housings

        9.5.4. Cables and Connectors

        9.5.5. Buffers and Standard Reagents

    9.6. Historical Market Size (US$ Mn) and Volume By Modality, 2012-2021

        9.6.1. Single-use

        9.6.2. Reusable

    9.7. Market Size (US$ Mn) and Volume Forecast By Modality, 2022-2028

        9.7.1. Single-use

        9.7.2. Reusable

    9.8. Historical Market Size (US$ Mn) By End User, 2012-2021

        9.8.1. Biopharmaceutical Companies

        9.8.2. Food & Beverage Companies

        9.8.3. Contract Manufacturing Organizations

        9.8.4. Contract Research Organizations

        9.8.5. Academic and Research Institutes

        9.8.6. Others

    9.9. Market Size (US$ Mn) Forecast By End User, 2022-2028

        9.9.1. Biopharmaceutical Companies

        9.9.2. Food & Beverage Companies

        9.9.3. Contract Manufacturing Organizations

        9.9.4. Contract Research Organizations

        9.9.5. Academic and Research Institutes

        9.9.6. Others

    9.10. Drivers and Restraints: Impact Analysis

    9.11. Market Attractiveness Analysis

        9.11.1. By Product Type

        9.11.2. By Modality

        9.11.3. By End User

    9.12. Key Representative Market Participants

    9.13. Key Participants Market Presence (Intensity Map)

10. Middle East & Africa Market Analysis 2012–2021 and Forecast 2022–2028

    10.1. Introduction

    10.2. Pricing Analysis

    10.3. Regional Market Dynamics

        10.3.1. Drivers

        10.3.2. Restraints

        10.3.3. Trends

    10.4. Historical Market Size (US$ Mn) and Volume By Country, 2012-2021

        10.4.1. GCC Countries

        10.4.2. South Africa

        10.4.3. Rest of MEA

    10.5. Market Size (US$ Mn) and Volume Forecast By Country, 2022-2028

        10.5.1. GCC Countries

        10.5.2. South Africa

        10.5.3. Rest of MEA

    10.6. Historical Market Size (US$ Mn) and Volume By Product Type, 2012-2021

        10.6.1. Sensors

            10.6.1.1. pH Sensors

                10.6.1.1.1. Optical

                10.6.1.1.2. Electrochemical

            10.6.1.2. Dissolved Oxygen (DO) Sensors

                10.6.1.2.1. Optical

                10.6.1.2.2. Electrochemical

            10.6.1.3. ORP Sensors

            10.6.1.4. Conductivity Sensors

            10.6.1.5. Cell Density Sensors

        10.6.2. Transmitters and Controllers

        10.6.3. Sensor Housings

        10.6.4. Cables and Connectors

        10.6.5. Buffers and Standard Reagents

    10.7. Market Size (US$ Mn) and Volume Forecast By Product Type, 2022-2028

        10.7.1. Sensors

            10.7.1.1. pH Sensors

                10.7.1.1.1. Optical

                10.7.1.1.2. Electrochemical

            10.7.1.2. Dissolved Oxygen (DO) Sensors

                10.7.1.2.1. Optical

                10.7.1.2.2. Electrochemical

            10.7.1.3. ORP Sensors

            10.7.1.4. Conductivity Sensors

            10.7.1.5. Cell Density Sensors

        10.7.2. Transmitters and Controllers

        10.7.3. Sensor Housings

        10.7.4. Cables and Connectors

        10.7.5. Buffers and Standard Reagents

    10.8. Historical Market Size (US$ Mn) and Volume By Modality, 2012-2021

        10.8.1. Single-use

        10.8.2. Reusable

    10.9. Market Size (US$ Mn) and Volume Forecast By Modality, 2022-2028

        10.9.1. Single-use

        10.9.2. Reusable

    10.10. Historical Market Size (US$ Mn) By End User, 2012-2021

        10.10.1. Biopharmaceutical Companies

        10.10.2. Food & Beverage Companies

        10.10.3. Contract Manufacturing Organizations

        10.10.4. Contract Research Organizations

        10.10.5. Academic and Research Institutes

        10.10.6. Others

    10.11. Market Size (US$ Mn) Forecast By End User, 2022-2028

        10.11.1. Biopharmaceutical Companies

        10.11.2. Food & Beverage Companies

        10.11.3. Contract Manufacturing Organizations

        10.11.4. Contract Research Organizations

        10.11.5. Academic and Research Institutes

        10.11.6. Others

    10.12. Drivers and Restraints: Impact Analysis

    10.13. Market Attractiveness Analysis

        10.13.1. By Country

        10.13.2. By Product Type

        10.13.3. By Modality

        10.13.4. By End User

    10.14. Key Representative Market Participants

    10.15. Key Participants Market Presence (Intensity Map)

11. Competition Landscape

    11.1. Market Structure

    11.2. Market Share Analysis (2021)

    11.3. Competition Intensity Mapping By Market Taxonomy

    11.4. Competition Dashboard

    11.5. Company Profiles (Details – Overview, Financials, Strategy, Recent Developments)

        11.5.1. Applikon Biotechnology, Inc.

        11.5.2. Broadley-James Corporation

        11.5.3. Endress+Hauser AG

        11.5.4. Thermo Fisher Scientific

        11.5.5. Hamilton Company

        11.5.6. Mettler-Toledo International, Inc.

        11.5.7. PendoTECH

        11.5.8. PreSens Precision Sensing GmbH

        11.5.9. Sartorius AG

12. Global Market Analysis and Forecast, By Region

    12.1. Historical Market Size (US$ Mn) and Volume By Region, 2012-2021

        12.1.1. North America

        12.1.2. Latin America

        12.1.3. Western Europe

        12.1.4. Eastern Europe

        12.1.5. Asia Pacific Excl. Japan (APEJ)

        12.1.6. Japan

        12.1.7. Middle East and Africa (MEA)

    12.2. Market Size (US$ Mn) and Volume Forecast By Region, 2022-2028

        12.2.1. North America

        12.2.2. Latin America

        12.2.3. Western Europe

        12.2.4. Eastern Europe

        12.2.5. Asia Pacific Excl. Japan (APEJ)

        12.2.6. Japan

        12.2.7. Middle East and Africa (MEA)

    12.3. Market Attractiveness Analysis By Region

13. Global Market Analysis and Forecast, By Product Type

    13.1. Introduction

    13.2. Historical Market Size (US$ Mn) and Volume By Product Type, 2012-2021

        13.2.1. Sensors

            13.2.1.1. pH Sensors

                13.2.1.1.1. Optical

                13.2.1.1.2. Electrochemical

            13.2.1.2. Dissolved Oxygen (DO) Sensors

                13.2.1.2.1. Optical

                13.2.1.2.2. Electrochemical

            13.2.1.3. ORP Sensors

            13.2.1.4. Conductivity Sensors

            13.2.1.5. Cell Density Sensors

        13.2.2. Transmitters and Controllers

        13.2.3. Sensor Housings

        13.2.4. Cables and Connectors

        13.2.5. Buffers and Standard Reagents

    13.3. Market Size (US$ Mn) and Volume Forecast By Product Type, 2022-2028

        13.3.1. Sensors

            13.3.1.1. pH Sensors

                13.3.1.1.1. Optical

                13.3.1.1.2. Electrochemical

            13.3.1.2. Dissolved Oxygen (DO) Sensors

                13.3.1.2.1. Optical

                13.3.1.2.2. Electrochemical

            13.3.1.3. ORP Sensors

            13.3.1.4. Conductivity Sensors

            13.3.1.5. Cell Density Sensors

        13.3.2. Transmitters and Controllers

        13.3.3. Sensor Housings

        13.3.4. Cables and Connectors

        13.3.5. Buffers and Standard Reagents

    13.4. Market Attractiveness Analysis By Product Type

14. Global Market Analysis and Forecast, By Modality

    14.1. Introduction

    14.2. Historical Market Size (US$ Mn) and Volume By Modality, 2012-2021

        14.2.1. Single-use

        14.2.2. Reusable

    14.3. Market Size (US$ Mn) and Volume Forecast By Modality, 2022-2028

        14.3.1. Single-use

        14.3.2. Reusable

    14.4. Market Attractiveness Analysis By Modality

15. Global Market Analysis and Forecast, By End User

    15.1. Introduction

    15.2. Historical Market Size (US$ Mn) By End User, 2012-2021

        15.2.1. Biopharmaceutical Companies

        15.2.2. Food & Beverage Companies

        15.2.3. Contract Manufacturing Organizations

        15.2.4. Academic and Research Institutes

        15.2.5. Others

    15.3. Market Size (US$ Mn) Forecast By End User, 2022-2028

        15.3.1. Biopharmaceutical Companies

        15.3.2. Food & Beverage Companies

        15.3.3. Contract Manufacturing Organizations

        15.3.4. Academic and Research Institutes

        15.3.5. Others

    15.4. Market Attractiveness Analysis By End User

16. Global Market Analysis 2012–2021 and Forecast 2022–2028

    16.1. Market Size and Y-o-Y Growth

    16.2. Absolute $ Opportunity

17. Assumptions and Acronyms Used

18. Research Methodology

Explore Healthcare Insights

View Reports
Future Market Insights

Measurement Technology in Downstream Processing Market