Reports

- Global Locations -

Headquarters

Future Market Insights, Inc.

Christiana Corporate, 200
Continental Drive, Suite 401,
Newark, Delaware - 19713,
United States

T: +1-845-579-5705

Americas

Future Market Insights, Inc.

616 Corporate Way, Suite 2-9018,
Valley Cottage, NY 10989, United States

T: +1-347-918-3531

MEA

Future Market Insights

1602-6 Jumeirah Bay X2 Tower, Plot No: JLT-PH2-X2A,
Jumeirah Lakes Towers, Dubai,
United Arab Emirates

Europe

Future Market Insights

3rd Floor, 207 Regent Street,
W1B 3HH London
United Kingdom

T: + 44 (0) 20 8123 9659
D: +44 (0) 20 3287 4268

Asia Pacific

Future Market Insights

IndiaLand Global Tech Park, Unit UG-1, Behind Grand HighStreet, Phase 1, Hinjawadi, MH, Pune – 411057, India

Non-ionizing Radiation EMF Detection, Measurement, and Safety Market Outlook (2022 to 2032)

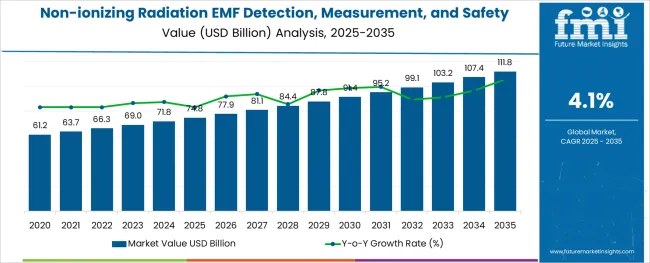
[308 Pages Report] The non-ionizing radiation EMF detection, measurement, and safety market are anticipated to have a steady CAGR of 3.6% during the period 2022 to 2032.

The non-ionizing radiation EMF detection, measurement, and safety market share is predicted to grow from US$ 66.3 Billion in 2022 to US$ 94.5 Billion in 2032. Previously, the non-ionizing radiation EMF detection, measurement, and safety growth was thriving at a higher CAGR of 4.1% (2016 to 2021), resulting in a market size of US$ 63 Billion in 2021.

Investments in the non-ionizing radiation EMF detection, measurement, and safety market have gained pace in the military and homeland security sectors because of the growing threat of electronic warfare. Market manufacturers are focusing on producing highly accurate and long-lasting detectors that fulfill industry standards which have also greatly impacted the non-ionizing radiation EMF detection, measurement, and safety market outlook.

Market technical advancements are projected to lead to the launch of detectors that are smaller, lighter, and less expensive. As the Internet of Things (IoT) has grown in popularity, the increased connectivity of devices via the Internet has resulted in an increased need for radiation detection devices.

Advances in silicon fabrication technologies are boosting the non-ionizing radiation EMF detection, measurement, and safety market. The market stresses the use of reliable materials such as high-purity silicon in non-ionizing radiation/EMF detector devices, and thus the adoption of non-ionizing radiation EMF detection, measurement, and safety is on the rise.

Attributes Details
Non-ionizing Radiation EMF Detection, Measurement, and Safety Market CAGR (2022 to 2032) 3.6%
Non-ionizing Radiation EMF Detection, Measurement, and Safety Market Size (2022) US$ 66.3 Billion
Non-ionizing Radiation EMF Detection, Measurement, and Safety Market Size (2032) US$ 94.5 Billion

Don't pay for what you don't need

Customize your report by selecting specific countries or regions and save 30%!

How does COVID-19 influence the Non-ionizing Radiation EMF Detection, Measurement, and Safety Market?

Non-lethal attacks in warfare using non-ionizing and ionizing solutions to impair the nation's military's electromagnetic transmissions have increased significantly in recent years. Such attacks can put a country's security and finances in danger.

Cyber-attacks can also jeopardize vital data for a country's security. Countries might focus on providing their military forces with technology and systems for detecting and recognizing threats from intruding systems thanks to electronic support measures (ESM).

As a result, the global demand for non-ionizing radiation EMF detection, measurement, and safety is predicted to expand fast over the forecast period.

Amidst the pandemic, the increased usage of devices across various sectors, such as residential, medical and healthcare, manufacturing, laboratory and education, military and homeland security, and telecommunication, is fuelling the global non-ionizing radiation EMF detection, measurement, and safety market share for non-ionizing radiation/EMF detection, measurement, and safety.

What is Propelling the Non-ionizing Radiation EMF Detection, Measurement, and Safety Market?

During the forecast period, the global demand for non-ionizing radiation/EMF detection, measurement, and safety is predicted to develop due to the increased use of electronic gadgets and electrical devices.

As per the non-ionizing radiation EMF detection, measurement, and safety market analysis, in both the home and industrial sectors, the use of electronics and electrical gadgets has expanded dramatically. As a result, there has been an increase in non-ionizing radiation-related electromagnetic pollution.

The application of wireless technology in various sectors has increased dramatically around the world. In addition, demand for consumer devices such as tablets, smartphones, and laptops has skyrocketed. Rising public awareness of the health dangers associated with exposure to such radiation has resulted in a major increase in the use of radiation detection and measurement devices and solutions and also changed the non-ionizing radiation EMF detection, measurement, and safety market trends.

Over the forecast period, the global non-ionizing radiation/EMF detection, measurement, and safety market are predicted to develop due to increased usage of electronic support measures (ESM).

In the recent past, there has been considerable growth in non-lethal attacks in warfare using non-ionizing and ionizing solutions to damage the nation's military's electromagnetic transmissions. Such attacks can pose serious security and financial risks to a country.

Emerging trends in the non-ionizing radiation EMF detection, measurement, and safety market indicate that cyber-attacks can also compromise data that is essential to a country's security. Electronic support measures (ESM) allow countries to concentrate on equipping their military forces with technology and systems for detecting and recognizing threats from intruding systems.

Sudip Saha
Sudip Saha

Principal Consultant

Talk to Analyst

Find your sweet spots for generating winning opportunities in this market.

What Restraints the Non-ionizing Radiation EMF Detection, Measurement, and Safety Market?

During the forecast period, technological challenges are likely to stymie the expansion of the global demand for non-ionizing radiation EMF detection, measurement, and safety.

The government's strict regulatory restrictions on radiofrequency and other non-ionizing radiation exposure make it critical to manufacturing goods with sufficient sensitivity and accuracy criteria. Manufacturers in the industry must design items to accommodate new technologies and meet the needs of various end-users. As a result, these constraints are likely to stifle the non-ionizing radiation EMF detection, measurement, and safety market growth in the foreseeable future.

What are the Trends in the Non-ionizing Radiation EMF Detection, Measurement, and Safety Market?

As per the non-ionizing radiation EMF detection, measurement, and safety market future trends, the rising demand for mobile devices could provide significant growth potential. Radiation detection equipment comes in a variety of forms, including area monitoring devices, handheld devices, and personal monitoring devices.

Owing to their simplicity of use and handling, handheld devices have seen a larger demand than the other two types of gadgets. With continual advances in these gadgets, demand for handheld devices is likely to skyrocket in the near future, presenting a profitable potential for non-ionizing radiation EMF detection, measurement, and safety industry participants.

Increased usage of medical radiation detection and measurement could result in significant non-ionizing radiation EMF detection, measurement, and safety market opportunities.

One of the most common end-use sectors for non-ionizing radiation EMF detection, measurement, and safety in healthcare. The healthcare business has begun to include cutting-edge technology and novel ideas that are crucial in the development of cutting-edge equipment. Hyperthermia therapy, radiofrequency ablation (RFA), pulse oximetry, and the use of UV to correct dental misalignment and jaundice are all medical uses that use non-ionizing radiation.

Get the data you need at a Fraction of the cost

Personalize your report by choosing insights you need
and save 40%!

Comparative View of Adjacent Non-ionizing Radiation EMF Detection, Measurement, and Safety Market

Non-ionizing Radiation EMF Detection, Measurement, and Safety Market:

Attributes Non-ionizing Radiation EMF Detection, Measurement, and Safety Market
CAGR (2022 to 2032) 4.1%
Market Value (2026) US$ 73.8 Billion
Growth Factor Rising public awareness of the health concerns associated with exposure to these radiations has resulted in a significant increase in the use of products and solutions to detect and quantify radiations, which is projected to boost non-ionizing radiation EMF detection, measurement, and safety market share.
Opportunity Increased usage of medical radiation detection and measurement could result in significant non-ionizing radiation EMF detection, measurement, and safety market opportunities.
Key Trends Over the projected period, rising demand for highly advanced and automated technologies is expected to stifle growth in the global non-ionizing radiation/EMF detection, measurement, and safety market.

Healthcare Cybersecurity Market:

Attributes Healthcare Cybersecurity Market
CAGR (2022 to 2032) 17.7%
Market Value (2026) US$ 35.5 Billion
Growth Factor During the forecast period, rising per capita healthcare expenditure is expected to drive growth in the worldwide healthcare cybersecurity market.
Opportunity Because cyber-attacks are becoming increasingly complex and sophisticated around the world, the requirement for installing effective network security architecture is rapidly expanding.
Key Trends Major market players are concentrating on merger and acquisition activities in order to strengthen their market position and obtain a competitive advantage.

Optical Encoder Market:

Attributes Optical Encoder Market
CAGR (2022 to 2032) 8.7%
Market Value (2026) US$ 3983 Million
Growth Factor During the projected period, the worldwide optical encoder market is expected to rise due to the increasing adoption of advanced motion control systems.
Opportunity In hybrid absolute rotational encoders, signal-on-demand can present significant economic prospects. Absolute or incremental rotational encoders are being used in a large number of position encoding applications.
Key Trends Using optical encoders and advanced motion control systems is becoming more common, especially in areas like offshore equipment, construction, military and aerospace, and alternative energy systems.

Owing to the government's rigorous regulatory restrictions on radiofrequency and other non-ionizing radiation exposure, it's vital to manufacture goods that meet the necessary sensitivity and accuracy standards. In order to accommodate new technologies and suit the needs of varied end-users, industrial manufacturers must create things. As a result, non-ionizing radiation EMF detection, measurement, and safety market growth are likely to be stifled over the projection period.

Although present devices are adequate for detecting and measuring non-ionizing radiations, there is a strong demand for more advanced and automated technologies. Significant research and development are required for such technology.

Small and medium-sized enterprises cannot afford to engage heavily in research and development, which is expected to hamper the demand for non-ionizing radiation EMF detection, measurement, and safety in the global non-ionizing radiation EMF detection, measurement, and safety market over the forecast period.

What is the Segmentation Outlook of the Non-ionizing Radiation EMF Detection, Measurement, and Safety Market?

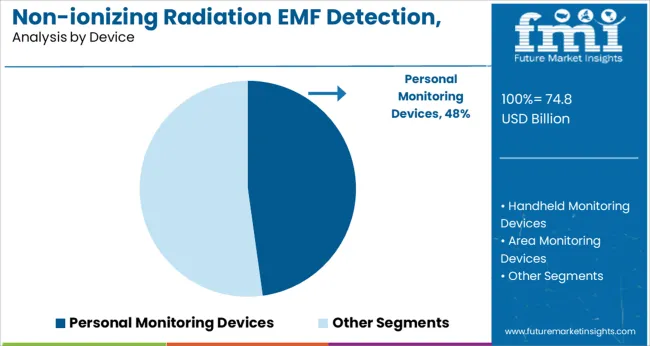
The non-ionizing radiation EMF detection, measurement, and safety market share are divided into three categories based on device type: personal monitoring devices, handheld monitoring devices, and area monitoring devices. In 2021, the handheld monitoring devices segment had the biggest market share, with 47 percent. Because of their ease of use, the demand for handheld devices has been higher than for other sorts of devices.

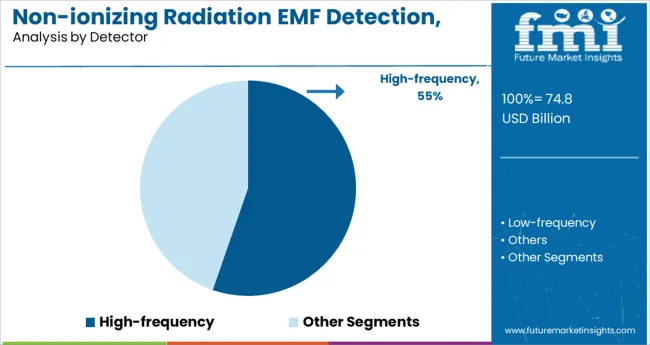
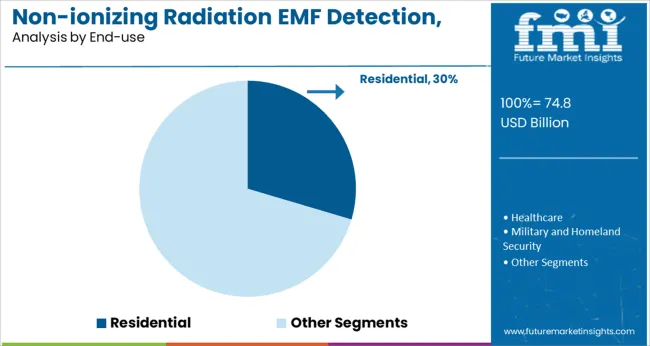
The demand for non-ionizing radiation EMF detection, measurement, and safety is divided into high-frequency and low-frequency segments based on detector type. Residential, healthcare, military and homeland security, manufacturing, laboratory and education, and telecommunication are the end-user segments of the non-ionizing radiation EMF detection, measurement, and safety market.

Which is the Leading Segment in the Non-ionizing Radiation EMF Detection, Measurement, and Safety Market by End User?

Military & Homeland Security leads the non-ionizing radiation EMF detection, measurement, and safety market share with a projected CAGR of 3.7% by 2032.

The non-ionizing radiation EMF detection, measurement, and safety industry are likely to develop as electronic support measures (ESM) become more widely used. Furthermore, attacks in warfare using non-ionizing methods have increased in order to disrupt the nation's military's electromagnetic broadcasts.

Such attacks can pose serious security and financial risks to a country. Electronic support measures (ESM) allow countries to concentrate on equipping their military forces with technology and systems for detecting and recognizing threats from intruding systems. This is impacting the non-ionizing radiation EMF detection, measurement, and safety market outlook.
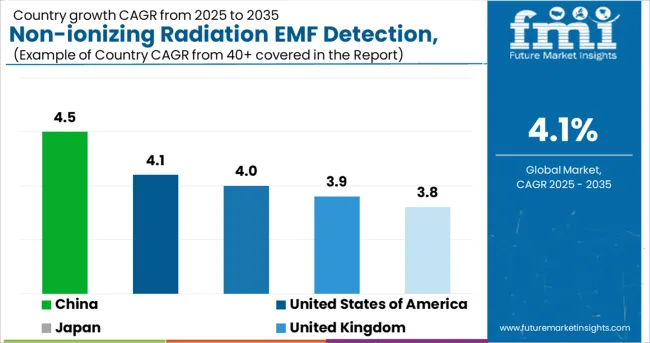
Which is the Leading Region in the Non-ionizing Radiation EMF Detection, Measurement, and Safety Market?

Regions CAGR (2022 to 2032)
United States of America 4.1%
United Kingdom 3.9%
China 4.5%
Japan 4%
India 3.8%

The non-ionizing radiation EMF detection, measurement, and safety market have been divided into North America, South America, the Middle East and Africa, Europe, and the Asia Pacific on a geographical basis. North America emerged as the top regional market for non-ionizing radiation EMF detection, measurement, and safety. A large number of non-ionizing radiation/EMF detector manufacturers is thought to be the main driver of this regional market's growth.

Owning to the technical improvements in this industry, analysts in non-ionizing radiation EMF detection, measurement, and safety market analysis estimate the North American non-ionizing radiation EMF detection, measurement, and safety market to maintain its lead over the next few years. Due to rising consumer awareness, Asia Pacific is expected to see an increase in demand for non-ionizing radiation EMF detection, measurement, and safety in the near future.

In the USA, the market for non-ionizing radiation EMF detection, measurement, and safety is expected to reach US$16.8 billion by 2020. China, the world's second-largest economy, is expected to reach a projected market size of US$13.7 billion by 2027, representing a 4.1 percent CAGR from 2020 to 2027.

Japan and Canada are two more important geographic markets, with forecasted growth rates of 4% and 3.7 percent, respectively, from 2020 to 2027. Germany's non-ionizing radiation EMF detection, measurement, and safety market are expected to expand at a CAGR of around 4.2 percent in Europe.
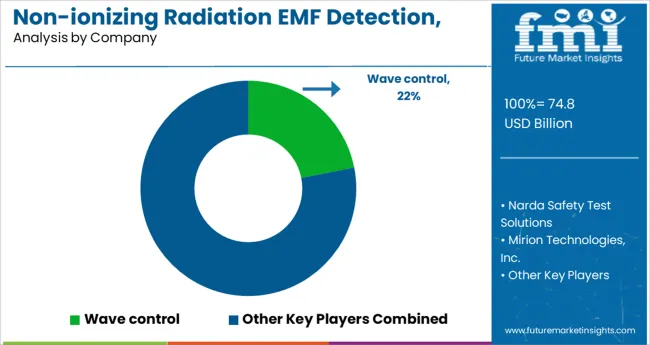
How does Competition Influence the Non-ionizing Radiation EMF Detection, Measurement, and Safety Market?

The emerging trends in the non-ionizing radiation EMF detection, measurement, and safety market estimate that because of the government's rigorous regulatory restrictions on radiofrequency and other non-ionizing radiation exposure, it's vital to manufacturing goods that meet the necessary sensitivity and accuracy standards.

In order to accommodate new technologies and suit the needs of varied end-users, non-ionizing radiation EMF detection, measurement, and safety manufacturers and key players are focusing on value creation. As a result, non-ionizing radiation EMF detection, measurement, and safety market growth are likely to be stifled over the projection period.

Although present devices are adequate for detecting and measuring non-ionizing radiations, there is a strong demand for more advanced and automated technologies. Significant research and development are required for such technology.

Small and medium-sized enterprises cannot afford to engage heavily in research and development, which will hamper growth in the global non-ionizing radiation EMF detection, measurement, and safety market over the forecast period.

Key players

  • LAURUS Systems Inc
  • Sper Scientific
  • Spectris Plc
  • TECPEL Co, Ltd
  • TES Electrical Electronic Corporation
  • General Tools & Instruments LLC
  • Brightsandz Pvt Ltd
  • Mirion Technologies Inc
  • Narda Safety Test Solutions
  • Wavecontrol

Key Segments

By Detector:

  • High Frequency
  • Low Frequency
  • Others

By Device:

  • Personal Monitoring Devices
  • Handheld Monitoring Devices
  • Area Monitoring Devices

End use:

  • Residential
  • Healthcare
  • Military and Homeland Security
  • Manufacturing
  • Laboratory and Education
  • Telecommunication
  • Others

By Region:

  • North America
  • Europe
  • Asia Pacific
  • Middle East and Africa
  • South America

Frequently Asked Questions

What is the CAGR of the Non-ionizing Radiation EMF Detection, Measurement, and Safety Market?

The non-ionizing radiation EMF detection, measurement, and safety market is projected to have a CAGR of 3.6% through 2032.

Which is the Leading Region in the Non-ionizing Radiation EMF Detection, Measurement, and Safety Market?

North America is the leading region, with an anticipated CAGR of 4.1% through 2032.

Which Segment Leads in the Non-ionizing Radiation EMF Detection, Measurement, and Safety Market by Device Type?

Handheld Monitoring devices lead the market with the projected CAGR of 4.5% through 2032.

What is the Growth Estimated for the Non-ionizing Radiation EMF Detection, Measurement, and Safety Market by 2032?

The non-ionizing radiation EMF detection, measurement, and safety market is predicted to grow to a market valuation of US$ 94.4 Billion by 2032.

Which Segment Leads in the Non-ionizing Radiation EMF Detection, Measurement, and Safety Market by End User?

Military & Homeland security leads the non-ionizing radiation EMF detection, measurement, and safety market with the projected CAGR of 3.7% through 2032.

Table of Content

1. Preface | Non-ionizing Radiation EMF Detection, Measurement, and Safety Market

    1.1. Market Definition and Scope

    1.2. Market Segmentation

    1.3. Key Research Objectives

    1.4. Research Highlights

2. Assumptions and Research Methodology

3. Executive Summary: Global Market

4. Global Market Overview

    4.1. Introduction

    4.2. Market Dynamics

        4.2.1. Drivers

        4.2.2. Restraints

        4.2.3. Opportunities

    4.3. Key Market Indicators

        4.3.1. Demand Analysis of Equipment

    4.4. Global Market Analysis and Forecasts, 2022 to 2032

        4.4.1. Market Revenue Projections (US$ Million)

        4.4.2. Market Volume Projections (Million Units)

    4.5. Value Chain Analysis

    4.6. Market Outlook

5. Global Market Analysis and Forecasts, by Detector

    5.1. Overview & Definitions

    5.2. Key Trends

    5.3. Market Size and Volume (US$ Million and Million Units) Forecast by Detector, 2022 to 2032

        5.3.1. High-frequency

        5.3.2. Low-frequency

        5.3.3. Others

    5.4. Detector Comparison Matrix

    5.5. Market Attractiveness by Detector

6. Global Market Analysis and Forecasts, by Device

    6.1. Overview & Definition

    6.2. Key Trends

    6.3. Market Size and Volume (US$ Million and Million Units) Forecast by Device, 2022 to 2032

        6.3.1. Personal Monitoring Devices

        6.3.2. Handheld Monitoring Devices

        6.3.3. Area Monitoring Devices

    6.4. Device Comparison Matrix

    6.5. Market Attractiveness by Device

7. Global Market Analysis and Forecasts, by End-use

    7.1. Overview & Definition

    7.2. Key Trends

    7.3. Market Size (US$ Million) Forecast by End-use, 2022 to 2032

        7.3.1. Residential

        7.3.2. Healthcare

        7.3.3. Military and Homeland Security

        7.3.4. Manufacturing

        7.3.5. Laboratory and Education

        7.3.6. Telecommunication

        7.3.7. Others

    7.4. End-use Comparison Matrix

    7.5. Market Attractiveness by End-use

8. Global Market Analysis and Forecasts, by Region

    8.1. Key Findings

    8.2. Policies and Regulations

    8.3. Market Size and Volume (US$ Million and Million Units) Forecast By Region, 2022 to 2032

        8.3.1. North America

        8.3.2. Europe

        8.3.3. Asia Pacific

        8.3.4. Middle East and Africa

        8.3.5. South America

    8.4. Market Attractiveness by Region

9. North America Market Analysis and Forecast

    9.1. Key Findings

    9.2. Key Trends

    9.3. Market Size and Volume (US$ Million and Million Units) Forecast by Detector, 2022 to 2032

        9.3.1. High-frequency

        9.3.2. Low-frequency

        9.3.3. Others

    9.4. Market Size and Volume (US$ Million and Million Units) Forecast by Device, 2022 to 2032

        9.4.1. Personal Monitoring Devices

        9.4.2. Handheld Monitoring Devices

        9.4.3. Area Monitoring Devices

    9.5. Market Size and Volume (US$ Million and Million Units) Forecast by End-use, 2022 to 2032

        9.5.1. Residential

        9.5.2. Healthcare

        9.5.3. Military and Homeland Security

        9.5.4. Manufacturing

        9.5.5. Laboratory and Education

        9.5.6. Telecommunication

        9.5.7. Others

    9.6. Market Size and Volume (US$ Million and Million Units) Forecast by Country, 2022 to 2032

        9.6.1. The USA

        9.6.2. Canada

        9.6.3. Rest of North America

    9.7. Market Attractiveness Analysis

        9.7.1. By Country

        9.7.2. By Detector

        9.7.3. By Device

        9.7.4. By End-use

10. Europe Market Analysis and Forecast

    10.1. Key Findings

    10.2. Key Trends

    10.3. Market Size and Volume (US$ Million and Million Units) Forecast by Detector, 2022 to 2032

        10.3.1. High-frequency

        10.3.2. Low-frequency

        10.3.3. Others

    10.4. Market Size and Volume (US$ Million and Million Units) Forecast by Device, 2022 to 2032

        10.4.1. Personal Monitoring Devices

        10.4.2. Handheld Monitoring Devices

        10.4.3. Area Monitoring Devices

    10.5. Market Size and Volume (US$ Million and Million Units) Forecast by End-use, 2022 to 2032

        10.5.1. Residential

        10.5.2. Healthcare

        10.5.3. Military and Homeland Security

        10.5.4. Manufacturing

        10.5.5. Laboratory and Education

        10.5.6. Telecommunication

        10.5.7. Others

    10.6. Market Size and Volume (US$ Million and Million Units) Forecast by Country, 2022 to 2032

        10.6.1. Germany

        10.6.2. France

        10.6.3. UK

        10.6.4. Italy

        10.6.5. Rest of Europe

    10.7. Market Attractiveness Analysis

        10.7.1. By Country

        10.7.2. By Detector

        10.7.3. By Device

        10.7.4. By End-use

11. Asia Pacific Market Analysis and Forecast

    11.1. Key Findings

    11.2. Key Trends

    11.3. Market Size and Volume (US$ Million and Million Units) Forecast by Detector, 2022 to 2032

        11.3.1. High-frequency

        11.3.2. Low-frequency

        11.3.3. Others

    11.4. Market Size and Volume (US$ Million and Million Units) Forecast by Device, 2022 to 2032

        11.4.1. Personal Monitoring Devices

        11.4.2. Handheld Monitoring Devices

        11.4.3. Area Monitoring Devices

    11.5. Market Size and Volume (US$ Million and Million Units) Forecast by End-use, 2022 to 2032

        11.5.1. Residential

        11.5.2. Healthcare

        11.5.3. Military and Homeland Security

        11.5.4. Manufacturing

        11.5.5. Laboratory and Education

        11.5.6. Telecommunication

        11.5.7. Others

    11.6. Market Size and Volume (US$ Million and Million Units) Forecast by Country, 2022 to 2032

        11.6.1. China

        11.6.2. Japan

        11.6.3. India

        11.6.4. Australia

        11.6.5. Rest of Asia Pacific

    11.7. Market Attractiveness Analysis

        11.7.1. By Country

        11.7.2. By Detector

        11.7.3. By Device

        11.7.4. By End-use

    11.8. India Market Analysis and Forecast

        11.8.1. Key Findings

        11.8.2. Market Size and Volume (US$ Million and Million Units) Forecast by Detector, 2022 to 2032

            11.8.2.1. High-frequency

            11.8.2.2. Low-frequency

            11.8.2.3. Others

        11.8.3. Market Size and Volume (US$ Million and Million Units) Forecast by Device, 2022 to 2032

            11.8.3.1. Personal Monitoring Devices

            11.8.3.2. Handheld Monitoring Devices

            11.8.3.3. Area Monitoring Devices

        11.8.4. Market Size and Volume (US$ Million and Million Units) Forecast by End-use, 2022 to 2032

            11.8.4.1. Residential

            11.8.4.2. Healthcare

            11.8.4.3. Military and Homeland Security

            11.8.4.4. Manufacturing

            11.8.4.5. Laboratory and Education

            11.8.4.6. Telecommunication

            11.8.4.7. Others

12. Middle East and Africa (MEA) Market Analysis and Forecast

    12.1. Key Findings

    12.2. Key Trends

    12.3. Market Size and Volume (US$ Million and Million Units) Forecast by Detector, 2022 to 2032

        12.3.1. High-frequency

        12.3.2. Low-frequency

        12.3.3. Others

    12.4. Market Size and Volume (US$ Million and Million Units) Forecast by Device, 2022 to 2032

        12.4.1. Personal Monitoring Devices

        12.4.2. Handheld Monitoring Devices

        12.4.3. Area Monitoring Devices

    12.5. Market Size and Volume (US$ Million and Million Units) Forecast by End-use, 2022 to 2032

        12.5.1. Residential

        12.5.2. Healthcare

        12.5.3. Military and Homeland Security

        12.5.4. Manufacturing

        12.5.5. Laboratory and Education

        12.5.6. Telecommunication

        12.5.7. Others

    12.6. Market Size and Volume (US$ Million and Million Units) Forecast by Country, 2022 to 2032

        12.6.1. UAE

        12.6.2. Saudi Arabia

        12.6.3. South Africa

        12.6.4. Rest of MEA

    12.7. Market Attractiveness Analysis

        12.7.1. By Country

        12.7.2. By Detector

        12.7.3. By Device

        12.7.4. By End-use

13. South America Market Analysis and Forecast

    13.1. Key Findings

    13.2. Key Trends

    13.3. Market Size and Volume (US$ Million and Million Units) Forecast by Detector, 2022 to 2032

        13.3.1. High-frequency

        13.3.2. Low-frequency

        13.3.3. Others

    13.4. Market Size and Volume (US$ Million and Million Units) Forecast by Device, 2022 to 2032

        13.4.1. Personal Monitoring Devices

        13.4.2. Handheld Monitoring Devices

        13.4.3. Area Monitoring Devices

    13.5. Market Size and Volume (US$ Million and Million Units) Forecast by End-use, 2022 to 2032

        13.5.1. Residential

        13.5.2. Healthcare

        13.5.3. Military and Homeland Security

        13.5.4. Manufacturing

        13.5.5. Laboratory and Education

        13.5.6. Telecommunication

        13.5.7. Others

    13.6. Market Size and Volume (US$ Million and Million Units) Forecast by Country, 2022 to 2032

        13.6.1. Brazil

        13.6.2. Rest of South America

    13.7. Market Attractiveness Analysis

        13.7.1. By Country

        13.7.2. By Detector

        13.7.3. By Device

        13.7.4. By End-use

14. Competition Landscape

    14.1. Market Player – Competition Matrix

    14.2. Market Positioning Analysis By Company (2021)

    14.3. Company Profiles

        14.3.1. Wave control

            14.3.1.1. Company details

            14.3.1.2. Company description

            14.3.1.3. Business Overview

            14.3.1.4. SWOT analysis

            14.3.1.5. Strategic Overview

        14.3.2. Narda Safety Test Solutions

            14.3.2.1. Company details

            14.3.2.2. Company description

            14.3.2.3. Business Overview

            14.3.2.4. SWOT analysis

            14.3.2.5. Financials

            14.3.2.6. Strategic Overview

        14.3.3. Mirion Technologies, Inc.

            14.3.3.1. Company details

            14.3.3.2. Company description

            14.3.3.3. Business Overview

            14.3.3.4. SWOT analysis

            14.3.3.5. Strategic Overview

        14.3.4. Brightsandz Pvt Ltd.

            14.3.4.1. Company details

            14.3.4.2. Company description

            14.3.4.3. Business Overview

        14.3.5. General Tools & Instruments LLC

            14.3.5.1. Company details

            14.3.5.2. Company description

            14.3.5.3. Business Overview

            14.3.5.4. SWOT analysis

            14.3.5.5. Strategic Overview

        14.3.6. TES Electrical Electronic Corp.

            14.3.6.1. Company details

            14.3.6.2. Company description

            14.3.6.3. Business Overview

            14.3.6.4. SWOT analysis

            14.3.6.5. Strategic Overview

        14.3.7. TECPEL Co., Ltd.

            14.3.7.1. Company details

            14.3.7.2. Company description

            14.3.7.3. Business Overview

            14.3.7.4. SWOT analysis

            14.3.7.5. Strategic Overview

        14.3.8. Spectris plc

            14.3.8.1. Company details

            14.3.8.2. Company description

            14.3.8.3. Business Overview

            14.3.8.4. SWOT analysis

            14.3.8.5. Financials

            14.3.8.6. Strategic overview

        14.3.9. Sper Scientific

            14.3.9.1. Company details

            14.3.9.2. Company description

            14.3.9.3. Business Overview

            14.3.9.4. SWOT analysis

            14.3.9.5. Strategic overview

        14.3.10. LAURUS Systems, Inc.

            14.3.10.1. Company details

            14.3.10.2. Company description

            14.3.10.3. Business Overview

            14.3.10.4. SWOT analysis

            14.3.10.5. Strategic overview

15. Key Takeaways

Don't pay for what you don't need

Customize your report by selecting specific countries or regions and save 30%!

List of Tables

Table 1: Global Market Size (US$ Million) Forecast by Detector, 2022 to 2032

Table 2: Global Market Volume (Million Units) Forecast by Detector, 2022 to 2032

Table 3: Global Market Size (US$ Million) Forecast by Device Type, 2022 to 2032

Table 4: Global Market Volume (Million Units) Forecast by Device Type, 2022 to 2032

Table 5: Global Market Size (US$ Million) Forecast by End-use, 2022 to 2032

Table 6: Global Market Volume (Million Units) Forecast by End-use, 2022 to 2032

Table 7: Global Market Size (US$ Million) Forecast by Region, 2022 to 2032

Table 8: Global Market Volume (Million Units) Forecast by Region, 2022 to 2032

Table 9: North America Market Size (US$ Million) Forecast by Detector, 2022 to 2032

Table 10: North America Market Volume (Million Units) Forecast by Detector, 2022 to 2032

Table 11: North America Market Size (US$ Million) Forecast by Device Type, 2022 to 2032

Table 12: North America Market Volume (Million Units) Forecast by Device Type, 2022 to 2032

Table 13: North America Market Size (US$ Million) Forecast by End-use, 2022 to 2032

Table 14: North America Market Volume (Million Units) Forecast by End-use, 2022 to 2032

Table 15: North America Market Size (US$ Million) Forecast by Country, 2022 to 2032

Table 16: North America Market Volume (Million Units) Forecast by Country, 2022 to 2032

Table 17: Europe Market Size (US$ Million) Forecast by Detector, 2022 to 2032

Table 18: Europe Market Volume (Million Units) Forecast by Detector, 2022 to 2032

Table 19: Europe Market Size (US$ Million) Forecast by Device Type, 2022 to 2032

Table 20: Europe Market Volume (Million Units) Forecast by Device Type, 2022 to 2032

Table 21: Europe Market Size (US$ Million) Forecast by End-use, 2022 to 2032

Table 22: Europe Market Volume (Million Units) Forecast by End-use, 2022 to 2032

Table 23: Europe Market Size (US$ Million) Forecast by Country, 2022 to 2032

Table 24: Europe Market Volume (Million Units) Forecast by Country, 2022 to 2032

Table 25: Asia Pacific Market Size (US$ Million) Forecast by Detector, 2022 to 2032

Table 26: Asia Pacific Market Volume (Million Units) Forecast by Detector, 2022 to 2032

Table 27: Asia Pacific Market Size (US$ Million) Forecast by Device Type, 2022 to 2032

Table 28: Asia Pacific Market Volume (Million Units) Forecast by Device Type, 2022 to 2032

Table 29: Asia Pacific Market Size (US$ Million) Forecast by End-use, 2022 to 2032

Table 30: Asia Pacific Market Volume (Million Units) Forecast by End-use, 2022 to 2032

Table 31: Asia Pacific Market Size (US$ Million) Forecast by Country, 2022 to 2032

Table 32: Asia Pacific Market Volume (Million Units) Forecast by Country, 2022 to 2032

Table 33: India Market Size (US$ Million) Forecast by Detector, 2022 to 2032

Table 34: India Market Volume (Million Units) Forecast by Detector, 2022 to 2032

Table 35: India Market Size (US$ Million) Forecast by Device Type, 2022 to 2032

Table 36: India Market Volume (Million Units) Forecast by Device Type, 2022 to 2032

Table 37: India Market Size (US$ Million) Forecast by End-use, 2022 to 2032

Table 38: India Market Volume (Million Units) Forecast by End-use, 2022 to 2032

Table 39: MEA Market Size (US$ Million) Forecast by Detector, 2022 to 2032

Table 40: MEA Market Volume (Million Units) Forecast by Detector, 2022 to 2032

Table 41: MEA Market Size (US$ Million) Forecast by Device Type, 2022 to 2032

Table 42: MEA Market Volume (Million Units) Forecast by Device Type, 2022 to 2032

Table 43: MEA Market Size (US$ Million) Forecast by End-use, 2022 to 2032

Table 44: MEA Market Volume (Million Units) Forecast by End-use, 2022 to 2032

Table 45: MEA Market Size (US$ Million) Forecast by Country, 2022 to 2032

Table 46: MEA Market Volume (Million Units) Forecast by Country, 2022 to 2032

Table 47: South America Market Size (US$ Million) Forecast by Detector, 2022 to 2032

Table 48: South America Market Volume (Million Units) Forecast by Detector, 2022 to 2032

Table 49: South America Market Size (US$ Million) Forecast by Device Type, 2022 to 2032

Table 50: South America Market Volume (Million Units) Forecast by Device Type, 2022 to 2032

Table 51: South America Market Size (US$ Million) Forecast by End-use, 2022 to 2032

Table 52: South America Market Volume (Million Units) Forecast by End-use, 2022 to 2032

Table 53: South America Market Size (US$ Million) Forecast by Country, 2022 to 2032
Sudip Saha
Sudip Saha

Principal Consultant

Talk to Analyst

Find your sweet spots for generating winning opportunities in this market.

List of Charts

Figure 1: Global Market Revenue Projections, 2022 to 2032 (US$ Million)

Figure 2: Global Market Volume Projections, 2022 to 2032 (Million Units)

Figure 3: Global Market Revenue Growth, By Detector (Y-o-Y)

Figure 4: Global Market Volume Growth, By Detector (Y-o-Y)

Figure 5: Global Market – Comparison Matrix, By Detector

Figure 6: Global Market Attractiveness Analysis, By Detector

Figure 7: Global Market Revenue Growth, By Device Type (Y-o-Y)

Figure 8: Global Market Volume Growth, By Device Type (Y-o-Y)

Figure 9: Global Market Comparison Matrix - By Device Type

Figure 10: Global Market Attractiveness Analysis, By Device Type

Figure 11: Global Market Revenue Growth, By End-use (Y-o-Y)

Figure 12: Global Market Volume Growth, By End-use (Y-o-Y)

Figure 13: Global Market - Comparison Matrix, By End-use

Figure 14: Global Market Attractiveness Analysis, By End-use

Figure 15: Global Market Revenue Growth, By Region, (Y-o-Y)

Figure 16: Global Market Volume Growth, By Region, (Y-o-Y)

Figure 17: Global Market Analysis, By Region

Figure 18: North America Market Revenue Growth, By Detector (Y-o-Y)

Figure 19: North America Market Volume Growth, By Detector (Y-o-Y)

Figure 20: North America Market Revenue Growth, By Device Type (Y-o-Y)

Figure 21: North America Market Volume Growth, By Device Type (Y-o-Y)

Figure 22: North America Market Revenue Growth, By End-use (Y-o-Y)

Figure 23: North America Market Volume Growth, By End-use (Y-o-Y)

Figure 24: North America Market Revenue Growth, By Country (Y-o-Y)

Figure 25: North America Market Volume Growth, By Country (Y-o-Y)

Figure 26: North America Market Attractiveness Analysis, By Detector

Figure 27: North America Market Attractiveness Analysis, By Device Type

Figure 28: North America Market Attractiveness Analysis, By End-use

Figure 29: North America Market Attractiveness Analysis, By Country

Figure 30: Europe Market Revenue Growth, By Detector (Y-o-Y)

Figure 31: Europe Market Volume Growth, By Detector (Y-o-Y)

Figure 32: Europe Market Revenue Growth, By Device Type (Y-o-Y)

Figure 33: Europe Market Volume Growth, By Device Type (Y-o-Y)

Figure 34: Europe Market Revenue Growth, By End-use (Y-o-Y)

Figure 35: Europe Market Volume Growth, By End-use (Y-o-Y)

Figure 36: Europe Market Revenue Growth, By Country (Y-o-Y)

Figure 37: Europe Market Volume Growth, By Country (Y-o-Y)

Figure 38: Europe Market Attractiveness Market Attractiveness Analysis, By Detector

Figure 39: Europe Market Attractiveness Market Attractiveness Analysis, By Device Type

Figure 40: Europe Market Attractiveness Market Attractiveness Analysis, By End-use

Figure 41: Europe Market Attractiveness Market Attractiveness Analysis, By Country

Figure 42: Asia Pacific Market Revenue Growth, By Detector (Y-o-Y)

Figure 43: Asia Pacific Market Volume Growth, By Detector (Y-o-Y)

Figure 44: Asia Pacific Market Revenue Growth, By Device Type (Y-o-Y)

Figure 45: Asia Pacific Market Volume Growth, By Device Type (Y-o-Y)

Figure 46: Asia Pacific Market Revenue Growth, By End-use (Y-o-Y)

Figure 47: Asia Pacific Market Volume Growth, By End-use (Y-o-Y)

Figure 48: Asia Pacific Market Revenue Growth, By Country (Y-o-Y)

Figure 49: Asia Pacific Market Volume Growth, By Country (Y-o-Y)

Figure 50: Asia Pacific Market Attractiveness Market Attractiveness Analysis, By Detector

Figure 51: Asia Pacific Market Attractiveness Market Attractiveness Analysis, By Device Type

Figure 52: Asia Pacific Market Attractiveness Market Attractiveness Analysis, By End-use

Figure 53: Asia Pacific Market Attractiveness Market Attractiveness Analysis, By Country

Figure 54: India Market Revenue Growth, By Detector (Y-o-Y)

Figure 55: India Market Volume Growth, By Detector (Y-o-Y)

Figure 56: India Market Revenue Growth, By Device Type (Y-o-Y)

Figure 57: India Market Volume Growth, By Device Type (Y-o-Y)

Figure 58: India Market Revenue Growth, By End-use (Y-o-Y)

Figure 59: India Market Volume Growth, By End-use (Y-o-Y)

Figure 60: MEA Market Revenue Growth, By Detector (Y-o-Y)

Figure 61: MEA Market Volume Growth, By Detector (Y-o-Y)

Figure 62: MEA Market Revenue Growth, By Device Type (Y-o-Y)

Figure 63: MEA Market Volume Growth, By Device Type (Y-o-Y)

Figure 64: MEA Market Revenue Growth, By End-use (Y-o-Y)

Figure 65: MEA Market Volume Growth, By End-use (Y-o-Y)

Figure 66: MEA Market Revenue Growth, By Country (Y-o-Y)

Figure 67: MEA Market Volume Growth, By Country (Y-o-Y)

Figure 68: Middle East and Africa Market Attractiveness Market Attractiveness Analysis, By Detector

Figure 69: Middle East and Africa Market Attractiveness Market Attractiveness Analysis, By Device Type

Figure 70: Middle East and Africa Market Attractiveness Market Attractiveness Analysis, By End-use

Figure 71: Middle East and Africa Market Attractiveness Market Attractiveness Analysis, By Country

Figure 72: South America Market Revenue Growth, By Detector (Y-o-Y)

Figure 73: South America Market Volume Growth, By Detector (Y-o-Y)

Figure 74: South America Market Revenue Growth, By Device Type (Y-o-Y)

Figure 75: South America Market Volume Growth, By Device Type (Y-o-Y)

Figure 76: South America Market Revenue Growth, By End-use (Y-o-Y)

Figure 77: South America Market Volume Growth, By End-use (Y-o-Y)

Figure 78: South America Market Revenue Growth, By Country (Y-o-Y)

Figure 79: South America Market Volume Growth, By Country (Y-o-Y)

Figure 80: South America Market Attractiveness Market Attractiveness Analysis, By Detector

Figure 81: South America Market Attractiveness Market Attractiveness Analysis, By Device Type

Figure 82: South America Market Attractiveness Market Attractiveness Analysis, By End-use

Figure 83: South America Market Attractiveness Market Attractiveness Analysis, By Country

Figure 84: Company Positioning

Recommendations

Technology

Survey and Feedback Management Software Market

Published : January 2022

Technology

Poland IT Software and Service Market

Published : January 2015

Technology

Russian IT Software and Services Market

Published : December 2014

Explore Technology Insights

View Reports

Non-ionizing Radiation EMF Detection, Measurement, and Safety Market