Radiation Toxicity Treatment Market
Market Insights on Radiation Toxicity Treatment covering sales outlook, demand forecast & up-to-date key trends
Radiation Toxicity Treatment Market by Product, Radiation Type, By Indication & Region | Forecast 2022 to 2029
Radiation Toxicity Treatment Market Outlook (2022 to 2029)
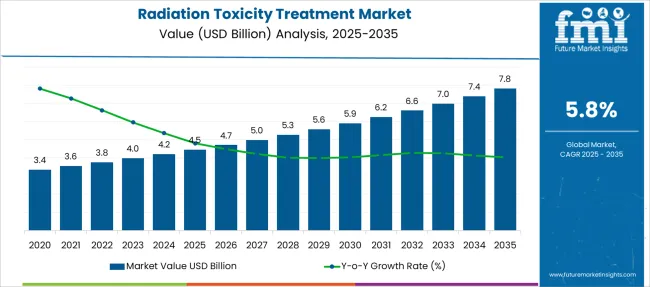
The global Radiation Toxicity Treatment Market was valued at US$ 3.55 Billion in 2021 and is expected to reach US$ 5.58 Billion by 2029, finds Future Market Insights (FMI) in a recent market survey.
Market Outlook:
Data Points |
Market Insights |
Market Value 2022 |
USD 3.76 Billion |
Market Value 2029 |
USD 5.58 Billion |
CAGR 2022 to 2029 |
5.8% |
Share of Top 5 Countries |
57.4% |
Key Players |
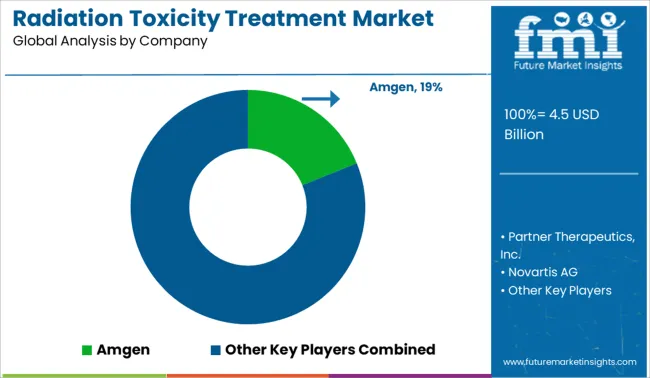
The key players in the radiation toxicity treatment market are Amgen, Jubilant Life Sciences, Siegfried Holdings, Heyl Chemisch-pharmazeutische Fabrik GmbH & Co. KG, Recipharm AB, Mission Pharmacal Company, Partner Therapeutics, Inc., Novartis AG, Mylan NV |
Cancer is one of the leading causes of death around the world. The global prevalence of cancer is continuously increasing, increasing the demand for radiotherapy as a therapeutic option. Being exposed to radiation during radiotherapy causes radiation toxicity.
As per the previous decade's trend, around 50% of patients with liver cancer, colon cancer, pancreatic cancer, and prostate cancer were treated with radiotherapy. Radiotherapy not only destroys tumor cells, but it also destroys normal and healthy cells in the proximity of the tumor. This is the primary cause of radiation toxicity in 60% of individuals who receive radiotherapy. As a result, with the rising prevalence of cancer, the number of cases of radiation toxicity is also increasing around the world.
Significant investments in nuclear energy in some countries have been increased in recent years, resulting in more nuclear facilities, which has raised the risk of individuals being exposed to radiation. The radiotherapy coverage policies and reimbursements provide easy access to radiotherapy treatments.
Increased usage of positron emission tomography (PET) and single photon emission computed tomography (SPECT) scanners in hospitals and diagnostic centers increases radiation toxicity due to gamma radiation emission, which provides a potential growth opportunity for the radiation toxicity market.
Don't pay for what you don't need
Customize your report by selecting specific countries or regions and save 30%!
How The Market Progressed Till June 2022?
Particulars |
Details |
H1, 2021 |
5.74% |
H1, 2022 Projected |
5.79% |
H1, 2022 Outlook |
5.69% |
BPS Change - H1, 2022 (O) – H1, 2022 (P) |
(-) 10 ↓ |
BPS Change – H1, 2022 (O) – H1, 2021 |
(-) 05 ↓ |
Regulatory compliances and clinical outcomes of treatment are dynamics that impact the market for radiation toxicity treatment. The market is subject to be influenced by macro, regulatory, and industrial factors. Developing radiation-drug combinations, and implementing non-ionic radiations for therapeutic use are key market developments.
According to FMI analysis, the radiation toxicity treatment market will show a decline in H1-2022 (O) growth rate as compared to H1-2021 by nearly 5 BPS. Additionally, a comparison of the growth rate for the projected H1-2022 and Outlook H1-2022 period also showed a dip of nearly 10 BPS.
Acute radiation damage, distal atrophy and necrosis, and radiation injury are factors that are leading toward a reduction in the BPS value for the radiation toxicity treatment market.
Development of treatment systems that use modulated beams of photons and protons to improve cancer outcomes by irradiating cancerous tissues in ways that lead to improved control of tumors and by reducing doses to healthy tissues to reduce treatment complications are two key factors that display a progressive approach towards growth for the overall radiation toxicity treatment market.
Conversely, other market segments are expected to perform objectively and achieve lucrative growth prospects in the next half of the projection period, owing to the clinical development of novel drug-radiotherapy.
2014 to 2021 Market Demand Outlook for Radiation Toxicity Treatment compared to 2022 to 2029 Forecast
Sales of the radiation toxicity treatment market grew at a CAGR of 4.9% between 2014 and 2021. In 2021, the global market of radiation toxicity treatment accounts for approx. 38% of the overall toxicology drug screening market which accounts for around US$ 9.4 Billion.
Radiation used in the treatment also damages the healthy cells present around cancer tumors in the human body, resulting in side effects such as dry mouth, mouth and gum sores, difficulty in swallowing, stiffness in the jaw, nausea, and others, after a duration ranging from days, months, to years.
For the prevention of damage to healthy cells, radiologists and dosimetrists are focusing on using software such as treatment planning software, radiation dose management, and others for providing the right amount of radiation doses to the patients at targeted locations, without harming the healthy cells around the tumor.
With technological evolution in the field of radiation, automation is successfully implemented in radiotherapy. Radiation therapy centers are increasingly using advanced software, such as treatment planning software, for developing a treatment plan for each beamline route for estimating the direction in which the therapy system will deliver radiotherapy to a patient hence, the demand for radiation toxicity treatment will increase and will drive the market.
The radiation toxicity treatment market is expected to grow in the future, as the healthcare profession continues to evolve as a result of the need to discover newer technologies to effectively diagnose any issue.
In addition, the market's growth is expected to be boosted by rising acceptance and quick expansion of new technologies in emerging economies throughout the forecast period. Leading companies are concentrating their efforts on the launch of new products as well as research and development.
Considering this, FMI expects the global radiation toxicity treatment to grow at a CAGR of 5.8% through 2029.
Find your sweet spots for generating winning opportunities in this market.
Talk to AnalystWhich Factors Are Restraining the Demand for radiation toxicity treatment?
Lack of guidance regarding rare diseases such as acute radiation syndrome-specific research methodologies and identifying patients for a study, especially including very impaired or minimally impaired patients in research remains a challenge.
There also exist various legal and ethical issues to finding an adequate sample size for clinical research. Selecting appropriate outcomes and their measurement is difficult due to heterogeneity in treatment and the effect of various diseases in patients due to the absence of validated outcomes. Also, a lack of disease knowledge and diversity in terms of epidemiology, diagnosis, prognosis, and treatment affects the clinical trial design and planning.
In cases of rare diseases such as acute radiation syndrome, the patient–physician relationship may not fit with the traditional assumptions of medical care. The lack of disease-related expertise among healthcare professionals and psychological challenges associated with the diagnosis of an incurable disease may lead to improper treatment. Due to poor knowledge of rare diseases and limited therapeutic options of treatments, physicians may not act as competent technical experts who provide relevant information to patients.
To avoid this, disease specialists should be trained to deal with patients with rare diseases and they must learn to cope with assertive and well-informed expert patients. Educational associations and institutions in healthcare should encourage physicians to practice and improve their skills in this area.
This can prove to be a major restraining factor for the product segment of the radiation toxicity treatment market.
Country-wise Insights
What Makes the USA the Largest Market for radiation toxicity treatment?
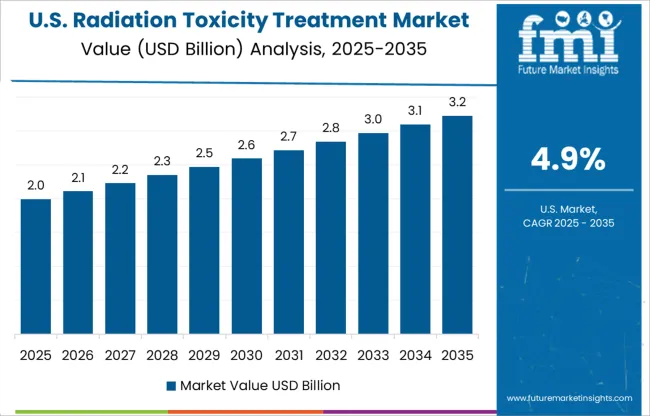
In 2021, the USA dominated the North American market, with more than 91% of the market share. The United States of America has the largest market for radiation toxicity treatment. The market is driven by factors such as rising cancer incidence and mortality, the replacement of older therapies with newer ones, and the provision of reimbursements for radiation toxicity therapy, the United States of America is expected to reflect similar market trends over the projection timeframe. Furthermore, in the United States of America, the implementation of safety rules and policies, improved treatment outcomes of radiation toxicity therapy, and significant investments by key manufacturers in product development and distribution are boosting the radiation toxicity treatment market growth.
Why is Germany Considered a More Lucrative Market for Radiation Toxicity Treatment in Europe?
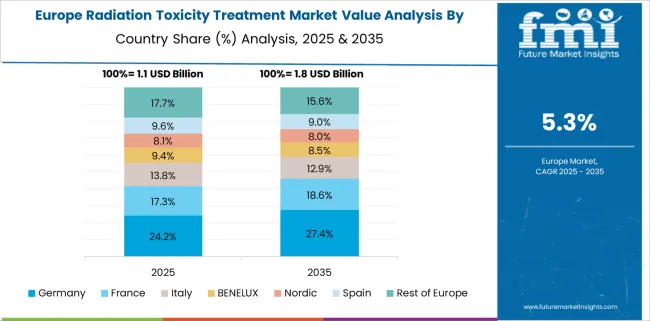
Germany dominated the European radiation toxicity treatment market and accounted for approx. 20.6% of the market share in 2021, owing to the increased use of PET and single-photon emission computed tomography scanning machines across various diagnostic centers. Furthermore, favorable health coverage policies and stringent regulations have boosted the market growth in the region.
While Europe is identified as a lucrative market, stakeholders are particularly eying the profits in East and South Asia. These regional markets are turning attractive with the increasing per capita healthcare expenditure and multiple government programs for integrated healthcare systems.
What are the Factors Fueling the Demand for Radiation Toxicity Treatment in China?
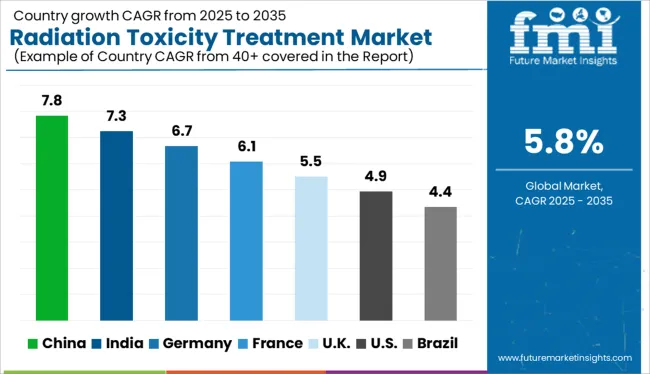
The radiation toxicity treatment market in China is projected to grow at a 10.4% CAGR in East Asia throughout the forecast period. Rising awareness about advanced radiation toxicity treatments, as well as improving healthcare infrastructure, are expected to fuel the growth of the China radiation toxicity treatment market throughout the forecast period. Furthermore, China's radiation toxicity treatment market is expected to rise at a faster rate by 2029 as a result of a strong focus on research and development in the region.
What Makes India an Emerging Market for Radiation Toxicity Treatment?
India is an emerging market for radiation toxicity treatment and accounts for the largest share of more than 48% of the South Asia radiation toxicity treatment market due to improving healthcare infrastructure, the large patient base for target diseases, and the growing presence of leading market players in the region to grab the advantage of the rising opportunities given in India. These are the main drivers of the radiation toxicity treatment market growth in this region.
Get the data you need at a Fraction of the cost
Personalize your report by choosing insights you need
and save 40%!
Category-wise Insights
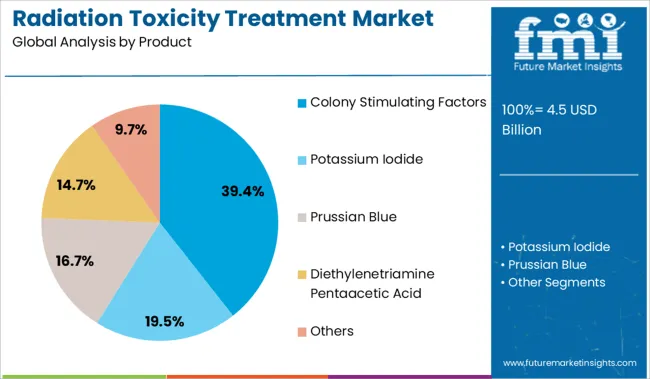
Why do Colony Stimulating Factors account for the highest share by Product?
Colony-stimulating factors are the leading segment and are expected to gain more than 78% of revenue share in 2021 owing to the increasing adoption of colony-stimulating factors (CSFs).
The management of febrile neutropenia in cancer patients has become increasingly important as chemotherapy doses have been increased and the variety of available treatment lines has grown. Colony-stimulating factors (CSFs) are growth hormones that prevent chemotherapy-induced neutropenia.
They include granulocyte-colony stimulating factors (G-CSF) and granulocyte macrophage-colony stimulating factors (GM-CSF). They are utilized in frail patients undergoing chemotherapy and patients undergoing highly haematotoxic programs.
Why does Acute Radiation Syndrome Contribute to the Highest Market Share by Indication?
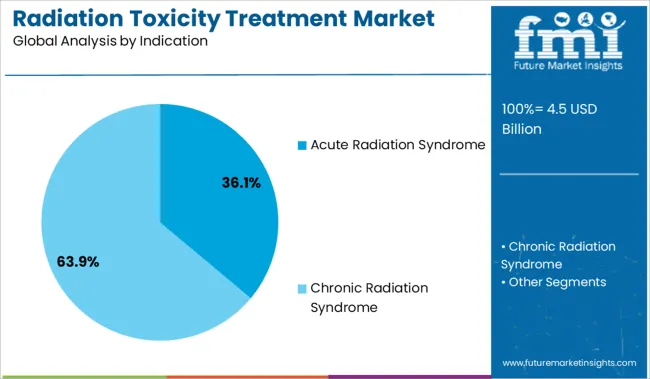
Acute radiation syndrome is caused by irradiation of the entire body by a high dose of penetrating radiation in a very short period of time. The acute radiation syndrome segment by indication is projected to account for 87.8% of the total market share in 2021 as acute radiation syndrome is highly progressive by nature and can affect patients in less than 24 hours of exposure to radiation.
Why does Ionizing Radiation Contribute to the highest market share by Type of Radiation?
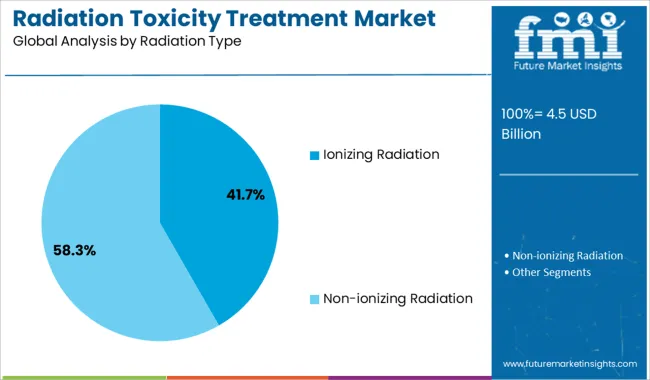
Representing a whopping 89.6% share of the global market in 2021, ionizing radiation remains the highly preferred radiation toxicity treatment, particularly in developed countries. On the other side, it also continues to witness growing traction within developing regional markets. Under ionizing radiation, the gamma radiation method accounts for over 55.8% share, while alpha and beta radiation methods are observing significant adoption.
Which End User will be Most Preferred?
The hospital segment accounts for the highest share of over 88% in 2021 by the end user due to increasing adoption and increasing footfalls to seek effective radiation toxicity treatment at hospitals, availability of advanced devices, and the presence of qualified medical personnel in the hospital.
Competitive Landscape
The global radiation toxicity treatment market is highly consolidated. Leading players in the radiation toxicity treatment market are also emphasizing collaboration with distributors or local manufacturers to enhance their distribution channels in emerging economies.
For instance, In September 2020, the AI-Rad Companion Organs RT, the latest AI-Rad Companion artificial intelligence-based software assistant from Siemens Healthineers, received FDA approval. As part of the radiation therapy planning workflow, AI-Rad Companion Organs RT uses deep-learning AI algorithms to autonomously outline organs at risk (OARs) on computed tomography (CT) images, facilitating precision medicine.
In May 2018, Partner Therapeutics signed a distribution agreement with Tanner Pharma Group for the distribution of Leukine in areas outside the USA and Canada.
In January 2017, Jubilant Life Sciences Limited signed a long-term contract with distribution networks in the USA for the supply of products used for diagnostic and therapeutic products with Montreal Canada (JDI).
Scope of the Report
Attribute |
Details |
Forecast Period |
2022 to 2029 |
Historical Data Available for |
2014 to 2021 |
Market Analysis |
USD Million for Value |
Key Regions Covered |
North America, Latin America, Europe, South Asia and Pacific, East Asia, and Middle East & Africa |
Key Countries Covered |
USA, Canada, Brazil, Mexico, Argentina, Germany, United Kingdom, France, Italy, Spain, Benelux, Russia, China, Japan, South Korea, India, Thailand, Indonesia, Malaysia, Thailand, Indonesia, Australia and New Zealand, Egypt, Turkey, South Africa, North Africa, and GCC Countries |
Key Segments Covered |
Product, Indication, End User, Radiation and Region |
Key Companies Profiled |
|
Report Coverage |
Market Forecast, Competition Intelligence, Drivers, Restraints, Opportunities and Threats Analysis, Market Dynamics and Challenges, Strategic Growth Initiatives |
Customization & Pricing |
Available upon Request |
Radiation toxicity treatment Market by Category
By Product:
- Colony Stimulating Factors
- Potassium Iodide
- Prussian Blue
- Diethylenetriamine Pentaacetic Acid
- Others
By Indication:
- Acute Radiation Syndrome
- Bone Marrow Syndrome (Hematopoietic)
- Gastrointestinal Syndrome (GI)
- Cardiovascular (CV)
- Chronic Radiation Syndrome
By Radiation Type:
- Ionizing Radiation
- Alpha Radiation
- Beta Radiation
- Gamma Radiation
- Non-ionizing Radiation
By End-User:
- Hospitals
- Government Hospitals
- Private Hospitals
- Research & Academic Institutes
- Government Research and Academic Institutes
- Private Research and Academic Institutes
By Region:
- North America
- Latin America
- Europe
- East Asia
- South Asia
- Oceania
- Middle East and Africa (MEA)
Frequently Asked Questions
How much is the radiation toxicity treatment Market currently worth?
The global radiation toxicity treatment market is worth US$ 3.55 Billion in 2021 and is set to expand 1.5X over the next 7 years.
What is the sales forecast for radiation toxicity treatment through 2029?
The radiation toxicity treatment market is expected to reach US$ 5.58 Billion by the end of 2029, with sales revenue expected to grow at a 5.8% CAGR.
What are the factors driving the demand outlook of the global radiation toxicity treatment?
An increasing number of PET and SPECT scanners, continuous drug approvals for radiation toxicity treatment, and the increasing burden of cancer worldwide are the factors driving the demand outlook of the global radiation toxicity market.
Which is the largest market for radiation toxicity treatment?
North America currently holds the largest market share of 38.0% in 2021 in the radiation toxicity treatment market globally.
What are the top 5 countries driving demand for radiation toxicity treatment?
The USA, Japan, China, Germany, and India are the top 5 countries that are driving the demand for the radiation toxicity treatment market.
Which are the leading companies in radiation toxicity treatment market?
Amgen, Partner Therapeutics, Inc., Novartis AG, Mylan NV, Coherus BioSciences Inc, Jubilant Life Sciences, Siegfried Holdings, Heyl Chemisch-pharmazeutische Fabrik GmbH & Co. KG, Recipharm AB and Mission Pharmacal Company are the leading players in the market.
What are the key market statistics in Japan?
Japan’s market is expected to exhibit healthy growth of 6.9% CAGR during the forecast period.
At what percentage radiation toxicity treatment market is expected to register growth in Europe?
The demand for radiation toxicity treatment is expected to register a growth rate of 4.7% during the forecast period in the European market.
Table of Content
1. Executive Summary | Radiation Toxicity Treatment Market 1.1. Global Market Outlook 1.2. Supply-side Trends 1.3. Demand-side Trends 1.4. Analysis and Recommendations 2. Market Overview 2.1. Market Coverage / Taxonomy 2.2. Market Definition / Scope / Limitations 3. Market Dynamics 3.1. Macro-Economic Factors 3.2. Drivers 3.2.1. Supply Side Drivers 3.2.2. Demand Side Drivers 3.3. Restraints 3.4. Opportunities 4. Key Inclusion 4.1. FDA-Approved Drugs 4.2. Pipeline Assessment 4.3. Therapeutic Efficacy and Treatment Metrics 4.4. Predisposing Factors 5. Global Market Value Analysis 2014 to 2021 and Forecast, 2022 to 2029 5.1. Historical Market Value (US$ Million) Analysis, 2014 to 2021 5.2. Current and Future Market Value (US$ Million) Projections, 2022 to 2029 5.2.1. Y-o-Y Growth Trend Analysis 5.2.2. Absolute $ Opportunity Analysis 6. Global Market Analysis 2014 to 2021 and Forecast 2022 to 2029, by Product 6.1. Introduction / Key Findings 6.2. Historical Market Size (US$ Million) Analysis by Product, 2014 to 2021 6.3. Current and Future Market Size (US$ Million) Analysis and Forecast by Product, 2022 to 2029 6.3.1. Colony Stimulating Factors 6.3.2. Prussian Blue 6.3.3. Diethylenetriamine Pentaacetic Acid 6.3.4. Potassium Iodide 6.3.5. Others 6.4. Market Attractiveness Analysis by Product 7. Global Market Analysis 2014 to 2021 and Forecast 2022 to 2029, by Indication 7.1. Introduction / Key Findings 7.2. Historical Market Size (US$ Million) Analysis by Indication, 2014 to 2021 7.3. Current and Future Market Size (US$ Million) Analysis and Forecast by Indication, 2022 to 2029 7.3.1. Acute Radiation Syndrome (ARS) 7.3.1.1. Bone Marrow Syndrome (Hematopoietic) 7.3.1.2. Gastrointestinal Syndrome (GI) 7.3.1.3. Cardiovascular (CV) 7.3.1.4. Central Nervous System (CNS) Syndrome 7.3.2. Chronic Radiation Syndrome 7.4. Market Attractiveness Analysis by Indication 8. Global Market Analysis 2014 to 2021 and Forecast 2022 to 2029, by Radiation 8.1. Introduction / Key Findings 8.2. Historical Market Size (US$ Million) Analysis by Radiation, 2014 to 2021 8.3. Current and Future Market Size (US$ Million) Analysis and Forecast by Radiation, 2022 to 2029 8.3.1. Acute Radiation Syndrome (ARS) 8.3.1.1. Bone Marrow Syndrome (Hematopoietic) 8.3.1.2. Gastrointestinal Syndrome (GI) 8.3.1.3. Cardiovascular (CV) 8.3.1.4. Central Nervous System (CNS) Syndrome 8.3.2. Chronic Radiation Syndrome 8.4. Market Attractiveness Analysis by Radiation 9. Global Market Analysis 2014 to 2021 and Forecast 2022 to 2029, by End User 9.1. Introduction / Key Findings 9.2. Historical Market Size (US$ Million) Analysis by End User, 2014 to 2021 9.3. Current and Future Market Size (US$ Million) Analysis and Forecast by End User, 2022 to 2029 9.3.1. Hospitals 9.3.1.1. Government Hospitals 9.3.1.2. Private Hospitals 9.3.2. Research & Academic Institutes 9.3.2.1. Government Research and Academic Institutes 9.3.2.2. Private Research and Academic Institutes 9.4. Market Attractiveness Analysis by End User 10. Global Market Analysis 2014 to 2021 and Forecast 2022 to 2029, by Region 10.1. Introduction 10.2. Historical Market Size (US$ Million) Analysis by Region, 2014 to 2021 10.3. Current Market Size (US$ Million) Analysis and Forecast by Region, 2022 to 2029 10.3.1. North America 10.3.2. Latin America 10.3.3. Europe 10.3.4. East Asia 10.3.5. South Asia 10.3.6. Oceania 10.3.7. Middle East & Africa 10.4. Market Attractiveness Analysis by Region 11. North America Market Analysis 2014 to 2021 and Forecast 2022 to 2029 11.1. Introduction 11.2. Historical Market Size (US$ Million) Trend Analysis by Market Taxonomy, 2014 to 2021 11.3. Market Size (US$ Million) Forecast By Market Taxonomy, 2022 to 2029 11.3.1. By Country 11.3.1.1. USA 11.3.1.2. Canada 11.3.2. By Product 11.3.3. By Indication 11.3.4. By Radiation 11.3.5. By End User 11.4. Market Attractiveness Analysis 11.5. Drivers and Restraints - Impact Analysis 12. Latin America Market Analysis 2014 to 2021 and Forecast 2022 to 2029 12.1. Introduction 12.2. Historical Market Size (US$ Million) Trend Analysis by Market Taxonomy, 2014 to 2021 12.3. Market Size (US$ Million) Forecast By Market Taxonomy, 2022 to 2029 12.3.1. By Country 12.3.1.1. Brazil 12.3.1.2. Mexico 12.3.1.3. Argentina 12.3.1.4. Rest of Latin America 12.3.2. By Product 12.3.3. By Indication 12.3.4. By End User 12.4. Market Attractiveness Analysis 12.5. Drivers and Restraints - Impact Analysis 13. Europe Market Analysis 2014 to 2021 and Forecast 2022 to 2029 13.1. Introduction 13.2. Historical Market Size (US$ Million) Trend Analysis by Market Taxonomy, 2014 to 2021 13.3. Market Size (US$ Million) Forecast By Market Taxonomy, 2022 to 2029 13.3.1. By Country 13.3.1.1. Germany 13.3.1.2. United Kingdom 13.3.1.3. France 13.3.1.4. Italy 13.3.1.5. Spain 13.3.1.6. Rest of Europe 13.3.2. By Product 13.3.3. By Indication 13.3.4. By Radiation 13.3.5. By End User 13.4. Market Attractiveness Analysis 13.5. Drivers and Restraints - Impact Analysis 14. East Asia Market Analysis 2014 to 2021 and Forecast 2022 to 2029 14.1. Introduction 14.2. Historical Market Size (US$ Million) Trend Analysis by Market Taxonomy, 2014 to 2021 14.3. Market Size (US$ Million) Forecast By Market Taxonomy, 2022 to 2029 14.3.1. By Country 14.3.1.1. China 14.3.1.2. Japan 14.3.1.3. South Korea 14.3.2. By Product 14.3.3. By Indication 14.3.4. By Radiation 14.3.5. By End User 14.4. Market Attractiveness Analysis 14.5. Drivers and Restraints - Impact Analysis 15. South Asia Market Analysis 2014 to 2021 and Forecast 2022 to 2029 15.1. Introduction 15.2. Historical Market Size (US$ Million) Trend Analysis by Market Taxonomy, 2014 to 2021 15.3. Market Size (US$ Million) Forecast By Market Taxonomy, 2022 to 2029 15.3.1. By Country 15.3.1.1. India 15.3.1.2. Indonesia 15.3.1.3. Thailand 15.3.1.4. Malaysia 15.3.1.5. Rest of South Asia 15.3.2. By Product 15.3.3. By Indication 15.3.4. By Radiation 15.3.5. By End User 15.4. Market Attractiveness Analysis 15.5. Drivers and Restraints - Impact Analysis 16. Oceania Market Analysis 2014 to 2021 and Forecast 2022 to 2029 16.1. Introduction 16.2. Historical Market Size (US$ Million) Trend Analysis by Market Taxonomy, 2014 to 2021 16.3. Market Size (US$ Million) Forecast By Market Taxonomy, 2022 to 2029 16.3.1. By Country 16.3.1.1. Australia 16.3.1.2. New Zealand 16.3.2. By Product 16.3.3. By Indication 16.3.4. By Radiation 16.3.5. By End User 16.4. Market Attractiveness Analysis 16.5. Drivers and Restraints - Impact Analysis 17. Middle East and Africa Market Analysis 2014 to 2021 and Forecast 2022 to 2029 17.1. Introduction 17.2. Historical Market Size (US$ Million) Trend Analysis by Market Taxonomy, 2014 to 2021 17.3. Market Size (US$ Million) Forecast By Market Taxonomy, 2022 to 2029 17.3.1. By Country 17.3.1.1. GCC Countries 17.3.1.2. South Africa 17.3.1.3. Turkey 17.3.1.4. Rest of Middle East and Africa(MEA) 17.3.2. By Product 17.3.3. By Indication 17.3.4. By Radiation 17.3.5. By End User 17.4. Market Attractiveness Analysis 17.5. Drivers and Restraints - Impact Analysis 18. Market Structure Analysis 18.1. Tier Structure Analysis 18.2. Market Concentration 18.3. Company Share Analysis 18.4. Company Footprint Analysis 19. Competition Analysis 19.1. Competition Dashboard 19.2. Competition Deep Dive 19.2.1. Amgen 19.2.1.1. Company Overview 19.2.1.2. Analyst Commentary 19.2.1.3. Product Overview 19.2.1.4. Financial Analysis 19.2.1.5. Key Developments 19.2.1.6. Strategy Overview 19.2.2. Partner Therapeutics, Inc. 19.2.2.1. Company Overview 19.2.2.2. Analyst Commentary 19.2.2.3. Product Overview 19.2.2.4. Financial Analysis 19.2.2.5. Key Developments 19.2.2.6. Strategy Overview 19.2.3. Novartis AG 19.2.3.1. Company Overview 19.2.3.2. Analyst Commentary 19.2.3.3. Product Overview 19.2.3.4. Financial Analysis 19.2.3.5. Key Developments 19.2.3.6. Strategy Overview 19.2.4. Mylan NV 19.2.4.1. Company Overview 19.2.4.2. Analyst Commentary 19.2.4.3. Product Overview 19.2.4.4. Financial Analysis 19.2.4.5. Key Developments 19.2.4.6. Strategy Overview 19.2.5. Coherus BioSciences Inc 19.2.5.1. Company Overview 19.2.5.2. Analyst Commentary 19.2.5.3. Product Overview 19.2.5.4. Financial Analysis 19.2.5.5. Key Developments 19.2.5.6. Strategy Overview 19.2.6. Jubilant Life Sciences 19.2.6.1. Company Overview 19.2.6.2. Analyst Commentary 19.2.6.3. Product Overview 19.2.6.4. Financial Analysis 19.2.6.5. Key Developments 19.2.6.6. Strategy Overview 19.2.7. Siegfried Holdings 19.2.7.1. Company Overview 19.2.7.2. Analyst Commentary 19.2.7.3. Product Overview 19.2.7.4. Financial Analysis 19.2.7.5. Key Developments 19.2.7.6. Strategy Overview 19.2.8. Heyl Chemisch-pharmazeutische Fabrik GmbH & Co. KG 19.2.8.1. Company Overview 19.2.8.2. Analyst Commentary 19.2.8.3. Product Overview 19.2.8.4. Financial Analysis 19.2.8.5. Key Developments 19.2.8.6. Strategy Overview 19.2.9. Recipharm AB 19.2.9.1. Company Overview 19.2.9.2. Analyst Commentary 19.2.9.3. Product Overview 19.2.9.4. Financial Analysis 19.2.9.5. Key Developments 19.2.9.6. Strategy Overview 19.2.10. Mission Pharmacal Company 19.2.10.1. Company Overview 19.2.10.2. Analyst Commentary 19.2.10.3. Product Overview 19.2.10.4. Financial Analysis 19.2.10.5. Key Developments 19.2.10.6. Strategy Overview 20. Assumptions and Acronyms Used 21. Research Methodology
Don't pay for what you don't need
Customize your report by selecting specific countries or regions and save 30%!
List of Tables
Table 01: List of FDA-Approved Drugs Table 02: Pipeline Assessment for Drugs (1/2) Table 03: Pipeline Assessment for Drugs (2/2) Table 04: Acute Radiation Syndrome: A Fact Sheet Table 05: Intrinsic Predisposing Factors Table 06: Extrinsic Predisposing Factors Table 07: Global Market Value (US$ Million) Analysis and Opportunity Assessment 2014 to 2029, By Product Table 08: Global Market Value (US$ Million) Analysis and Opportunity Assessment 2014 to 2029, By Indication Table 09: Global Market Value (US$ Million) Analysis and Opportunity Assessment 2014 to 2029, By Radiation Table 10: Global Market Value (US$ Million) Analysis and Opportunity Assessment 2014 to 2029, By End User Table 11: Global Market Value (US$ Million) Analysis and Opportunity Assessment 2014 to 2029, By Country Table 12: North America Market Value (US$ Million) Analysis 2014 to 2021 and Forecast 2022 to 2029, By Country Table 13: North America Market Value (US$ Million) Analysis 2014 to 2021 and Forecast 2022 to 2029, By Product Table 14: North America Market Value (US$ Million) Analysis 2014 to 2021 and Forecast 2022 to 2029, By Indication Table 15: North America Market Value (US$ Million) Analysis 2014 to 2021 and Forecast 2022 to 2029, By Radiation Table 16: North America Market Value (US$ Million) Analysis 2014 to 2021 and Forecast 2022 to 2029, By End User Table 17: Latin America Market Value (US$ Million) Analysis 2014 to 2021 and Forecast 2022 to 2029, By Country Table 18: Latin America Market Value (US$ Million) Analysis 2014 to 2021 and Forecast 2022 to 2029, By Product Table 19: Latin America Market Value (US$ Million) Analysis 2014 to 2021 and Forecast 2022 to 2029, By Indication Table 20: Latin America Market Value (US$ Million) Analysis 2014 to 2021 and Forecast 2022 to 2029, By Radiation Table 21: Latin America Market Value (US$ Million) Analysis 2014 to 2021 and Forecast 2022 to 2029, By End User Table 21: East Asia Market Value (US$ Million) Analysis 2014 to 2021 and Forecast 2022 to 2029, By End User Table 22: Europe Market Value (US$ Million) Analysis 2014 to 2021 and Forecast 2022 to 2029, By Country Table 23: Europe Market Value (US$ Million) Analysis 2014 to 2021 and Forecast 2022 to 2029, By Product Table 24: Europe Market Value (US$ Million) Analysis 2014 to 2021 and Forecast 2022 to 2029, By Indication Table 25: Europe Market Value (US$ Million) Analysis 2014 to 2021 and Forecast 2022 to 2029, By Radiation Table 26: Europe Market Value (US$ Million) Analysis 2014 to 2021 and Forecast 2022 to 2029, By End User Table 27: East Asia Market Value (US$ Million) Analysis 2014 to 2021 and Forecast 2022 to 2029, By Country Table 28: East Asia Market Value (US$ Million) Analysis 2014 to 2021 and Forecast 2022 to 2029, By Product Table 29: East Asia Market Value (US$ Million) Analysis 2014 to 2021 and Forecast 2022 to 2029, By Indication Table 30: East Asia Market Value (US$ Million) Analysis 2014 to 2021 and Forecast 2022 to 2029, By Radiation Table 32: South Asia Market Value (US$ Million) Analysis 2014 to 2021 and Forecast 2022 to 2029, By Country Table 33: South Asia Market Value (US$ Million) Analysis 2014 to 2021 and Forecast 2022 to 2029, By Product Table 34: South Asia Market Value (US$ Million) Analysis 2014 to 2021 and Forecast 2022 to 2029, By Indication Table 35: South Asia Market Value (US$ Million) Analysis 2014 to 2021 and Forecast 2022 to 2029, By Radiation Table 36: South Asia Market Value (US$ Million) Analysis 2014 to 2021 and Forecast 2022 to 2029, By End User Table 37: Oceania Market Value (US$ Million) Analysis 2014 to 2021 and Forecast 2022 to 2029, By Country Table 38: Oceania Market Value (US$ Million) Analysis 2014 to 2021 and Forecast 2022 to 2029, By Product Table 39: Oceania Market Value (US$ Million) Analysis 2014 to 2021 and Forecast 2022 to 2029, By Indication Table 40: Oceania Market Value (US$ Million) Analysis 2014 to 2021 and Forecast 2022 to 2029, By Radiation Table 41: Oceania Market Value (US$ Million) Analysis 2014 to 2021 and Forecast 2022 to 2029, By End User Table 42: MEA Market Value (US$ Million) Analysis 2014 to 2021 and Forecast 2022 to 2029, By Country Table 43: MEA Market Value (US$ Million) Analysis 2014 to 2021 and Forecast 2022 to 2029, By Product Table 44: MEA Market Value (US$ Million) Analysis 2014 to 2021 and Forecast 2022 to 2029, By Indication Table 45: MEA Market Value (US$ Million) Analysis 2014 to 2021 and Forecast 2022 to 2029, By Radiation Table 46: MEA Market Value (US$ Million) Analysis 2014 to 2021 and Forecast 2022 to 2029, By End User
Find your sweet spots for generating winning opportunities in this market.
Talk to AnalystList of Charts
Figure 01: Market, Pipeline Analysis by Phase Figure 02: Market, Pipeline Analysis by Status Figure 03: Market, Pipeline Analysis by Funding Type Figure 04: Market, Pipeline Analysis by Region Figure 05: Global Market Value Analysis (US$ Million), 2014 to 2021 Figure 06: Global Market Value Forecast (US$ Million), 2022 to 2029 Figure 07: Global Market Absolute $ Opportunity, 2022 to 2029 Figure 08: Global Market Share Analysis (%), By Product, 2022 & 2029 Figure 09: Global Market Y-o-Y Analysis (%), By Product, 2022 to 2029 Figure 10: Global Market Attractiveness Analysis by Product, 2022 to 2029 Figure 11: Global Market Share Analysis (%), By Indication, 2022 & 2029 Figure 12: Global Market Y-o-Y Analysis (%), By Indication, 2022 to 2029 Figure 13: Global Market Attractiveness Analysis by Indication, 2022 to 2029 Figure 14: Global Market Share Analysis (%), By Radiation, 2022 & 2029 Figure 15: Global Market Y-o-Y Analysis (%), By Radiation, 2022 to 2029 Figure 16: Global Market Attractiveness Analysis by Radiation, 2022 to 2029 Figure 17: Global Market Share Analysis (%), By End User, 2022 & 2029 Figure 18: Global Market Y-o-Y Analysis (%), By End User, 2022 to 2029 Figure 19: Global Market Attractiveness Analysis by End User, 2022 to 2029 Figure 20: Global Market Share Analysis (%), By Region, 2022 & 2029 Figure 21: Global Market Y-o-Y Analysis (%), By Country, 2022 to 2029 Figure 22: Global Market Attractiveness Analysis by Region, 2022 to 2029 Figure 23: North America Market Value Share, By Product, 2022 (E) Figure 24: North America Market Value Share, By Indication, 2022 (E) Figure 25: North America Market Value Share, By Radiation, 2022 (E) Figure 26: North America Market Value Share, By End User, 2022 (E) Figure 27: North America Market Value Share, By Country, 2022 (E) Figure 28: North America Market Value Analysis (US$ Million), 2014 to 2021 Figure 29: North America Market Value Forecast (US$ Million), 2022 to 2029 Figure 30: North America Market Attractiveness Analysis by Product, 2022 to 2029 Figure 31: North America Market Attractiveness Analysis by Indication, 2022 to 2029 Figure 32: North America Market Attractiveness Analysis by Radiation, 2022 to 2029 Figure 33: North America Market Attractiveness Analysis by End User, 2022 to 2029 Figure 34: North America Market Attractiveness Analysis by Country, 2022 to 2029 Figure 35: Latin America Market Value Share, By Product, 2022 (E) Figure 36: Latin America Market Value Share, By Indication, 2022 (E) Figure 37: Latin America Market Value Share, By Radiation, 2022 (E) Figure 38: Latin America Market Value Share, By End User, 2022 (E) Figure 39: Latin America Market Value Share, By Country, 2022 (E) Figure 40: Latin America Market Value Analysis (US$ Million), 2014 to 2021 Figure 41: Latin America Market Value Forecast (US$ Million), 2022 to 2029 Figure 42: Latin America Market Attractiveness Analysis by Product, 2022 to 2029 Figure 43: Latin America Market Attractiveness Analysis by Indication, 2022 to 2029 Figure 44: Latin America Market Attractiveness Analysis by Radiation, 2022 to 2029 Figure 45: Latin America Market Attractiveness Analysis by End User, 2022 to 2029 Figure 46: Latin America Market Attractiveness Analysis by Country, 2022 to 2029 Figure 47: Europe Market Value Share, By Product, 2022 (E) Figure 48: Europe Market Value Share, By Indication, 2022 (E) Figure 49: Europe Market Value Share, By Radiation, 2022 (E) Figure 50: Europe Market Value Share, By End User, 2022 (E) Figure 51: Europe Market Value Share, By Country, 2022 (E) Figure 52: Europe Market Value Analysis (US$ Million), 2014 to 2021 Figure 53: Europe Market Value Forecast (US$ Million), 2022 to 2029 Figure 54: Europe Market Attractiveness Analysis by Product, 2022 to 2029 Figure 55: Europe Market Attractiveness Analysis by Indication, 2022 to 2029 Figure 56: Europe Market Attractiveness Analysis by Radiation, 2022 to 2029 Figure 57: Europe Market Attractiveness Analysis by End User, 2022 to 2029 Figure 58: Europe Market Attractiveness Analysis by Country, 2022 to 2029 Figure 59: East Asia Market Value Share, By Product, 2022 (E) Figure 60: East Asia Market Value Share, By Indication, 2022 (E) Figure 61: East Asia Market Value Share, By Radiation, 2022 (E) Figure 62: East Asia Market Value Share, By End User, 2022 (E) Figure 63: East Asia Market Value Share, By Country, 2022 (E) Figure 64: East Asia Market Value Analysis (US$ Million), 2014 to 2021 Figure 65: East Asia Market Value Forecast (US$ Million), 2022 to 2029 Figure 66: East Asia Market Attractiveness Analysis by Product, 2022 to 2029 Figure 67: East Asia Market Attractiveness Analysis by Indication, 2022 to 2029 Figure 68: East Asia Market Attractiveness Analysis by Radiation, 2022 to 2029 Figure 69: East Asia Market Attractiveness Analysis by End User, 2022 to 2029 Figure 70: East Asia Market Attractiveness Analysis by Country, 2022 to 2029 Figure 71: South Asia Market Value Share, By Product, 2022 (E) Figure 72: South Asia Market Value Share, By Indication, 2022 (E) Figure 73: South Asia Market Value Share, By Radiation, 2022 (E) Figure 74: South Asia Market Value Share, By End User, 2022 (E) Figure 75: South Asia Market Value Share, By Country, 2022 (E) Figure 76: South Asia Market Value Analysis (US$ Million), 2014 to 2021 Figure 77: South Asia Market Value Forecast (US$ Million), 2022 to 2029 Figure 78: South Asia Market Attractiveness Analysis by Product, 2022 to 2029 Figure 79: South Asia Market Attractiveness Analysis by Indication, 2022 to 2029 Figure 80: South Asia Market Attractiveness Analysis by Radiation, 2022 to 2029 Figure 81: South Asia Market Attractiveness Analysis by End User, 2022 to 2029 Figure 82: South Asia Market Attractiveness Analysis by Country, 2022 to 2029 Figure 83: Oceania Market Value Share, By Product, 2022 (E) Figure 84: Oceania Market Value Share, By Indication, 2022 (E) Figure 85: Oceania Market Value Share, By Radiation, 2022 (E) Figure 86: Oceania Market Value Share, By End User, 2022 (E) Figure 87: Oceania Market Value Share, By Country, 2022 (E) Figure 88: Oceania Market Value Analysis (US$ Million), 2014 to 2021 Figure 89: Oceania Market Value Forecast (US$ Million), 2022 to 2029 Figure 90: Oceania Market Attractiveness Analysis by Product, 2022 to 2029 Figure 91: Oceania Market Attractiveness Analysis by Indication, 2022 to 2029 Figure 92: Oceania Market Attractiveness Analysis by Radiation, 2022 to 2029 Figure 93: Oceania Market Attractiveness Analysis by End User, 2022 to 2029 Figure 94: Oceania Market Attractiveness Analysis by Country, 2022 to 2029 Figure 95: Middle East and Africa(MEA) Market Value Share, By Product, 2022 (E) Figure 96: Middle East and Africa(MEA) Market Value Share, By Indication, 2022 (E) Figure 97: Middle East and Africa(MEA) Market Value Share, By Radiation, 2022 (E) Figure 98: Middle East and Africa(MEA) Market Value Share, By End User, 2022 (E) Figure 99: Middle East and Africa(MEA) Market Value Share, By Country, 2022 (E) Figure 100: Middle East and Africa(MEA) Market Value Analysis (US$ Million), 2014 to 2021 Figure 101: Middle East and Africa(MEA) Market Value Forecast (US$ Million), 2022 to 2029 Figure 102: Middle East and Africa(MEA) Market Attractiveness Analysis by Product, 2022 to 2029 Figure 103: Middle East and Africa(MEA) Market Attractiveness Analysis by Indication, 2022 to 2029 Figure 104: Middle East and Africa(MEA) Market Attractiveness Analysis by Radiation, 2022 to 2029 Figure 105: Middle East and Africa(MEA) Market Attractiveness by End User, 2022 to 2029 Figure 106: Middle East and Africa(MEA) Market Attractiveness Analysis by Country, 2022 to 2029
Recommendations
Explore Healthcare Insights
View Reports