Radiation Dose Optimisation Software Market Size and Share Forecast Outlook 2025 to 2035

The Radiation Dose Optimisation Software Market is estimated to be valued at USD 356.2 million in 2025 and is projected to reach USD 835.6 million by 2035, registering a compound annual growth rate (CAGR) of 8.9% over the forecast period.
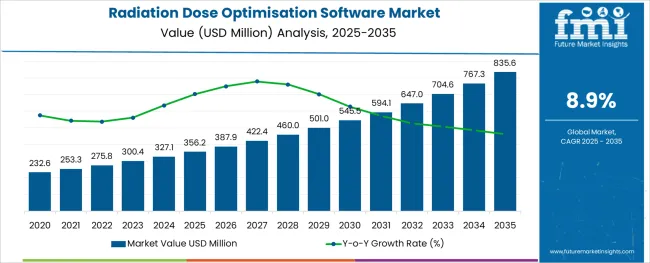
Quick Stats for Radiation Dose Optimisation Software Market

  • Industry Value (2025): USD 356.2 million
  • Forecast Value (2035): USD 835.6 million
  • Forecast CAGR: 8.9%
  • Leading Segment in 2025: Software (62.0%)
  • Key Growth Region: North America, Asia-Pacific, Europe
  • Top Key Players: General Electric Company, Koninklijke Philips N.V., Siemens AG, Agfa-Gevaert Group, Bracco, Sectra AB, FUJIFILM Holdings Corporation, QAELUM NV, Virtual Phantoms Inc., Medic Vision Imaging Solutions. Ltd., Bayer AG

Radiation Dose Optimisation Software Market Market Value Analysis

Rationale for Segmental Growth in the Radiation Dose Optimisation Software Market

Market Overview

The radiation dose optimisation software market is undergoing significant evolution as healthcare providers prioritize patient safety, diagnostic accuracy, and regulatory compliance in imaging practices. Growing concerns regarding radiation overexposure in diagnostic radiology have prompted global efforts to standardize dose levels and enforce reporting requirements.

Healthcare institutions are adopting intelligent software systems that leverage machine learning and historical imaging data to recommend optimal scanning protocols and adjust dose parameters in real time. These platforms are increasingly integrated with PACS and RIS systems to provide seamless workflow compatibility.

Rising demand for personalized imaging, increased adoption of advanced modalities such as CT and hybrid imaging, and international regulatory pressure from bodies focused on radiological protection are all contributing to the market’s upward trajectory. Future growth is expected to be driven by cloud-based deployment models, AI-powered dose monitoring tools, and clinical decision support features tailored to patient-specific risk profiles and imaging needs.
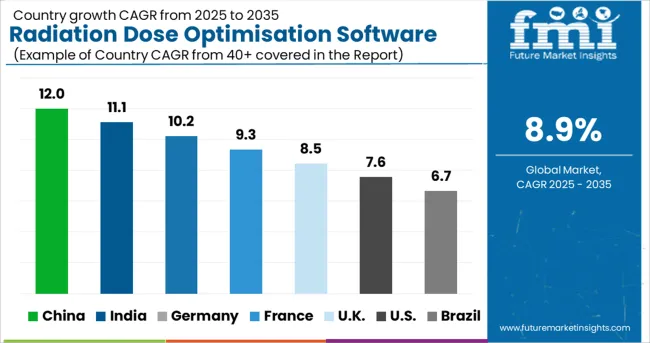
Segmental Analysis

Radiation Dose Optimisation Software Market Cagr Analysis By Country

The market is segmented by Component and End User and region. By Component, the market is divided into Software and Services. In terms of End User, the market is classified into Hospitals, Diagnostic Centers, Cancer Research Institutes, and Others.

Regionally, the market is classified into North America, Latin America, Western Europe, Eastern Europe, Balkan & Baltic Countries, Russia & Belarus, Central Asia, East Asia, South Asia & Pacific, and the Middle East & Africa.
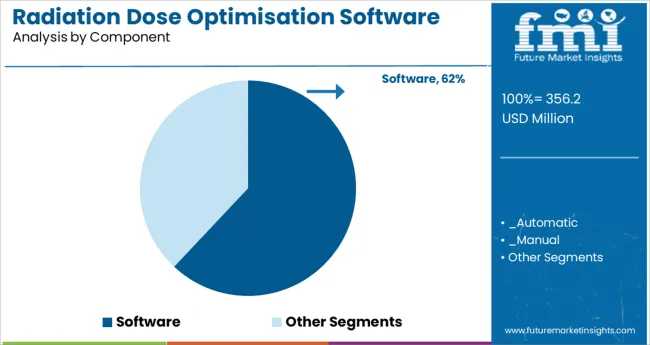
Insights into the Software Component Segment

Radiation Dose Optimisation Software Market Analysis By Component

The software component segment is anticipated to lead the market with a 62.0% revenue share in 2025, reinforcing its central role in dose optimisation strategies. This dominance is attributed to the critical function software plays in enabling real time monitoring, dose tracking, and protocol standardisation across diverse imaging systems.

Vendors have focused on developing interoperable platforms that can integrate with existing imaging infrastructure while providing intuitive dashboards, audit-ready reporting tools, and AI-assisted dose recommendations. As imaging volumes increase and reimbursement models link to quality metrics, healthcare providers have been prioritizing investment in software that not only ensures patient safety but also improves operational efficiency and compliance.

The flexibility offered by modular software solutions in accommodating various imaging environments and regulatory frameworks has further cemented their leading position in the component landscape.
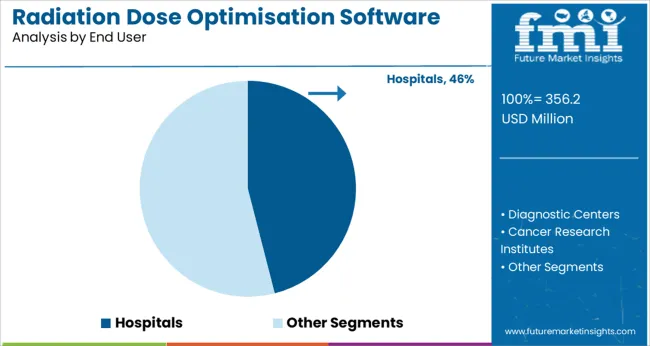
Insights into the Hospitals End User Segment

Radiation Dose Optimisation Software Market Analysis By End User

Hospitals are projected to account for 46.0% of total revenue in the radiation dose optimisation software market in 2025, making them the leading end user group. This leadership is being driven by high imaging volumes, comprehensive diagnostic service offerings, and the institutional responsibility to meet safety and accreditation standards.

Hospitals are increasingly adopting enterprise-wide dose monitoring solutions that offer cross-departmental integration, enabling centralised oversight of patient exposure levels. These systems facilitate compliance with international guidelines, reduce risk of radiation-induced complications, and support clinical decision-making by aligning dose protocols with diagnostic requirements.

The growing number of accreditation programs tied to dose tracking and optimisation, alongside the rise in advanced imaging modalities used in hospitals, has reinforced the need for scalable and intelligent software tools. As patient safety, regulatory alignment, and digital transformation remain top priorities in hospital imaging departments, their share in the market is expected to remain prominent.

How The Market Progressed Till June 2025?

Market Statistics Details
H1,2024 (A) 27.1%
H1,2025 Projected (P) 27.4%
H1,2025 Outlook (O) 28.0%
BPS Change : H1,2025 (O) - H1,2025 (P) (+) 60 ↑
BPS Change : H1,2025 (O) - H1,2024 (A) (+) 90 ↑

The concentration of cancer cure hospitals for making sure the security of patients together with increasing the security of workers working in radiotherapy centres is promoting hospitals to set up radiation dose optimization software. Many vendors are providing radiation dose optimization software and are constantly improving their product offerings to become competitive in the radiation dose optimization software market.

According to the Future Market Insights analysis, the BPS values interpreted in the radiation dose optimization software market in H1,2025-(O) (Outlook) over H1,2025 (P) are projected to show a growth of +60 units. The reason for the growth of BPS values is the high focus on research and development in the healthcare sector, leading to higher adoption of modern technologies by healthcare providers is the major factor driving the market growth.

The BPS change: H1, 2025 (O) over H1,2024 (A) shows a growth of +90 units. The crucial reason for this growth of BPS values is a rise in the need for radiation dose optimization software in hospitals because of the growing number of medical X-ray imaging, computed tomography scans, and other diagnosis carried out in hospitals is the major factor driving the market growth.

Hospitals to emerge dominant in terms of deployment in the coming years

Radiation dose optimisation software is available in automatic as well as manual operating modes. The automatic mode is extensively favoured by end users such as diagnostic centres, hospitals, cancer research institutes, and others as it decreases errors that are likely to occur from human interference.

The software solution automatically measures, examines, gathers, and reports a patient’s radiation exposure data in groups as well as on an individual basis, and also allows real-time staff exposure measurements.

Doctors are using radiation dose optimisation software for the purpose of observing and governing radiation doses in patients. Also, radiation dose optimisation software is used for controlling multiple aspects related to the dose. The radiation dose quantity varies as per the patient and the disease.

Given the humungous number of hospitals present in the world, the market for radiation dose optimisation software is expected to increase shortly. Moreover, the healthcare sector comprises a significant amount of market share in the global industry. Further, there is a high focus on research and development in the healthcare sector, leading to heavy adoption of the latest technologies by healthcare providers, which is expected to significantly impact the market growth of radiation dose optimisation software.

Hospitals are a key target area for radiation dose optimisation software vendors, accounting for over half the overall radiation dose optimisation software market. An increase in the demand for radiation dose optimisation software in hospitals is due to the increasing number of X-ray examinations, CT scans, and other examinations conducted in hospitals.

Diagnostic centres to provide lucrative opportunities in the near future

Diagnostic centres occupied a share of 22.0% in 2020 and are expected to witness a downfall in market share by the end of 2035. Despite witnessing a downfall, diagnostic centres will remain the second leading end user in terms of deployment of radiation dose optimisation software as the need to diagnose chronic diseases will trigger demand for the software. Cancer diagnosis will play a crucial role in the development of this sector in particular with radiation monitoring being the need of the hour.

Radiation Dose Optimisation Software Market: Segmentation

By Component:

  • Software
  • Automatic
  • Manual
  • Services
  • Education & Training
  • Support

By End User:

  • Hospitals
  • Diagnostic Centres
  • Cancer Research Institutes
  • Others

By Region:

  • North America
  • Western Europe
  • Eastern Europe
  • Latin America
  • Asia Pacific Excluding Japan
  • Japan
  • Middle East and Africa

Table of Content

  1. Executive Summary
    • Global Market Outlook
    • Demand-side Trends
    • Supply-side Trends
    • Technology Roadmap Analysis
    • Analysis and Recommendations
  2. Market Overview
    • Market Coverage / Taxonomy
    • Market Definition / Scope / Limitations
  3. Market Background
    • Market Dynamics
      • Drivers
      • Restraints
      • Opportunity
      • Trends
    • Scenario Forecast
      • Demand in Optimistic Scenario
      • Demand in Likely Scenario
      • Demand in Conservative Scenario
    • Opportunity Map Analysis
    • Product Life Cycle Analysis
    • Supply Chain Analysis
    • Investment Feasibility Matrix
    • Value Chain Analysis
    • PESTLE and Porter’s Analysis
    • Regulatory Landscape
    • Regional Parent Market Outlook
    • Production and Consumption Statistics
    • Import and Export Statistics
  4. Global Market Analysis 2020 to 2024 and Forecast, 2025 to 2035
    • Historical Market Size Value (USD Million) Analysis, 2020 to 2024
    • Current and Future Market Size Value (USD Million) Projections, 2025 to 2035
      • Y-o-Y Growth Trend Analysis
      • Absolute $ Opportunity Analysis
  5. Global Market Pricing Analysis 2020 to 2024 and Forecast 2025 to 2035
  6. Global Market Analysis 2020 to 2024 and Forecast 2025 to 2035, By Component
    • Introduction / Key Findings
    • Historical Market Size Value (USD Million) Analysis By Component , 2020 to 2024
    • Current and Future Market Size Value (USD Million) Analysis and Forecast By Component , 2025 to 2035
      • Software
        • Automatic
        • Manual
      • Services
        • Education & Training
        • Support
    • Y-o-Y Growth Trend Analysis By Component , 2020 to 2024
    • Absolute $ Opportunity Analysis By Component , 2025 to 2035
  7. Global Market Analysis 2020 to 2024 and Forecast 2025 to 2035, By End User
    • Introduction / Key Findings
    • Historical Market Size Value (USD Million) Analysis By End User, 2020 to 2024
    • Current and Future Market Size Value (USD Million) Analysis and Forecast By End User, 2025 to 2035
      • Hospitals
      • Diagnostic Centers
      • Cancer Research Institutes
      • Others
    • Y-o-Y Growth Trend Analysis By End User, 2020 to 2024
    • Absolute $ Opportunity Analysis By End User, 2025 to 2035
  8. Global Market Analysis 2020 to 2024 and Forecast 2025 to 2035, By Region
    • Introduction
    • Historical Market Size Value (USD Million) Analysis By Region, 2020 to 2024
    • Current Market Size Value (USD Million) Analysis and Forecast By Region, 2025 to 2035
      • North America
      • Latin America
      • Western Europe
      • Eastern Europe
      • East Asia
      • South Asia and Pacific
      • Middle East & Africa
    • Market Attractiveness Analysis By Region
  9. North America Market Analysis 2020 to 2024 and Forecast 2025 to 2035, By Country
    • Historical Market Size Value (USD Million) Trend Analysis By Market Taxonomy, 2020 to 2024
    • Market Size Value (USD Million) Forecast By Market Taxonomy, 2025 to 2035
      • By Country
        • USA
        • Canada
        • Mexico
      • By Component
      • By End User
    • Market Attractiveness Analysis
      • By Country
      • By Component
      • By End User
    • Key Takeaways
  10. Latin America Market Analysis 2020 to 2024 and Forecast 2025 to 2035, By Country
    • Historical Market Size Value (USD Million) Trend Analysis By Market Taxonomy, 2020 to 2024
    • Market Size Value (USD Million) Forecast By Market Taxonomy, 2025 to 2035
      • By Country
        • Brazil
        • Chile
        • Rest of Latin America
      • By Component
      • By End User
    • Market Attractiveness Analysis
      • By Country
      • By Component
      • By End User
    • Key Takeaways
  11. Western Europe Market Analysis 2020 to 2024 and Forecast 2025 to 2035, By Country
    • Historical Market Size Value (USD Million) Trend Analysis By Market Taxonomy, 2020 to 2024
    • Market Size Value (USD Million) Forecast By Market Taxonomy, 2025 to 2035
      • By Country
        • Germany
        • UK
        • Italy
        • Spain
        • France
        • Nordic
        • BENELUX
        • Rest of Western Europe
      • By Component
      • By End User
    • Market Attractiveness Analysis
      • By Country
      • By Component
      • By End User
    • Key Takeaways
  12. Eastern Europe Market Analysis 2020 to 2024 and Forecast 2025 to 2035, By Country
    • Historical Market Size Value (USD Million) Trend Analysis By Market Taxonomy, 2020 to 2024
    • Market Size Value (USD Million) Forecast By Market Taxonomy, 2025 to 2035
      • By Country
        • Russia
        • Poland
        • Hungary
        • Balkan & Baltic
        • Rest of Eastern Europe
      • By Component
      • By End User
    • Market Attractiveness Analysis
      • By Country
      • By Component
      • By End User
    • Key Takeaways
  13. East Asia Market Analysis 2020 to 2024 and Forecast 2025 to 2035, By Country
    • Historical Market Size Value (USD Million) Trend Analysis By Market Taxonomy, 2020 to 2024
    • Market Size Value (USD Million) Forecast By Market Taxonomy, 2025 to 2035
      • By Country
        • China
        • Japan
        • South Korea
      • By Component
      • By End User
    • Market Attractiveness Analysis
      • By Country
      • By Component
      • By End User
    • Key Takeaways
  14. South Asia and Pacific Market Analysis 2020 to 2024 and Forecast 2025 to 2035, By Country
    • Historical Market Size Value (USD Million) Trend Analysis By Market Taxonomy, 2020 to 2024
    • Market Size Value (USD Million) Forecast By Market Taxonomy, 2025 to 2035
      • By Country
        • India
        • ASEAN
        • Australia & New Zealand
        • Rest of South Asia and Pacific
      • By Component
      • By End User
    • Market Attractiveness Analysis
      • By Country
      • By Component
      • By End User
    • Key Takeaways
  15. Middle East & Africa Market Analysis 2020 to 2024 and Forecast 2025 to 2035, By Country
    • Historical Market Size Value (USD Million) Trend Analysis By Market Taxonomy, 2020 to 2024
    • Market Size Value (USD Million) Forecast By Market Taxonomy, 2025 to 2035
      • By Country
        • Kingdom of Saudi Arabia
        • Other GCC Countries
        • Turkiye
        • South Africa
        • Other African Union
        • Rest of Middle East & Africa
      • By Component
      • By End User
    • Market Attractiveness Analysis
      • By Country
      • By Component
      • By End User
    • Key Takeaways
  16. Key Countries Market Analysis
    • USA
      • Pricing Analysis
      • Market Share Analysis, 2024
        • By Component
        • By End User
    • Canada
      • Pricing Analysis
      • Market Share Analysis, 2024
        • By Component
        • By End User
    • Mexico
      • Pricing Analysis
      • Market Share Analysis, 2024
        • By Component
        • By End User
    • Brazil
      • Pricing Analysis
      • Market Share Analysis, 2024
        • By Component
        • By End User
    • Chile
      • Pricing Analysis
      • Market Share Analysis, 2024
        • By Component
        • By End User
    • Germany
      • Pricing Analysis
      • Market Share Analysis, 2024
        • By Component
        • By End User
    • UK
      • Pricing Analysis
      • Market Share Analysis, 2024
        • By Component
        • By End User
    • Italy
      • Pricing Analysis
      • Market Share Analysis, 2024
        • By Component
        • By End User
    • Spain
      • Pricing Analysis
      • Market Share Analysis, 2024
        • By Component
        • By End User
    • France
      • Pricing Analysis
      • Market Share Analysis, 2024
        • By Component
        • By End User
    • India
      • Pricing Analysis
      • Market Share Analysis, 2024
        • By Component
        • By End User
    • ASEAN
      • Pricing Analysis
      • Market Share Analysis, 2024
        • By Component
        • By End User
    • Australia & New Zealand
      • Pricing Analysis
      • Market Share Analysis, 2024
        • By Component
        • By End User
    • China
      • Pricing Analysis
      • Market Share Analysis, 2024
        • By Component
        • By End User
    • Japan
      • Pricing Analysis
      • Market Share Analysis, 2024
        • By Component
        • By End User
    • South Korea
      • Pricing Analysis
      • Market Share Analysis, 2024
        • By Component
        • By End User
    • Russia
      • Pricing Analysis
      • Market Share Analysis, 2024
        • By Component
        • By End User
    • Poland
      • Pricing Analysis
      • Market Share Analysis, 2024
        • By Component
        • By End User
    • Hungary
      • Pricing Analysis
      • Market Share Analysis, 2024
        • By Component
        • By End User
    • Kingdom of Saudi Arabia
      • Pricing Analysis
      • Market Share Analysis, 2024
        • By Component
        • By End User
    • Turkiye
      • Pricing Analysis
      • Market Share Analysis, 2024
        • By Component
        • By End User
    • South Africa
      • Pricing Analysis
      • Market Share Analysis, 2024
        • By Component
        • By End User
  17. Market Structure Analysis
    • Competition Dashboard
    • Competition Benchmarking
    • Market Share Analysis of Top Players
      • By Regional
      • By Component
      • By End User
  18. Competition Analysis
    • Competition Deep Dive
      • General Electric Company
        • Overview
        • Product Portfolio
        • Profitability by Market Segments (Product/Age /Sales Channel/Region)
        • Sales Footprint
        • Strategy Overview
          • Marketing Strategy
          • Product Strategy
          • Channel Strategy
      • Koninklijke Philips N.V.
      • Siemens AG
      • Agfa-Gevaert Group
      • Bracco
      • Sectra AB
      • FUJIFILM Holdings Corporation
      • QAELUM NV
      • Virtual Phantoms Inc.
      • Medic Vision Imaging Solutions. Ltd.
      • Bayer AG
  19. Assumptions & Acronyms Used
  20. Research Methodology

List of Tables

  • Table 1: Global Market Value (USD Million) Forecast by Region, 2020-2035
  • Table 2: North America Market Value (USD Million) Forecast by Country, 2020-2035
  • Table 3: Latin America Market Value (USD Million) Forecast by Country, 2020-2035
  • Table 4: Western Europe Market Value (USD Million) Forecast by Country, 2020-2035
  • Table 5: Eastern Europe Market Value (USD Million) Forecast by Country, 2020-2035
  • Table 6: East Asia Market Value (USD Million) Forecast by Country, 2020-2035
  • Table 7: South Asia and Pacific Market Value (USD Million) Forecast by Country, 2020-2035
  • Table 8: Middle East & Africa Market Value (USD Million) Forecast by Country, 2020-2035

List of Figures

  • Figure 1: Global Market Pricing Analysis
  • Figure 2: Global Market Value (USD Million) Forecast 2020-2035
  • Figure 3: Global Market Value (USD Million) Share and BPS Analysis by Region, 2025 and 2035
  • Figure 4: Global Market Y-o-Y Growth Comparison by Region, 2025-2035
  • Figure 5: Global Market Attractiveness Analysis by Region
  • Figure 6: North America Market Incremental $ Opportunity, 2025-2035
  • Figure 7: Latin America Market Incremental $ Opportunity, 2025-2035
  • Figure 8: Western Europe Market Incremental $ Opportunity, 2025-2035
  • Figure 9: Eastern Europe Market Incremental $ Opportunity, 2025-2035
  • Figure 10: East Asia Market Incremental $ Opportunity, 2025-2035
  • Figure 11: South Asia and Pacific Market Incremental $ Opportunity, 2025-2035
  • Figure 12: Middle East & Africa Market Incremental $ Opportunity, 2025-2035
  • Figure 13: North America Market Value Share and BPS Analysis by Country, 2025 and 2035
  • Figure 14: Latin America Market Value Share and BPS Analysis by Country, 2025 and 2035
  • Figure 15: Western Europe Market Value Share and BPS Analysis by Country, 2025 and 2035
  • Figure 16: Eastern Europe Market Value Share and BPS Analysis by Country, 2025 and 2035
  • Figure 17: East Asia Market Value Share and BPS Analysis by Country, 2025 and 2035
  • Figure 18: South Asia and Pacific Market Value Share and BPS Analysis by Country, 2025 and 2035
  • Figure 19: Middle East & Africa Market Value Share and BPS Analysis by Country, 2025 and 2035
  • Figure 20: Global Market - Tier Structure Analysis
  • Figure 21: Global Market - Company Share Analysis

Frequently Asked Questions

How big is the radiation dose optimisation software market in 2025?

The global radiation dose optimisation software market is estimated to be valued at USD 356.2 million in 2025.

What will be the market size for the radiation dose optimisation software market in 2035?

It is projected to reach USD 835.6 million by 2035.

How much will be the CAGR of the radiation dose optimisation software market between 2025 and 2035?

The market is expected to grow at a 8.9% CAGR between 2025 and 2035.

What are the key product types in the radiation dose optimisation software market?

The key product types are software, _automatic, _manual, services, _education & training and _support.

Which hospitals segment is expected to dominate the radiation dose optimisation software market in 2025?

hospitals segment is expected to dominate with a 46.0% industry share in 2025.

Explore Similar Insights

Future Market Insights

Radiation Dose Optimisation Software Market