Reports
- Global Locations -
Headquarters
Future Market Insights, Inc.
Christiana Corporate, 200
Continental Drive, Suite 401,
Newark, Delaware - 19713,
United States
Americas
Future Market Insights, Inc.
616 Corporate Way, Suite 2-9018,
Valley Cottage, NY 10989, United States
MEA
Future Market Insights
1602-6 Jumeirah Bay X2 Tower, Plot No: JLT-PH2-X2A,
Jumeirah Lakes Towers, Dubai,
United Arab Emirates
Europe
Future Market Insights
3rd Floor, 207 Regent Street,
W1B 3HH London
United Kingdom
Asia Pacific
Future Market Insights
Office No. 401-A, 4th Floor,
VANTAGE 9, S.No. 36/1/1,
Baner, Pune 411045, India
The global digital X-ray equipment market is projected to expand at an exceptional double-digit CAGR from 2022 to 2032.
Advances in technology, efforts to improve healthcare facilities, and an aging population are all driving demand for digital X-ray equipment.
Increased product approvals, as well as partnerships and collaborations by key players who are striving to expand their digital X-ray equipment market share, and scale up sales of digital X-ray equipment.
For example, Nanox and SK Telcom agreed to collaborate on the deployment of 2,500 Nanoxdigital X-ray Systems in South Korea and Vietnam.
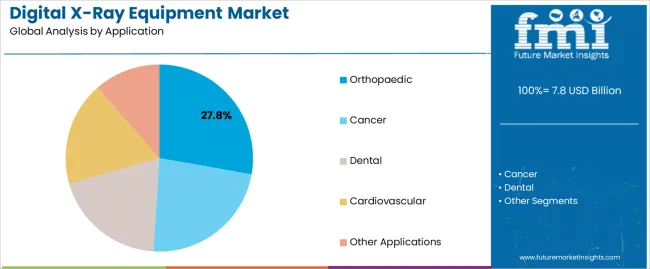
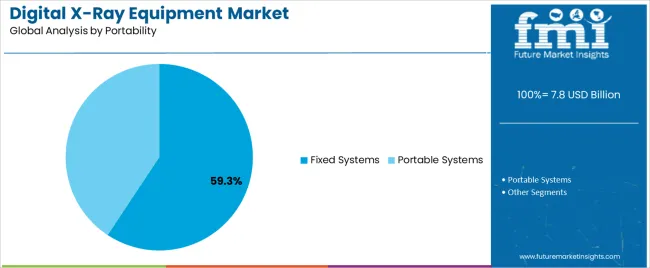
Rising awareness of the availability of portable systems is one of the major factors driving the demand for digital X-ray equipment.
Low cost and ease of use are the primary benefits associated with digital X-rays that are propelling the sales of digital X-ray equipment.
Demand for digital X-ray equipment also scales up as the images are also instantly available for distribution to clinical services, eliminating the need for time and physical effort to retrieve film packets.
This factor has a significant impact on the sales of digital X-ray equipment.
A major benefit is patients are exposed to 70-80% less radiation than traditional X-rays, thereby ensuring the safety of pregnant women and patients who are already ill, and the same is expected to accelerate the demand for digital X-ray equipment.
Dentists can now easily recognize oral issues with the help of digital X-rays, which is leading to a decrease in the need for an invasive investigation at the diagnosis stage, thereby surging the sales of digital X-ray equipment.
Digital radiography securely stores patient X-rays, resulting in no loss on the part of the holders.
The demand for digital X-ray equipment has been significantly influenced by rising healthcare expenditures made by various governments in order to advance technological advancements in the sector.
Don't pay for what you don't need
Customize your report by selecting specific countries or regions and save 30%!
The primary factor that is scaling up the sales of digital X-ray equipment is the efficiency of electromagnetic radiations that represent clear digital images through digital X-ray equipment.
The rise in demand for digital X-ray equipment is also attributable to quick healthcare delivery, improved workflow, and the safety associated with digital X-ray radiations for living tissues.
The sales of digital X-ray equipment are majorly driven by novel technological advancements, increasing healthcare expenditure, a rise in the aging population, and disease prevalence.
The digital X-ray equipment market is also witnessing a highly competitive scenario that has led to a large number of improved digital X-ray equipment launches where key players are focusing on rising their digital X-ray equipment market share.
Digital X-ray equipment is less expensive yet more efficient than other radiography equipment, in turn driving the demand for digital X-ray equipment.
The adoption of digital X-rays is expected to broaden thereby spiking the sales of digital X-ray equipment as digital X-ray equipment is based on the transmission of the X-ray beam, which exposes only the surfaces of the human anatomy under observation.
Digital X-ray equipment delivers medical imaging in the standard safety radiation dose and is widely used in the imaging of all human body tissues, which is expected to rise the demand for digital X-ray equipment.
Digital X-ray equipment has become a part of routine check-ups, thereby facilitating huge sales of digital X-ray equipment.
One of the most promising areas of health innovation is the use of artificial intelligence (AI), particularly in medical imaging, which is expected to drive the demand for digital X-ray equipment to a large extent.
In this regard, many ongoing research and development programs have aided various companies to acquire a large digital X-ray equipment market share.
Various companies are currently conducting Research and Development activities to provide AI in various imaging modalities, including digital X-ray systems to enlarge digital X-ray equipment market share.
Digital X-ray imaging is one of the most important pillars of medical imaging.
Depending on geographic regions, the global digital X-ray equipment market is segmented into seven key regions: North America, South America, Eastern Europe, Western Europe, Asia Pacific, Japan, and Middle East & Africa.
Asia Pacific's digital X-ray equipment market is expected to grow at a remarkable CAGR owing to the improving healthcare facilities and infrastructure.
Also, the expanding middle-class population in the region is expected to add significant fuel to the sales of digital X-ray equipment.
The countries of New Zealand, Australia, India, China, and Japan have ample potential and availability of advanced diagnostics and therapeutics which contribute to the sales of digital X-ray equipment globally.
The Asia Pacific region also contributes favorably to global medical tourism and further to the global digital X-ray equipment market.
Some of the key players in the digital X-ray equipment market are Siemens AG, Philips Healthcare, Canon USA Inc., Shimadzu Corporation, GE Healthcare, Varian Medical Systems, and Agfa-Gevaert N.V. Healthcare.
Hitachi Medical Corporation, Toshiba Medical Systems, Fuji Medical Systems, and China Resources Holding Medical Equipment Company Limited are some other major digital X-ray equipment market players.
The competition in the digital X-ray equipment market is primarily based on technological advances in digital X-ray equipment and the pricing of digital X-ray equipment.
The demand for digital X-ray equipment is largely driven by technological advancements and the cost of digital X-ray equipment.
To secure a major digital X-ray equipment market share globally, the key players have engaged in various strategic alliances such as acquisitions, collaborations, and the launch of advanced products.
Get the data you need at a Fraction of the cost
Personalize your report by choosing insights you need
and save 40%!
Report Attributes | Details |
---|---|
The base year for estimation | 2021 |
Historical data | 2015 to 2020 |
Forecast period | 2022 to 2032 |
Quantitative units | Revenue in USD Million, volume in kilotons, and CAGR from 2022 to 2032 |
Report Coverage | Revenue forecast, volume forecast, company ranking, competitive landscape, growth factors, and trends, Pricing Analysis |
Segments Covered | Application, Technology, Portability, End User, Region |
Regional scope | North America; Western Europe, Eastern Europe, Middle East, Africa, ASEAN, South Asia, Rest of Asia, Australia, and New Zealand |
Country scope | USA; Canada; Mexico; Germany; United Kingdom; France; Italy; Spain; Russia; Belgium; Poland; Czech Republic; China; India; Japan; Australia; Brazil; Argentina; Colombia; Saudi Arabia; United Arab Emirates(UAE); Iran; South Africa |
Key companies profiled | Siemens AG, Philips Healthcare, Canon USA Inc., Shimadzu Corporation, GE Healthcare, Varian Medical Systems, Agfa-Gevaert N.V. Healthcare. |
Customization scope | Free report customization (equivalent to up to 8 analysts' working days) with purchase. Addition or alteration to country, regional & segment scope. |
Pricing and purchase options | Avail customized purchase options to meet your exact research needs. |
1. Executive Summary | Digital X-Ray Equipment Market 1.1. Global Market Outlook 1.2. Demand-side Trends 1.3. Supply-side Trends 1.4. Technology Roadmap Analysis 1.5. Analysis and Recommendations 2. Market Overview 2.1. Market Coverage / Taxonomy 2.2. Market Definition / Scope / Limitations 3. Market Background 3.1. Market Dynamics 3.1.1. Drivers 3.1.2. Restraints 3.1.3. Opportunity 3.1.4. Trends 3.2. Scenario Forecast 3.2.1. Demand in Optimistic Scenario 3.2.2. Demand in Likely Scenario 3.2.3. Demand in Conservative Scenario 3.3. Opportunity Map Analysis 3.4. Product Life Cycle Analysis 3.5. Supply Chain Analysis 3.5.1. Supply Side Participants and Their Roles 3.5.1.1. Producers 3.5.1.2. Mid-Level Participants (Traders/ Agents/ Brokers) 3.5.1.3. Wholesalers and Distributors 3.5.2. Value Added and Value Created at Node in the Supply Chain 3.5.3. List of Raw Material Suppliers 3.5.4. List of Existing and Potential Buyers 3.6. Investment Feasibility Matrix 3.7. Value Chain Analysis 3.7.1. Profit Margin Analysis 3.7.2. Wholesalers and Distributors 3.7.3. Retailers 3.8. PESTLE and Porter’s Analysis 3.9. Regulatory Landscape 3.9.1. By Key Regions 3.9.2. By Key Countries 3.10. Regional Parent Market Outlook 3.11. Production and Consumption Statistics 3.12. Import and Export Statistics 4. Global Market Analysis 2017 to 2021 and Forecast, 2022 to 2032 4.1. Historical Market Size Value (US$ Million) & Volume (Units) Analysis, 2017 to 2021 4.2. Current and Future Market Size Value (US$ Million) & Volume (Units) Projections, 2022 to 2032 4.2.1. Y-o-Y Growth Trend Analysis 4.2.2. Absolute $ Opportunity Analysis 5. Global Market Analysis 2017 to 2021 and Forecast 2022 to 2032, By Product Type 5.1. Introduction / Key Findings 5.2. Historical Market Size Value (US$ Million) & Volume (Units) Analysis By Product Type, 2017 to 2021 5.3. Current and Future Market Size Value (US$ Million) & Volume (Units) Analysis and Forecast By Product Type, 2022 to 2032 5.3.1. Computed Radiography Digital X-Ray Equipment 5.3.2. Direct Radiography Digital X-Ray Equipment 5.4. Y-o-Y Growth Trend Analysis By Product Type, 2017 to 2021 5.5. Absolute $ Opportunity Analysis By Product Type, 2022 to 2032 Deep-dive segmentation will be available in the sample on request 6. Global Market Analysis 2017 to 2021 and Forecast 2022 to 2032, By Modality 6.1. Introduction / Key Findings 6.2. Historical Market Size Value (US$ Million) & Volume (Units) Analysis By Modality, 2017 to 2021 6.3. Current and Future Market Size Value (US$ Million) & Volume (Units) Analysis and Forecast By Modality, 2022 to 2032 6.3.1. Standalone 6.3.2. Portable 6.4. Y-o-Y Growth Trend Analysis By Modality, 2017 to 2021 6.5. Absolute $ Opportunity Analysis By Modality, 2022 to 2032 Deep-dive segmentation will be available in the sample on request 7. Global Market Analysis 2017 to 2021 and Forecast 2022 to 2032, By End User 7.1. Introduction / Key Findings 7.2. Historical Market Size Value (US$ Million) & Volume (Units) Analysis By End User, 2017 to 2021 7.3. Current and Future Market Size Value (US$ Million) & Volume (Units) Analysis and Forecast By End User, 2022 to 2032 7.3.1. Hospitals 7.3.2. Diagnostic Centers 7.3.3. Specialty Clinics 7.4. Y-o-Y Growth Trend Analysis By End User, 2017 to 2021 7.5. Absolute $ Opportunity Analysis By End User, 2022 to 2032 Deep-dive segmentation will be available in the sample on request 8. Global Market Analysis 2017 to 2021 and Forecast 2022 to 2032, By Region 8.1. Introduction 8.2. Historical Market Size Value (US$ Million) & Volume (Units) Analysis By Region, 2017 to 2021 8.3. Current Market Size Value (US$ Million) & Volume (Units) Analysis and Forecast By Region, 2022 to 2032 8.3.1. North America 8.3.2. Latin America 8.3.3. Europe 8.3.4. East Asia 8.3.5. South Asia & Pacific 8.3.6. Middle East and Africa 8.4. Market Attractiveness Analysis By Region 9. North America Market Analysis 2017 to 2021 and Forecast 2022 to 2032, By Country 9.1. Historical Market Size Value (US$ Million) & Volume (Units) Trend Analysis By Market Taxonomy, 2017 to 2021 9.2. Market Size Value (US$ Million) & Volume (Units) Forecast By Market Taxonomy, 2022 to 2032 9.2.1. By Country 9.2.1.1. USA 9.2.1.2. Canada 9.2.2. By Product Type 9.2.3. By Modality 9.2.4. By End User 9.3. Market Attractiveness Analysis 9.3.1. By Country 9.3.2. By Product Type 9.3.3. By Modality 9.3.4. By End User 9.4. Key Takeaways 10. Latin America Market Analysis 2017 to 2021 and Forecast 2022 to 2032, By Country 10.1. Historical Market Size Value (US$ Million) & Volume (Units) Trend Analysis By Market Taxonomy, 2017 to 2021 10.2. Market Size Value (US$ Million) & Volume (Units) Forecast By Market Taxonomy, 2022 to 2032 10.2.1. By Country 10.2.1.1. Mexico 10.2.1.2. Brazil 10.2.1.3. Rest of Latin America 10.2.2. By Product Type 10.2.3. By Modality 10.2.4. By End User 10.3. Market Attractiveness Analysis 10.3.1. By Country 10.3.2. By Product Type 10.3.3. By Modality 10.3.4. By End User 10.4. Key Takeaways 11. Europe Market Analysis 2017 to 2021 and Forecast 2022 to 2032, By Country 11.1. Historical Market Size Value (US$ Million) & Volume (Units) Trend Analysis By Market Taxonomy, 2017 to 2021 11.2. Market Size Value (US$ Million) & Volume (Units) Forecast By Market Taxonomy, 2022 to 2032 11.2.1. By Country 11.2.1.1. Germany 11.2.1.2. Italy 11.2.1.3. France 11.2.1.4. United Kingdom 11.2.1.5. Spain 11.2.1.6. BENELUX 11.2.1.7. Russia 11.2.1.8. Rest of Europe 11.2.2. By Product Type 11.2.3. By Modality 11.2.4. By End User 11.3. Market Attractiveness Analysis 11.3.1. By Country 11.3.2. By Product Type 11.3.3. By Modality 11.3.4. By End User 11.4. Key Takeaways 12. East Asia Market Analysis 2017 to 2021 and Forecast 2022 to 2032, By Country 12.1. Historical Market Size Value (US$ Million) & Volume (Units) Trend Analysis By Market Taxonomy, 2017 to 2021 12.2. Market Size Value (US$ Million) & Volume (Units) Forecast By Market Taxonomy, 2022 to 2032 12.2.1. By Country 12.2.1.1. China 12.2.1.2. Japan 12.2.1.3. South Korea 12.2.2. By Product Type 12.2.3. By Modality 12.2.4. By End User 12.3. Market Attractiveness Analysis 12.3.1. By Country 12.3.2. By Product Type 12.3.3. By Modality 12.3.4. By End User 12.4. Key Takeaways 13. South Asia & Pacific Market Analysis 2017 to 2021 and Forecast 2022 to 2032, By Country 13.1. Historical Market Size Value (US$ Million) & Volume (Units) Trend Analysis By Market Taxonomy, 2017 to 2021 13.2. Market Size Value (US$ Million) & Volume (Units) Forecast By Market Taxonomy, 2022 to 2032 13.2.1. By Country 13.2.1.1. India 13.2.1.2. ASEAN 13.2.1.3. Australia and New Zealand 13.2.1.4. Rest of South Asia & Pacific 13.2.2. By Product Type 13.2.3. By Modality 13.2.4. By End User 13.3. Market Attractiveness Analysis 13.3.1. By Country 13.3.2. By Product Type 13.3.3. By Modality 13.3.4. By End User 13.4. Key Takeaways 14. Middle East and Africa Market Analysis 2017 to 2021 and Forecast 2022 to 2032, By Country 14.1. Historical Market Size Value (US$ Million) & Volume (Units) Trend Analysis By Market Taxonomy, 2017 to 2021 14.2. Market Size Value (US$ Million) & Volume (Units) Forecast By Market Taxonomy, 2022 to 2032 14.2.1. By Country 14.2.1.1. GCC Countries 14.2.1.2. Turkey 14.2.1.3. South Africa 14.2.1.4. Rest of Middle East and Africa 14.2.2. By Product Type 14.2.3. By Modality 14.2.4. By End User 14.3. Market Attractiveness Analysis 14.3.1. By Country 14.3.2. By Product Type 14.3.3. By Modality 14.3.4. By End User 14.4. Key Takeaways 15. Key Countries Market Analysis 15.1. USA 15.1.1. Pricing Analysis 15.1.2. Market Share Analysis, 2021 15.1.2.1. By Product Type 15.1.2.2. By Modality 15.1.2.3. By End User 15.2. Canada 15.2.1. Pricing Analysis 15.2.2. Market Share Analysis, 2021 15.2.2.1. By Product Type 15.2.2.2. By Modality 15.2.2.3. By End User 15.3. Mexico 15.3.1. Pricing Analysis 15.3.2. Market Share Analysis, 2021 15.3.2.1. By Product Type 15.3.2.2. By Modality 15.3.2.3. By End User 15.4. Brazil 15.4.1. Pricing Analysis 15.4.2. Market Share Analysis, 2021 15.4.2.1. By Product Type 15.4.2.2. By Modality 15.4.2.3. By End User 15.5. Germany 15.5.1. Pricing Analysis 15.5.2. Market Share Analysis, 2021 15.5.2.1. By Product Type 15.5.2.2. By Modality 15.5.2.3. By End User 15.6. Italy 15.6.1. Pricing Analysis 15.6.2. Market Share Analysis, 2021 15.6.2.1. By Product Type 15.6.2.2. By Modality 15.6.2.3. By End User 15.7. France 15.7.1. Pricing Analysis 15.7.2. Market Share Analysis, 2021 15.7.2.1. By Product Type 15.7.2.2. By Modality 15.7.2.3. By End User 15.8. United Kingdom 15.8.1. Pricing Analysis 15.8.2. Market Share Analysis, 2021 15.8.2.1. By Product Type 15.8.2.2. By Modality 15.8.2.3. By End User 15.9. Spain 15.9.1. Pricing Analysis 15.9.2. Market Share Analysis, 2021 15.9.2.1. By Product Type 15.9.2.2. By Modality 15.9.2.3. By End User 15.10. BENELUX 15.10.1. Pricing Analysis 15.10.2. Market Share Analysis, 2021 15.10.2.1. By Product Type 15.10.2.2. By Modality 15.10.2.3. By End User 15.11. Russia 15.11.1. Pricing Analysis 15.11.2. Market Share Analysis, 2021 15.11.2.1. By Product Type 15.11.2.2. By Modality 15.11.2.3. By End User 15.12. China 15.12.1. Pricing Analysis 15.12.2. Market Share Analysis, 2021 15.12.2.1. By Product Type 15.12.2.2. By Modality 15.12.2.3. By End User 15.13. Japan 15.13.1. Pricing Analysis 15.13.2. Market Share Analysis, 2021 15.13.2.1. By Product Type 15.13.2.2. By Modality 15.13.2.3. By End User 15.14. South Korea 15.14.1. Pricing Analysis 15.14.2. Market Share Analysis, 2021 15.14.2.1. By Product Type 15.14.2.2. By Modality 15.14.2.3. By End User 15.15. India 15.15.1. Pricing Analysis 15.15.2. Market Share Analysis, 2021 15.15.2.1. By Product Type 15.15.2.2. By Modality 15.15.2.3. By End User 15.16. ASIAN 15.16.1. Pricing Analysis 15.16.2. Market Share Analysis, 2021 15.16.2.1. By Product Type 15.16.2.2. By Modality 15.16.2.3. By End User 15.17. Australia and New Zealand 15.17.1. Pricing Analysis 15.17.2. Market Share Analysis, 2021 15.17.2.1. By Product Type 15.17.2.2. By Modality 15.17.2.3. By End User 15.18. GCC Countries 15.18.1. Pricing Analysis 15.18.2. Market Share Analysis, 2021 15.18.2.1. By Product Type 15.18.2.2. By Modality 15.18.2.3. By End User 15.19. Turkey 15.19.1. Pricing Analysis 15.19.2. Market Share Analysis, 2021 15.19.2.1. By Product Type 15.19.2.2. By Modality 15.19.2.3. By End User 15.20. South Africa 15.20.1. Pricing Analysis 15.20.2. Market Share Analysis, 2021 15.20.2.1. By Product Type 15.20.2.2. By Modality 15.20.2.3. By End User 16. Market Structure Analysis 16.1. Competition Dashboard 16.2. Competition Benchmarking 16.3. Market Share Analysis of Top Players 16.3.1. By Regional 16.3.2. By Product Type 16.3.3. By Modality 16.3.4. By End User 17. Competition Analysis 17.1. Competition Deep Dive 17.1.1. Siemens Healthineers 17.1.1.1. Overview 17.1.1.2. Product Portfolio 17.1.1.3. Profitability by Market Segments 17.1.1.4. Sales Footprint 17.1.1.5. Strategy Overview 17.1.1.5.1. Marketing Strategy 17.1.1.5.2. Product Strategy 17.1.1.5.3. Channel Strategy 17.1.2. GE Healthcare 17.1.2.1. Overview 17.1.2.2. Product Portfolio 17.1.2.3. Profitability by Market Segments 17.1.2.4. Sales Footprint 17.1.2.5. Strategy Overview 17.1.2.5.1. Marketing Strategy 17.1.2.5.2. Product Strategy 17.1.2.5.3. Channel Strategy 17.1.3. Canon Inc. 17.1.3.1. Overview 17.1.3.2. Product Portfolio 17.1.3.3. Profitability by Market Segments 17.1.3.4. Sales Footprint 17.1.3.5. Strategy Overview 17.1.3.5.1. Marketing Strategy 17.1.3.5.2. Product Strategy 17.1.3.5.3. Channel Strategy 17.1.4. Carestream Health 17.1.4.1. Overview 17.1.4.2. Product Portfolio 17.1.4.3. Profitability by Market Segments 17.1.4.4. Sales Footprint 17.1.4.5. Strategy Overview 17.1.4.5.1. Marketing Strategy 17.1.4.5.2. Product Strategy 17.1.4.5.3. Channel Strategy 17.1.5. Varian Medical Systems 17.1.5.1. Overview 17.1.5.2. Product Portfolio 17.1.5.3. Profitability by Market Segments 17.1.5.4. Sales Footprint 17.1.5.5. Strategy Overview 17.1.5.5.1. Marketing Strategy 17.1.5.5.2. Product Strategy 17.1.5.5.3. Channel Strategy 17.1.6. Hitachi Medical Corporation 17.1.6.1. Overview 17.1.6.2. Product Portfolio 17.1.6.3. Profitability by Market Segments 17.1.6.4. Sales Footprint 17.1.6.5. Strategy Overview 17.1.6.5.1. Marketing Strategy 17.1.6.5.2. Product Strategy 17.1.6.5.3. Channel Strategy 17.1.7. Toshiba Medical Systems Corp. 17.1.7.1. Overview 17.1.7.2. Product Portfolio 17.1.7.3. Profitability by Market Segments 17.1.7.4. Sales Footprint 17.1.7.5. Strategy Overview 17.1.7.5.1. Marketing Strategy 17.1.7.5.2. Product Strategy 17.1.7.5.3. Channel Strategy 17.1.8. Fujifilm Holdings Corporation 17.1.8.1. Overview 17.1.8.2. Product Portfolio 17.1.8.3. Profitability by Market Segments 17.1.8.4. Sales Footprint 17.1.8.5. Strategy Overview 17.1.8.5.1. Marketing Strategy 17.1.8.5.2. Product Strategy 17.1.8.5.3. Channel Strategy 17.1.9. Agfa-Gevaert N.V 17.1.9.1. Overview 17.1.9.2. Product Portfolio 17.1.9.3. Profitability by Market Segments 17.1.9.4. Sales Footprint 17.1.9.5. Strategy Overview 17.1.9.5.1. Marketing Strategy 17.1.9.5.2. Product Strategy 17.1.9.5.3. Channel Strategy 17.1.10. Mindray Medical International Limited 17.1.10.1. Overview 17.1.10.2. Product Portfolio 17.1.10.3. Profitability by Market Segments 17.1.10.4. Sales Footprint 17.1.10.5. Strategy Overview 17.1.10.5.1. Marketing Strategy 17.1.10.5.2. Product Strategy 17.1.10.5.3. Channel Strategy 17.1.11. Allengers Medical Systems Limited 17.1.11.1. Overview 17.1.11.2. Product Portfolio 17.1.11.3. Profitability by Market Segments 17.1.11.4. Sales Footprint 17.1.11.5. Strategy Overview 17.1.11.5.1. Marketing Strategy 17.1.11.5.2. Product Strategy 17.1.11.5.3. Channel Strategy 17.1.12. Professional Imaging Inc. 17.1.12.1. Overview 17.1.12.2. Product Portfolio 17.1.12.3. Profitability by Market Segments 17.1.12.4. Sales Footprint 17.1.12.5. Strategy Overview 17.1.12.5.1. Marketing Strategy 17.1.12.5.2. Product Strategy 17.1.12.5.3. Channel Strategy 17.1.13. Narang Medical Limited 17.1.13.1. Overview 17.1.13.2. Product Portfolio 17.1.13.3. Profitability by Market Segments 17.1.13.4. Sales Footprint 17.1.13.5. Strategy Overview 17.1.13.5.1. Marketing Strategy 17.1.13.5.2. Product Strategy 17.1.13.5.3. Channel Strategy 17.1.14. Hologic, Inc. 17.1.14.1. Overview 17.1.14.2. Product Portfolio 17.1.14.3. Profitability by Market Segments 17.1.14.4. Sales Footprint 17.1.14.5. Strategy Overview 17.1.14.5.1. Marketing Strategy 17.1.14.5.2. Product Strategy 17.1.14.5.3. Channel Strategy 17.1.15. Shimadzu Corporation 17.1.15.1. Overview 17.1.15.2. Product Portfolio 17.1.15.3. Profitability by Market Segments 17.1.15.4. Sales Footprint 17.1.15.5. Strategy Overview 17.1.15.5.1. Marketing Strategy 17.1.15.5.2. Product Strategy 17.1.15.5.3. Channel Strategy 17.1.16. Adani Group 17.1.16.1. Overview 17.1.16.2. Product Portfolio 17.1.16.3. Profitability by Market Segments 17.1.16.4. Sales Footprint 17.1.16.5. Strategy Overview 17.1.16.5.1. Marketing Strategy 17.1.16.5.2. Product Strategy 17.1.16.5.3. Channel Strategy 17.1.17. Xoran Technologies, LLC. 17.1.17.1. Overview 17.1.17.2. Product Portfolio 17.1.17.3. Profitability by Market Segments 17.1.17.4. Sales Footprint 17.1.17.5. Strategy Overview 17.1.17.5.1. Marketing Strategy 17.1.17.5.2. Product Strategy 17.1.17.5.3. Channel Strategy 17.1.18. Samsung Medison Co., Ltd. 17.1.18.1. Overview 17.1.18.2. Product Portfolio 17.1.18.3. Profitability by Market Segments 17.1.18.4. Sales Footprint 17.1.18.5. Strategy Overview 17.1.18.5.1. Marketing Strategy 17.1.18.5.2. Product Strategy 17.1.18.5.3. Channel Strategy 17.1.19. Swissray International, Inc. 17.1.19.1. Overview 17.1.19.2. Product Portfolio 17.1.19.3. Profitability by Market Segments 17.1.19.4. Sales Footprint 17.1.19.5. Strategy Overview 17.1.19.5.1. Marketing Strategy 17.1.19.5.2. Product Strategy 17.1.19.5.3. Channel Strategy 18. Assumptions & Acronyms Used 19. Research Methodology
Don't pay for what you don't need
Customize your report by selecting specific countries or regions and save 30%!
Table 1: Global Market Value (US$ Million) Forecast by Region, 2017 to 2032 Table 2: Global Market Volume (Units) Forecast by Region, 2017 to 2032 Table 3: Global Market Value (US$ Million) Forecast by Product Type, 2017 to 2032 Table 4: Global Market Volume (Units) Forecast by Product Type, 2017 to 2032 Table 5: Global Market Value (US$ Million) Forecast by Modality, 2017 to 2032 Table 6: Global Market Volume (Units) Forecast by Modality, 2017 to 2032 Table 7: Global Market Value (US$ Million) Forecast by End User, 2017 to 2032 Table 8: Global Market Volume (Units) Forecast by End User, 2017 to 2032 Table 9: North America Market Value (US$ Million) Forecast by Country, 2017 to 2032 Table 10: North America Market Volume (Units) Forecast by Country, 2017 to 2032 Table 11: North America Market Value (US$ Million) Forecast by Product Type, 2017 to 2032 Table 12: North America Market Volume (Units) Forecast by Product Type, 2017 to 2032 Table 13: North America Market Value (US$ Million) Forecast by Modality, 2017 to 2032 Table 14: North America Market Volume (Units) Forecast by Modality, 2017 to 2032 Table 15: North America Market Value (US$ Million) Forecast by End User, 2017 to 2032 Table 16: North America Market Volume (Units) Forecast by End User, 2017 to 2032 Table 17: Latin America Market Value (US$ Million) Forecast by Country, 2017 to 2032 Table 18: Latin America Market Volume (Units) Forecast by Country, 2017 to 2032 Table 19: Latin America Market Value (US$ Million) Forecast by Product Type, 2017 to 2032 Table 20: Latin America Market Volume (Units) Forecast by Product Type, 2017 to 2032 Table 21: Latin America Market Value (US$ Million) Forecast by Modality, 2017 to 2032 Table 22: Latin America Market Volume (Units) Forecast by Modality, 2017 to 2032 Table 23: Latin America Market Value (US$ Million) Forecast by End User, 2017 to 2032 Table 24: Latin America Market Volume (Units) Forecast by End User, 2017 to 2032 Table 25: Europe Market Value (US$ Million) Forecast by Country, 2017 to 2032 Table 26: Europe Market Volume (Units) Forecast by Country, 2017 to 2032 Table 27: Europe Market Value (US$ Million) Forecast by Product Type, 2017 to 2032 Table 28: Europe Market Volume (Units) Forecast by Product Type, 2017 to 2032 Table 29: Europe Market Value (US$ Million) Forecast by Modality, 2017 to 2032 Table 30: Europe Market Volume (Units) Forecast by Modality, 2017 to 2032 Table 31: Europe Market Value (US$ Million) Forecast by End User, 2017 to 2032 Table 32: Europe Market Volume (Units) Forecast by End User, 2017 to 2032 Table 33: East Asia Market Value (US$ Million) Forecast by Country, 2017 to 2032 Table 34: East Asia Market Volume (Units) Forecast by Country, 2017 to 2032 Table 35: East Asia Market Value (US$ Million) Forecast by Product Type, 2017 to 2032 Table 36: East Asia Market Volume (Units) Forecast by Product Type, 2017 to 2032 Table 37: East Asia Market Value (US$ Million) Forecast by Modality, 2017 to 2032 Table 38: East Asia Market Volume (Units) Forecast by Modality, 2017 to 2032 Table 39: East Asia Market Value (US$ Million) Forecast by End User, 2017 to 2032 Table 40: East Asia Market Volume (Units) Forecast by End User, 2017 to 2032 Table 41: South Asia & Pacific Market Value (US$ Million) Forecast by Country, 2017 to 2032 Table 42: South Asia & Pacific Market Volume (Units) Forecast by Country, 2017 to 2032 Table 43: South Asia & Pacific Market Value (US$ Million) Forecast by Product Type, 2017 to 2032 Table 44: South Asia & Pacific Market Volume (Units) Forecast by Product Type, 2017 to 2032 Table 45: South Asia & Pacific Market Value (US$ Million) Forecast by Modality, 2017 to 2032 Table 46: South Asia & Pacific Market Volume (Units) Forecast by Modality, 2017 to 2032 Table 47: South Asia & Pacific Market Value (US$ Million) Forecast by End User, 2017 to 2032 Table 48: South Asia & Pacific Market Volume (Units) Forecast by End User, 2017 to 2032 Table 49: MEA Market Value (US$ Million) Forecast by Country, 2017 to 2032 Table 50: MEA Market Volume (Units) Forecast by Country, 2017 to 2032 Table 51: MEA Market Value (US$ Million) Forecast by Product Type, 2017 to 2032 Table 52: MEA Market Volume (Units) Forecast by Product Type, 2017 to 2032 Table 53: MEA Market Value (US$ Million) Forecast by Modality, 2017 to 2032 Table 54: MEA Market Volume (Units) Forecast by Modality, 2017 to 2032 Table 55: MEA Market Value (US$ Million) Forecast by End User, 2017 to 2032 Table 56: MEA Market Volume (Units) Forecast by End User, 2017 to 2032
Figure 1: Global Market Value (US$ Million) by Product Type, 2022 to 2032 Figure 2: Global Market Value (US$ Million) by Modality, 2022 to 2032 Figure 3: Global Market Value (US$ Million) by End User, 2022 to 2032 Figure 4: Global Market Value (US$ Million) by Region, 2022 to 2032 Figure 5: Global Market Value (US$ Million) Analysis by Region, 2017 to 2032 Figure 6: Global Market Volume (Units) Analysis by Region, 2017 to 2032 Figure 7: Global Market Value Share (%) and BPS Analysis by Region, 2022 to 2032 Figure 8: Global Market Y-o-Y Growth (%) Projections by Region, 2022 to 2032 Figure 9: Global Market Value (US$ Million) Analysis by Product Type, 2017 to 2032 Figure 10: Global Market Volume (Units) Analysis by Product Type, 2017 to 2032 Figure 11: Global Market Value Share (%) and BPS Analysis by Product Type, 2022 to 2032 Figure 12: Global Market Y-o-Y Growth (%) Projections by Product Type, 2022 to 2032 Figure 13: Global Market Value (US$ Million) Analysis by Modality, 2017 to 2032 Figure 14: Global Market Volume (Units) Analysis by Modality, 2017 to 2032 Figure 15: Global Market Value Share (%) and BPS Analysis by Modality, 2022 to 2032 Figure 16: Global Market Y-o-Y Growth (%) Projections by Modality, 2022 to 2032 Figure 17: Global Market Value (US$ Million) Analysis by End User, 2017 to 2032 Figure 18: Global Market Volume (Units) Analysis by End User, 2017 to 2032 Figure 19: Global Market Value Share (%) and BPS Analysis by End User, 2022 to 2032 Figure 20: Global Market Y-o-Y Growth (%) Projections by End User, 2022 to 2032 Figure 21: Global Market Attractiveness by Product Type, 2022 to 2032 Figure 22: Global Market Attractiveness by Modality, 2022 to 2032 Figure 23: Global Market Attractiveness by End User, 2022 to 2032 Figure 24: Global Market Attractiveness by Region, 2022 to 2032 Figure 25: North America Market Value (US$ Million) by Product Type, 2022 to 2032 Figure 26: North America Market Value (US$ Million) by Modality, 2022 to 2032 Figure 27: North America Market Value (US$ Million) by End User, 2022 to 2032 Figure 28: North America Market Value (US$ Million) by Country, 2022 to 2032 Figure 29: North America Market Value (US$ Million) Analysis by Country, 2017 to 2032 Figure 30: North America Market Volume (Units) Analysis by Country, 2017 to 2032 Figure 31: North America Market Value Share (%) and BPS Analysis by Country, 2022 to 2032 Figure 32: North America Market Y-o-Y Growth (%) Projections by Country, 2022 to 2032 Figure 33: North America Market Value (US$ Million) Analysis by Product Type, 2017 to 2032 Figure 34: North America Market Volume (Units) Analysis by Product Type, 2017 to 2032 Figure 35: North America Market Value Share (%) and BPS Analysis by Product Type, 2022 to 2032 Figure 36: North America Market Y-o-Y Growth (%) Projections by Product Type, 2022 to 2032 Figure 37: North America Market Value (US$ Million) Analysis by Modality, 2017 to 2032 Figure 38: North America Market Volume (Units) Analysis by Modality, 2017 to 2032 Figure 39: North America Market Value Share (%) and BPS Analysis by Modality, 2022 to 2032 Figure 40: North America Market Y-o-Y Growth (%) Projections by Modality, 2022 to 2032 Figure 41: North America Market Value (US$ Million) Analysis by End User, 2017 to 2032 Figure 42: North America Market Volume (Units) Analysis by End User, 2017 to 2032 Figure 43: North America Market Value Share (%) and BPS Analysis by End User, 2022 to 2032 Figure 44: North America Market Y-o-Y Growth (%) Projections by End User, 2022 to 2032 Figure 45: North America Market Attractiveness by Product Type, 2022 to 2032 Figure 46: North America Market Attractiveness by Modality, 2022 to 2032 Figure 47: North America Market Attractiveness by End User, 2022 to 2032 Figure 48: North America Market Attractiveness by Country, 2022 to 2032 Figure 49: Latin America Market Value (US$ Million) by Product Type, 2022 to 2032 Figure 50: Latin America Market Value (US$ Million) by Modality, 2022 to 2032 Figure 51: Latin America Market Value (US$ Million) by End User, 2022 to 2032 Figure 52: Latin America Market Value (US$ Million) by Country, 2022 to 2032 Figure 53: Latin America Market Value (US$ Million) Analysis by Country, 2017 to 2032 Figure 54: Latin America Market Volume (Units) Analysis by Country, 2017 to 2032 Figure 55: Latin America Market Value Share (%) and BPS Analysis by Country, 2022 to 2032 Figure 56: Latin America Market Y-o-Y Growth (%) Projections by Country, 2022 to 2032 Figure 57: Latin America Market Value (US$ Million) Analysis by Product Type, 2017 to 2032 Figure 58: Latin America Market Volume (Units) Analysis by Product Type, 2017 to 2032 Figure 59: Latin America Market Value Share (%) and BPS Analysis by Product Type, 2022 to 2032 Figure 60: Latin America Market Y-o-Y Growth (%) Projections by Product Type, 2022 to 2032 Figure 61: Latin America Market Value (US$ Million) Analysis by Modality, 2017 to 2032 Figure 62: Latin America Market Volume (Units) Analysis by Modality, 2017 to 2032 Figure 63: Latin America Market Value Share (%) and BPS Analysis by Modality, 2022 to 2032 Figure 64: Latin America Market Y-o-Y Growth (%) Projections by Modality, 2022 to 2032 Figure 65: Latin America Market Value (US$ Million) Analysis by End User, 2017 to 2032 Figure 66: Latin America Market Volume (Units) Analysis by End User, 2017 to 2032 Figure 67: Latin America Market Value Share (%) and BPS Analysis by End User, 2022 to 2032 Figure 68: Latin America Market Y-o-Y Growth (%) Projections by End User, 2022 to 2032 Figure 69: Latin America Market Attractiveness by Product Type, 2022 to 2032 Figure 70: Latin America Market Attractiveness by Modality, 2022 to 2032 Figure 71: Latin America Market Attractiveness by End User, 2022 to 2032 Figure 72: Latin America Market Attractiveness by Country, 2022 to 2032 Figure 73: Europe Market Value (US$ Million) by Product Type, 2022 to 2032 Figure 74: Europe Market Value (US$ Million) by Modality, 2022 to 2032 Figure 75: Europe Market Value (US$ Million) by End User, 2022 to 2032 Figure 76: Europe Market Value (US$ Million) by Country, 2022 to 2032 Figure 77: Europe Market Value (US$ Million) Analysis by Country, 2017 to 2032 Figure 78: Europe Market Volume (Units) Analysis by Country, 2017 to 2032 Figure 79: Europe Market Value Share (%) and BPS Analysis by Country, 2022 to 2032 Figure 80: Europe Market Y-o-Y Growth (%) Projections by Country, 2022 to 2032 Figure 81: Europe Market Value (US$ Million) Analysis by Product Type, 2017 to 2032 Figure 82: Europe Market Volume (Units) Analysis by Product Type, 2017 to 2032 Figure 83: Europe Market Value Share (%) and BPS Analysis by Product Type, 2022 to 2032 Figure 84: Europe Market Y-o-Y Growth (%) Projections by Product Type, 2022 to 2032 Figure 85: Europe Market Value (US$ Million) Analysis by Modality, 2017 to 2032 Figure 86: Europe Market Volume (Units) Analysis by Modality, 2017 to 2032 Figure 87: Europe Market Value Share (%) and BPS Analysis by Modality, 2022 to 2032 Figure 88: Europe Market Y-o-Y Growth (%) Projections by Modality, 2022 to 2032 Figure 89: Europe Market Value (US$ Million) Analysis by End User, 2017 to 2032 Figure 90: Europe Market Volume (Units) Analysis by End User, 2017 to 2032 Figure 91: Europe Market Value Share (%) and BPS Analysis by End User, 2022 to 2032 Figure 92: Europe Market Y-o-Y Growth (%) Projections by End User, 2022 to 2032 Figure 93: Europe Market Attractiveness by Product Type, 2022 to 2032 Figure 94: Europe Market Attractiveness by Modality, 2022 to 2032 Figure 95: Europe Market Attractiveness by End User, 2022 to 2032 Figure 96: Europe Market Attractiveness by Country, 2022 to 2032 Figure 97: East Asia Market Value (US$ Million) by Product Type, 2022 to 2032 Figure 98: East Asia Market Value (US$ Million) by Modality, 2022 to 2032 Figure 99: East Asia Market Value (US$ Million) by End User, 2022 to 2032 Figure 100: East Asia Market Value (US$ Million) by Country, 2022 to 2032 Figure 101: East Asia Market Value (US$ Million) Analysis by Country, 2017 to 2032 Figure 102: East Asia Market Volume (Units) Analysis by Country, 2017 to 2032 Figure 103: East Asia Market Value Share (%) and BPS Analysis by Country, 2022 to 2032 Figure 104: East Asia Market Y-o-Y Growth (%) Projections by Country, 2022 to 2032 Figure 105: East Asia Market Value (US$ Million) Analysis by Product Type, 2017 to 2032 Figure 106: East Asia Market Volume (Units) Analysis by Product Type, 2017 to 2032 Figure 107: East Asia Market Value Share (%) and BPS Analysis by Product Type, 2022 to 2032 Figure 108: East Asia Market Y-o-Y Growth (%) Projections by Product Type, 2022 to 2032 Figure 109: East Asia Market Value (US$ Million) Analysis by Modality, 2017 to 2032 Figure 110: East Asia Market Volume (Units) Analysis by Modality, 2017 to 2032 Figure 111: East Asia Market Value Share (%) and BPS Analysis by Modality, 2022 to 2032 Figure 112: East Asia Market Y-o-Y Growth (%) Projections by Modality, 2022 to 2032 Figure 113: East Asia Market Value (US$ Million) Analysis by End User, 2017 to 2032 Figure 114: East Asia Market Volume (Units) Analysis by End User, 2017 to 2032 Figure 115: East Asia Market Value Share (%) and BPS Analysis by End User, 2022 to 2032 Figure 116: East Asia Market Y-o-Y Growth (%) Projections by End User, 2022 to 2032 Figure 117: East Asia Market Attractiveness by Product Type, 2022 to 2032 Figure 118: East Asia Market Attractiveness by Modality, 2022 to 2032 Figure 119: East Asia Market Attractiveness by End User, 2022 to 2032 Figure 120: East Asia Market Attractiveness by Country, 2022 to 2032 Figure 121: South Asia & Pacific Market Value (US$ Million) by Product Type, 2022 to 2032 Figure 122: South Asia & Pacific Market Value (US$ Million) by Modality, 2022 to 2032 Figure 123: South Asia & Pacific Market Value (US$ Million) by End User, 2022 to 2032 Figure 124: South Asia & Pacific Market Value (US$ Million) by Country, 2022 to 2032 Figure 125: South Asia & Pacific Market Value (US$ Million) Analysis by Country, 2017 to 2032 Figure 126: South Asia & Pacific Market Volume (Units) Analysis by Country, 2017 to 2032 Figure 127: South Asia & Pacific Market Value Share (%) and BPS Analysis by Country, 2022 to 2032 Figure 128: South Asia & Pacific Market Y-o-Y Growth (%) Projections by Country, 2022 to 2032 Figure 129: South Asia & Pacific Market Value (US$ Million) Analysis by Product Type, 2017 to 2032 Figure 130: South Asia & Pacific Market Volume (Units) Analysis by Product Type, 2017 to 2032 Figure 131: South Asia & Pacific Market Value Share (%) and BPS Analysis by Product Type, 2022 to 2032 Figure 132: South Asia & Pacific Market Y-o-Y Growth (%) Projections by Product Type, 2022 to 2032 Figure 133: South Asia & Pacific Market Value (US$ Million) Analysis by Modality, 2017 to 2032 Figure 134: South Asia & Pacific Market Volume (Units) Analysis by Modality, 2017 to 2032 Figure 135: South Asia & Pacific Market Value Share (%) and BPS Analysis by Modality, 2022 to 2032 Figure 136: South Asia & Pacific Market Y-o-Y Growth (%) Projections by Modality, 2022 to 2032 Figure 137: South Asia & Pacific Market Value (US$ Million) Analysis by End User, 2017 to 2032 Figure 138: South Asia & Pacific Market Volume (Units) Analysis by End User, 2017 to 2032 Figure 139: South Asia & Pacific Market Value Share (%) and BPS Analysis by End User, 2022 to 2032 Figure 140: South Asia & Pacific Market Y-o-Y Growth (%) Projections by End User, 2022 to 2032 Figure 141: South Asia & Pacific Market Attractiveness by Product Type, 2022 to 2032 Figure 142: South Asia & Pacific Market Attractiveness by Modality, 2022 to 2032 Figure 143: South Asia & Pacific Market Attractiveness by End User, 2022 to 2032 Figure 144: South Asia & Pacific Market Attractiveness by Country, 2022 to 2032 Figure 145: MEA Market Value (US$ Million) by Product Type, 2022 to 2032 Figure 146: MEA Market Value (US$ Million) by Modality, 2022 to 2032 Figure 147: MEA Market Value (US$ Million) by End User, 2022 to 2032 Figure 148: MEA Market Value (US$ Million) by Country, 2022 to 2032 Figure 149: MEA Market Value (US$ Million) Analysis by Country, 2017 to 2032 Figure 150: MEA Market Volume (Units) Analysis by Country, 2017 to 2032 Figure 151: MEA Market Value Share (%) and BPS Analysis by Country, 2022 to 2032 Figure 152: MEA Market Y-o-Y Growth (%) Projections by Country, 2022 to 2032 Figure 153: MEA Market Value (US$ Million) Analysis by Product Type, 2017 to 2032 Figure 154: MEA Market Volume (Units) Analysis by Product Type, 2017 to 2032 Figure 155: MEA Market Value Share (%) and BPS Analysis by Product Type, 2022 to 2032 Figure 156: MEA Market Y-o-Y Growth (%) Projections by Product Type, 2022 to 2032 Figure 157: MEA Market Value (US$ Million) Analysis by Modality, 2017 to 2032 Figure 158: MEA Market Volume (Units) Analysis by Modality, 2017 to 2032 Figure 159: MEA Market Value Share (%) and BPS Analysis by Modality, 2022 to 2032 Figure 160: MEA Market Y-o-Y Growth (%) Projections by Modality, 2022 to 2032 Figure 161: MEA Market Value (US$ Million) Analysis by End User, 2017 to 2032 Figure 162: MEA Market Volume (Units) Analysis by End User, 2017 to 2032 Figure 163: MEA Market Value Share (%) and BPS Analysis by End User, 2022 to 2032 Figure 164: MEA Market Y-o-Y Growth (%) Projections by End User, 2022 to 2032 Figure 165: MEA Market Attractiveness by Product Type, 2022 to 2032 Figure 166: MEA Market Attractiveness by Modality, 2022 to 2032 Figure 167: MEA Market Attractiveness by End User, 2022 to 2032 Figure 168: MEA Market Attractiveness by Country, 2022 to 2032
Recommendations
Explore Healthcare Insights
View Reports