Digital Hall Effect Gaussmeter Market Forecast and Outlook (2025-2035)

The global digital hall effect gaussmeter market is projected to grow from USD 49.7 million in 2025 to approximately USD 77.2 million by 2035, recording an absolute increase of USD 27.5 million over the forecast period. This translates into a total growth of 55.3%, with the market forecast to expand at a compound annual growth rate (CAGR) of 4.5% between 2025 and 2035. The overall market size is expected to grow by nearly 1.6X during the same period, supported by increasing magnetic field measurement requirements across industrial quality control operations, growing demand for precision measurement instruments in research laboratories, and rising electromagnetic compatibility testing needs driving specialized measurement equipment procurement across various scientific and industrial applications.

Industrial quality control expansion in manufacturing facilities continues to drive gaussmeter demand, particularly in sectors requiring magnetic field verification for electric motors, magnetic assemblies, and electromagnetic devices. The advancement of electric vehicle technologies and renewable energy systems are reshaping measurement requirements, with manufacturers prioritizing instruments that deliver accurate field strength measurements while supporting production efficiency standards.
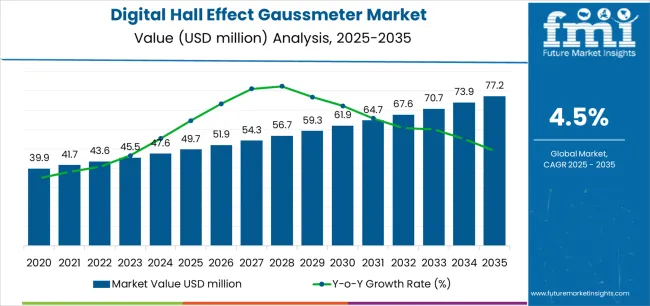
Quick Stats for Digital Hall Effect Gaussmeter Market

  • Digital Hall Effect Gaussmeter Market Value (2025): USD 49.7 million
  • Digital Hall Effect Gaussmeter Market Forecast Value (2035): USD 77.2 million
  • Digital Hall Effect Gaussmeter Market CAGR: 4.5%
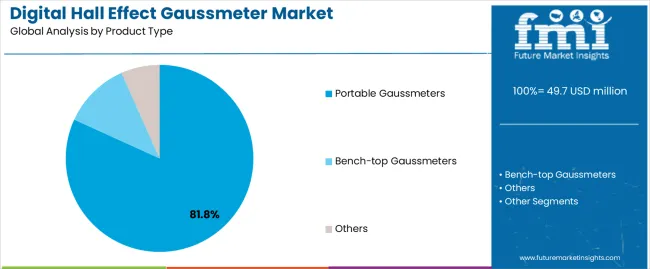
  • Leading Segment by Product Type (2025): Portable Gaussmeters (81.8%)
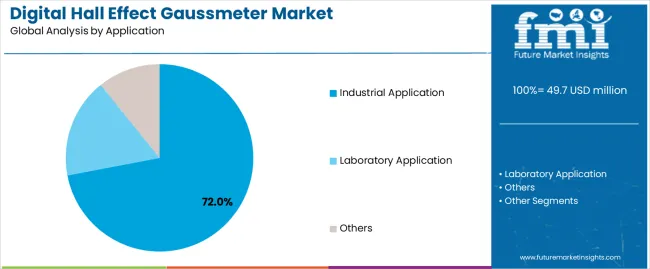
  • Leading Segment by Application (2025): Industrial Application (72%)
  • Key Growth Regions: Asia Pacific, Europe, and North America
  • Top Companies by Market Share: Coliy Group, Lake Shore Cryotronics, PCE Instruments

Digital Hall Effect Gaussmeter Market Market Value Analysis

Laboratory research programs across materials science, physics, and electronics development are creating sustained demand for bench-top gaussmeters that provide superior resolution and comprehensive measurement capabilities. Asia Pacific markets demonstrate particularly strong growth potential, supported by expanding electronics manufacturing operations and increasing research infrastructure investments that necessitate precise magnetic field characterization capabilities for quality assurance and product development applications.

Digital Hall Effect Gaussmeter Market Key Takeaways

Metric Value
Market Value (2025) USD 49.7 million
Market Forecast Value (2035) USD 77.2 million
Forecast CAGR (2025-2035) 4.5%

Why is the Digital Hall Effect Gaussmeter Market Growing?

INDUSTRIAL QUALITY CONTROL TRENDS RESEARCH & DEVELOPMENT REQUIREMENTS TECHNOLOGY & REGULATORY STANDARDS
  • Manufacturing Quality Verification: Continuous expansion of quality control protocols across magnetic component manufacturing, electric motor production, and electromagnetic device fabrication driving demand for measurement instruments.
  • Electric Vehicle Technology Growth: Growing emphasis on electric motor testing and battery system magnetic field verification creating demand for portable measurement solutions.
  • Production Efficiency Enhancement: Superior measurement accuracy and operational reliability making digital gaussmeters essential for quality assurance applications.
  • Sophisticated Measurement Requirements: Modern research operations require instruments delivering precise magnetic field characterization and enhanced measurement resolution.
  • Materials Science Demands: Research laboratories investing in bench-top instruments offering comprehensive measurement capabilities while maintaining calibration stability.
  • Quality and Accuracy Standards: Certified instruments with proven measurement performance required for advanced scientific research applications.
  • Electromagnetic Compatibility Standards: Regulatory requirements establishing measurement benchmarks favoring calibrated instruments and traceable measurement systems.
  • Measurement Precision Standards: Quality standards requiring superior resolution and resistance to environmental influences in measurement applications.
  • Safety Compliance Requirements: Diverse industrial requirements and quality standards driving need for sophisticated magnetic field measurement capabilities.

What Is the Market Segmentation for Digital Hall Effect Gaussmeter Market?

Category Segments Covered
By Product Type Portable Gaussmeters, Bench-top Gaussmeters, Others
By Application Industrial Application, Laboratory Application, Others
By Region North America, Europe, Asia Pacific, Latin America, Middle East & Africa

Digital Hall Effect Gaussmeter Market Analysis by Product Type

Digital Hall Effect Gaussmeter Market Analysis By Product Type

Segment 2025 to 2035 Outlook
Portable Gaussmeters
  • Dominant segment with 81.8% market share in 2025 projected to maintain leadership through 2035. Preferred for production floor quality control, field service applications, and on-site magnetic field verification requiring mobility and ease of operation. Lower cost compared to bench-top systems, battery operation enabling field deployment, and adequate measurement range for industrial applications drive adoption. Integration with data logging capabilities and wireless connectivity supporting modern quality management systems.
  • Momentum: steady growth driven by industrial quality control expansion and electric vehicle manufacturing.
  • Watchouts: measurement resolution limitations compared to laboratory instruments, environmental sensitivity affecting accuracy in harsh industrial conditions.
Bench-top Gaussmeters
  • Holds 18.2% market share with applications concentrated in research laboratories, calibration facilities, and advanced materials characterization. Superior measurement resolution, enhanced stability, and comprehensive data analysis capabilities provide advantages in scientific research environments. Increasing adoption in university research programs, government laboratories, and corporate R&D facilities requiring precise magnetic property characterization. Temperature-controlled environments supporting optimal measurement performance.
  • Momentum: moderate growth driven by research infrastructure investment and materials science advancement.
  • Watchouts: higher capital costs limiting adoption in cost-sensitive applications, stationary operation restricting field deployment, specialized technical expertise required for optimal utilization.
Others
  • Niche segment including specialized probe configurations, multi-axis measurement systems, and application-specific instruments. Custom solutions for unique measurement challenges including cryogenic environments, high-field applications, and automated production testing integration. Small volume but premium pricing reflecting specialized capabilities.
  • Momentum: selective growth in advanced research applications and specialized industrial requirements. Application-specific development costs and limited standardization constraining broader market expansion.

Digital Hall Effect Gaussmeter Market Analysis by Application

Digital Hall Effect Gaussmeter Market Analysis By Application

Segment 2025 to 2035 Outlook
Industrial Application
  • At 72%, largest application segment in 2025 with established integration across magnetic component manufacturing, electric motor production, and quality control operations. Production line testing, incoming inspection, and process verification requiring reliable magnetic field measurement. Established procurement patterns, standardized measurement procedures, proven reliability specifications.
  • Momentum: strong growth driven by electric vehicle manufacturing expansion, renewable energy equipment production, and industrial automation advancement. Quality control digitalization supporting adoption of connected measurement instruments.
  • Watchouts: cost pressure from high-volume manufacturing environments, measurement speed requirements affecting instrument selection, competitive alternatives including automated inspection systems.
Laboratory Application
  • Substantial segment focused on materials research, physics experiments, and magnetic property characterization. Stringent accuracy requirements, comprehensive measurement capabilities, and calibration traceability standards. Research funding supporting investment in premium instrumentation for advanced characterization. Small volume relative to industrial applications but higher average selling prices reflecting superior specifications.
  • Momentum: steady growth driven by materials science research advancement, nanotechnology development, and government research funding. Academic institution procurement and corporate R&D investment supporting demand.
  • Watchouts: budget constraints affecting capital equipment purchases, lengthy procurement cycles in academic institutions, competition from alternative characterization techniques.
Others
  • Diverse applications including electromagnetic compatibility testing, medical device development, geological surveys, and educational demonstrations. Varied measurement requirements, specialized calibration needs, and application-specific operational protocols.
  • Momentum: selective growth in emerging applications including wireless charging system development, magnetic resonance equipment servicing, and aerospace component testing. Application diversity creating opportunities for specialized instrument configurations but limiting volume concentration and standardization benefits.

What Are the Key Trends, Drivers, and Restraints Affecting the Demand for Digital Hall Effect Gaussmeter Market?

DRIVERS RESTRAINTS KEY TRENDS
  • Electric Vehicle Manufacturing Growth: Continuing expansion of electric motor production and battery system manufacturing driving demand for magnetic field measurement instruments.
  • Quality Control Automation: Increasing integration of automated measurement systems importance in production line efficiency and data collection.
  • Research Infrastructure Investment: Growing demand for instruments that support both materials characterization and electromagnetic property verification in laboratory environments.
  • Instrument Cost Considerations: Precision measurement equipment requiring significant capital investment affecting adoption in cost-sensitive applications.
  • Calibration Maintenance Requirements: Periodic calibration necessitating specialized services and measurement uncertainty management creating operational complexity.
  • Technical Expertise Needs: Proper instrument operation and measurement interpretation requiring trained personnel affecting deployment in smaller facilities.
  • Alternative Measurement Technologies: Competition from alternative magnetic field measurement approaches including fluxgate magnetometers and optical methods.
  • Digital Connectivity Integration: Integration of wireless data transmission, cloud storage capabilities, and remote monitoring enabling comprehensive quality management system integration.
  • Multi-Axis Measurement Systems: Enhanced three-dimensional field mapping capabilities and automated measurement routines providing superior characterization compared to single-axis instruments.
  • Miniaturization Advancement: Development of compact probe designs and reduced instrument dimensions enabling measurement access in confined spaces and integrated production equipment.
  • Software Enhancement Features: Advanced data analysis algorithms, statistical process control integration, and customizable measurement routines supporting diverse application requirements.

How Does the Demand for Digital Hall Effect Gaussmeter Market Vary Across Countries?

Digital Hall Effect Gaussmeter Market Cagr Analysis By Country

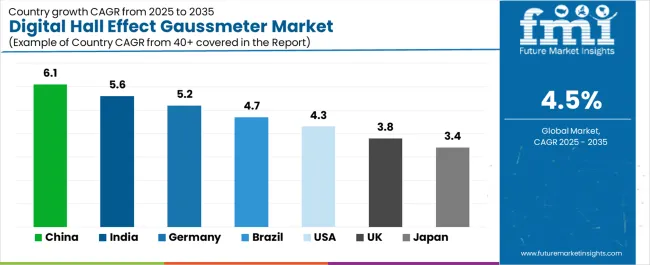
Country CAGR (2025-2035)
China 6.1%
India 5.6%
Germany 5.2%
Brazil 4.7%
United States 4.3%
United Kingdom 3.8%
Japan 3.4%

How Does the Demand for Digital Hall Effect Gaussmeter Market Perform in China?

Digital Hall Effect Gaussmeter Market Country Value Analysis

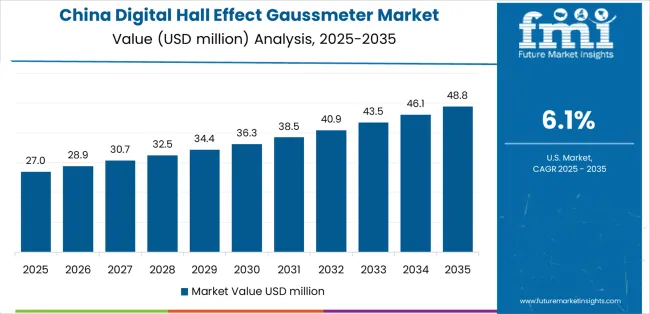
Revenue from digital hall effect gaussmeters in China is projected to exhibit strong growth, expanding at a CAGR of 6.1% to reach significant market value by 2035, driven by expanding electronics manufacturing infrastructure and comprehensive electric motor production capacity creating substantial opportunities for measurement instrument suppliers across magnetic component manufacturing operations, electric vehicle motor testing facilities, and quality control laboratories.

The country's established electronics manufacturing ecosystem and expanding new energy vehicle production capabilities are creating significant demand for both portable and bench-top gaussmeter solutions. Major motor manufacturers and magnetic component producers are establishing comprehensive quality control facilities to support large-scale production operations and meet growing demand for magnetic field verification instruments.

  • Electric motor manufacturing expansion and magnetic component production growth are supporting widespread adoption of portable gaussmeters across quality control operations, driving demand for cost-effective measurement instruments
  • New energy vehicle development programs and renewable energy equipment manufacturing are creating substantial opportunities for instrument suppliers requiring competitive pricing and reliable measurement performance
  • Research infrastructure development and materials science laboratory expansion are facilitating adoption of bench-top gaussmeter systems throughout major industrial and academic regions

What Are the Trends in the Demand for Digital Hall Effect Gaussmeter Market in India?

Revenue from digital hall effect gaussmeters in India is expanding at a CAGR of 5.6% to reach substantial levels by 2035, supported by extensive manufacturing sector development and comprehensive research infrastructure expansion creating sustained demand for magnetic field measurement instruments across diverse industrial categories and laboratory applications. The country's growing electronics manufacturing capabilities and expanding technical education infrastructure are driving demand for gaussmeter solutions that provide reliable measurement performance while supporting cost-effective quality control requirements. International instrument suppliers and domestic distributors are investing in technical service capabilities to support application development and measurement optimization initiatives.

  • Electronics manufacturing growth and electric motor production expansion are creating opportunities for portable gaussmeters across diverse applications requiring reliable field measurement and competitive costs
  • Government research initiatives and academic laboratory development programs are driving investments in measurement instrumentation supporting characterization requirements throughout major educational and industrial regions
  • Quality control infrastructure development and manufacturing capability enhancement programs are enhancing demand for magnetic field measurement instruments throughout industrial centers

How Is the Demand for Digital Hall Effect Gaussmeter Market Evolving in Germany?

Demand for digital hall effect gaussmeters in Germany is projected to grow at a CAGR of 5.2% to reach substantial levels by 2035, supported by the country's leadership in industrial automation and advanced manufacturing technologies requiring sophisticated measurement instruments for electric motor production, automotive component testing, and precision magnetic assembly verification. German manufacturing facilities are implementing high-precision gaussmeter systems that support stringent quality protocols, operational excellence, and comprehensive measurement documentation. The market is characterized by focus on measurement accuracy, calibration traceability, and compliance with stringent industrial quality standards.

  • Automotive manufacturing investments and electric vehicle component production are prioritizing advanced measurement technologies that demonstrate superior accuracy and reliability while meeting German quality and calibration standards
  • Industrial automation excellence programs and quality control optimization initiatives are driving adoption of precision-calibrated gaussmeters that support advanced manufacturing systems and process verification
  • Research and development programs for materials characterization are facilitating adoption of specialized bench-top measurement systems throughout major industrial and academic centers

What Is the Outlook for Digital Hall Effect Gaussmeter Market in Brazil?

Demand for digital hall effect gaussmeters in Brazil is projected to expand at a CAGR of 4.7% to reach meaningful levels by 2035, driven by industrial manufacturing development and electric motor production expansion supporting quality control infrastructure and measurement capability applications. The country's developing manufacturing sector and growing technical service capabilities are creating demand for gaussmeter solutions that support operational requirements and quality standards. Instrument suppliers and technical distributors are maintaining service capabilities to support diverse measurement requirements and application optimization initiatives.
  • Electric motor manufacturing operations and industrial equipment production programs are supporting demand for portable gaussmeters that meet contemporary measurement and reliability standards
  • Quality control development initiatives and manufacturing technology advancement programs are creating opportunities for measurement instruments that provide operational support and data collection capabilities
  • Industrial facility modernization and equipment quality enhancement programs are facilitating adoption of magnetic field measurement capabilities throughout major manufacturing regions

How Does the Demand for Digital Hall Effect Gaussmeter Market Vary in the United States?

Revenue from digital hall effect gaussmeters in United States is growing at a CAGR of 4.3% to reach substantial levels by 2035, driven by research laboratory infrastructure and advanced manufacturing development creating sustained opportunities for measurement instrument suppliers serving both academic research institutions and industrial quality control operations. The country's extensive research capabilities and established manufacturing technology base are creating demand for gaussmeter solutions that support stringent measurement requirements while maintaining calibration standards. Instrument manufacturers and technical distributors are developing comprehensive application support capabilities to address research specifications and industrial measurement demands.

  • Materials science research programs and physics laboratory operations are facilitating adoption of bench-top gaussmeters capable of supporting precise measurement requirements and comprehensive characterization protocols
  • Electric vehicle component manufacturing and renewable energy equipment production are enhancing demand for portable measurement instruments that support quality control efficiency and production verification objectives
  • Advanced manufacturing initiatives and domestic production expansion are creating opportunities for measurement instrument suppliers with comprehensive technical support and calibration service capabilities across American industrial facilities

How Is the Demand for Digital Hall Effect Gaussmeter Market Performing in the United Kingdom?

Demand for digital hall effect gaussmeters in United Kingdom is projected to grow at a CAGR of 3.8% by 2035, supported by academic research programs and specialized manufacturing operations creating opportunities for measurement instrument suppliers across university laboratories and industrial testing facilities. The country's established research institutions and developing advanced manufacturing capabilities are driving demand for gaussmeter solutions that support measurement accuracy while meeting calibration requirements. Instrument suppliers and technical service providers are implementing capabilities to support research applications and quality control optimization requirements.

  • University research programs and government laboratory operations are supporting adoption of bench-top gaussmeters across facilities requiring precise measurement performance and calibration traceability
  • Manufacturing quality control initiatives and industrial testing programs are driving investments in portable measurement instruments that support operational requirements and documentation standards
  • Research infrastructure development and measurement capability enhancement programs are facilitating adoption of specialized gaussmeter systems throughout academic and industrial regions

What Are the Trends in the Demand for Digital Hall Effect Gaussmeter Market in Japan?

Demand for digital hall effect gaussmeters in Japan is projected to expand at a CAGR of 3.4% by 2035, driven by precision manufacturing excellence and research institution leadership supporting advanced measurement instrument adoption and comprehensive quality verification applications. The country's sophisticated manufacturing requirements and established research capabilities are creating demand for high-precision gaussmeter systems that support stringent operational standards and calibration protocols. Instrument manufacturers and technical specialists are maintaining comprehensive development capabilities to support diverse measurement requirements and application optimization initiatives.

  • Precision manufacturing operations and automotive component production programs are supporting demand for measurement instruments that meet exacting accuracy and reliability standards
  • Research excellence initiatives and materials characterization programs are creating opportunities for specialized bench-top instruments that provide superior measurement resolution and comprehensive data analysis
  • Manufacturing quality advancement programs and measurement technology development initiatives are facilitating adoption of advanced calibration capabilities and automated measurement systems throughout major industrial and research centers

Europe Market Split by Country

Digital Hall Effect Gaussmeter Market Europe Country Market Share Analysis, 2025 & 2035

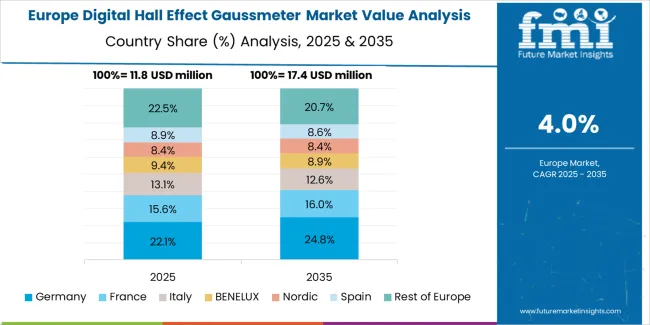
The digital hall effect gaussmeter market in Europe is projected to grow from USD 13.8 million in 2025 to USD 21.6 million by 2035, registering a CAGR of 4.6% over the forecast period. Germany is expected to maintain its leadership position with a 37.8% market share in 2025, declining slightly to 37.2% by 2035, supported by its advanced industrial manufacturing infrastructure and precision measurement capabilities serving electric motor production, automotive component testing, and research laboratory applications.

France follows with a 20.4% share in 2025, projected to reach 20.9% by 2035, driven by comprehensive aerospace manufacturing operations and research institution presence supporting magnetic field measurement requirements. The United Kingdom holds a 17.6% share in 2025, expected to maintain 17.3% by 2035 with academic research focus and specialized manufacturing presence. Italy commands a 13.1% share, while Spain accounts for 8.2% in 2025. The Rest of Europe region is anticipated to gain momentum, expanding its collective share from 2.9% to 3.7% by 2035, attributed to increasing measurement instrument adoption in Nordic research facilities and emerging Eastern European manufacturing operations implementing quality control measurement technologies.
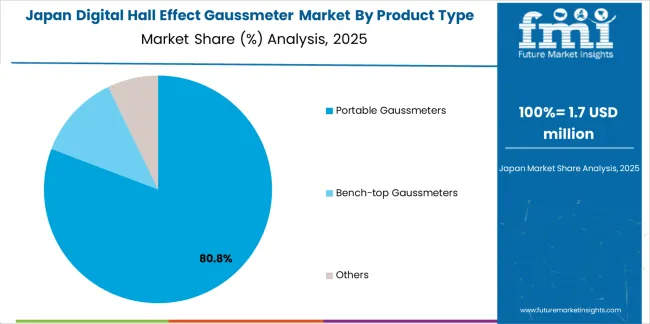
Precision Standards Define Japanese Market Excellence

Digital Hall Effect Gaussmeter Market Japan Market Share Analysis By Product Type

Japanese digital hall effect gaussmeter operations reflect the country's exacting measurement standards and sophisticated manufacturing quality requirements. Major electric motor manufacturers including Nidec, Mabuchi Motor, and precision component producers maintain rigorous instrument qualification processes emphasizing measurement accuracy, calibration stability, and comprehensive documentation protocols. This creates structured market conditions favoring established instrument manufacturers with proven measurement performance and comprehensive technical support capabilities.

The Japanese market demonstrates advanced measurement technology adoption, with significant investment in automated testing equipment and quality management systems requiring gaussmeters optimized for production integration and data connectivity. Companies require detailed instrument specifications and calibration documentation that align with Japanese industrial standards and quality excellence principles, driving demand for sophisticated technical service capabilities and measurement consulting support.

Regulatory oversight emphasizes measurement traceability and calibration documentation, with manufacturing standards requiring comprehensive instrument qualification and periodic verification protocols. The measurement instrument procurement framework creates advantages for suppliers with established metrology certifications, comprehensive calibration capabilities, and proven quality management systems.

Supply chain relationships focus on long-term technical partnerships rather than transactional procurement approaches. Japanese manufacturers typically maintain multi-year supplier agreements with instrument producers, emphasizing collaborative measurement solution development, joint quality improvement initiatives, and continuous technical support rather than competitive pricing negotiations. This stability supports application-specific probe development and measurement system optimization investments tailored to Japanese manufacturing requirements and quality expectations.
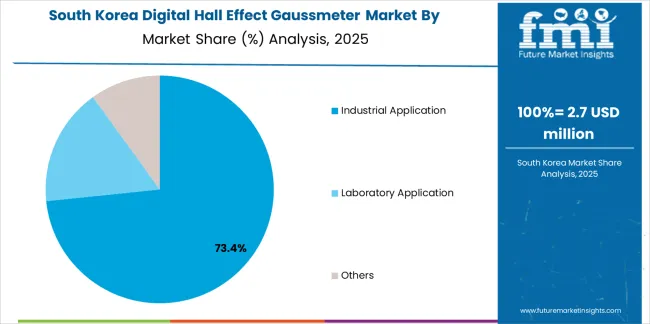
Research Excellence Drives South Korean Market Development

Digital Hall Effect Gaussmeter Market South Korea Market Share Analysis By Application

South Korean digital hall effect gaussmeter operations reflect the country's advanced electronics manufacturing and expanding research infrastructure. Major electronics companies including Samsung Electronics, LG Electronics, and government research institutions drive sophisticated measurement instrument procurement strategies, establishing technical partnerships with global instrument manufacturers to secure performance-validated gaussmeters for motor testing, magnetic component characterization, and electromagnetic compatibility verification supporting both domestic production and research operations.

The Korean market demonstrates particular strength in applying gaussmeters to electric vehicle motor development and battery system testing, with companies integrating magnetic field measurement into motor performance validation, quality control protocols, and electromagnetic interference assessment. This application focus creates demand for portable instruments optimized for production environment deployment and bench-top systems supporting comprehensive research characterization requirements.

Regulatory frameworks emphasize manufacturing quality standards and research measurement protocols, with electronics industry quality management systems requiring comprehensive instrument calibration and measurement uncertainty documentation. Gaussmeter selection processes require extensive performance validation and measurement capability verification, creating structured evaluation frameworks that favor established manufacturers with technical expertise and proven measurement accuracy.

Engineering collaboration between Korean manufacturers and instrument suppliers focuses on measurement automation and data management integration, with development projects targeting production testing efficiency and research data quality enhancement. Korean companies invest in advanced measurement system integration capabilities and automated testing technologies supporting instrument selection optimization and quality verification, positioning the market for continued advancement as electric vehicle technology evolves and research sophistication increases.

How Does the Demand for Digital Hall Effect Gaussmeter Market Vary Across Countries?

Profit pools consolidate around suppliers demonstrating measurement accuracy capabilities and comprehensive calibration service infrastructure serving industrial quality control and research laboratory segments where instrument reliability and technical support relationships command premium positioning. Value migrates from basic portable instruments toward advanced bench-top systems and multi-axis measurement solutions where superior resolution, calibration stability, and comprehensive data analysis capabilities create customer retention.

Several operational models define competitive dynamics: established scientific instrument manufacturers leveraging comprehensive product portfolios and worldwide calibration service networks; specialized magnetometry instrument producers focusing on application development and niche measurement requirements; industrial test equipment distributors providing instrument availability and localized technical support; and emerging manufacturers pursuing volume through cost competitiveness in standard portable configurations.

Switching costs remain moderate for basic industrial applications where measurement range and accuracy requirements permit instrument interchangeability with minimal process disruption. However, research applications involving established measurement protocols, calibration history documentation, and specialized probe configurations create barriers to supplier changes through requalification requirements and data continuity considerations. Competitive advantages accrue to manufacturers maintaining vertical integration across Hall sensor production, probe fabrication, and instrument assembly enabling customization responsiveness and measurement performance optimization.

Market concentration reflects established global manufacturers controlling significant share through brand recognition, calibration service infrastructure, and technical reputation while regional suppliers compete in price-sensitive industrial segments. Distribution complexity creates multi-tier channel structures with scientific equipment distributors, industrial test equipment suppliers, and direct sales coexisting depending on application sophistication and customer technical requirements. Technology differentiation focuses on sensor sensitivity advancement, temperature compensation algorithms, and software interface capabilities supporting diverse measurement applications and integration requirements.
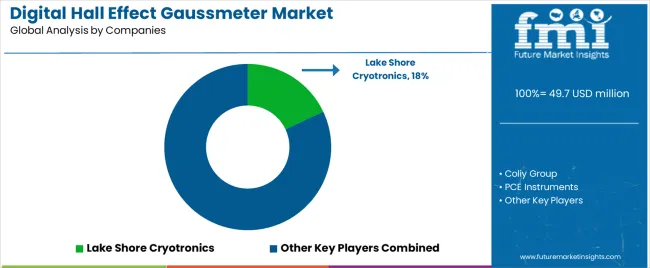
Who Are the Key Players in the Digital Hall Effect Gaussmeter Market?

Digital Hall Effect Gaussmeter Market Analysis By Company

  • Coliy Group
  • Lake Shore Cryotronics
  • PCE Instruments
  • Gigahertz Meters
  • Safe and Sound (SLT)
  • F.W. Bell (Meggitt PLC)
  • Hirst Magnetic Instruments
  • Brockhaus
  • Magnet-Physik
  • OMEGA Engineering (Spectris)
  • AlphaLab Inc.
  • Calamit
  • KANETEC
  • SENIS AG
  • List-Magnetik
  • Magnaflux
  • MAGSYS magnet systeme
  • Group3 Technology
  • Dexing Magnet Tech
  • CH-Magnetoelectricity
  • Litian Magnetoelectrican
  • ROM Elektronik
  • Magnii Technologies
  • Tunkia Co., Ltd.

Scope of the Report

Items Values
Quantitative Units USD 49.7 million
Product Type Portable Gaussmeters, Bench-top Gaussmeters, Others
Application Industrial Application, Laboratory Application, Others
Regions Covered North America, Latin America, Europe, Asia Pacific, Middle East & Africa
Key Countries Covered United States, Germany, China, India, Brazil, United Kingdom, Japan, and other countries
Key Companies Profiled Coliy Group, Lake Shore Cryotronics, PCE Instruments, Gigahertz Meters, Safe and Sound (SLT), F.W. Bell (Meggitt PLC), Hirst Magnetic Instruments, Brockhaus, Magnet-Physik, OMEGA Engineering (Spectris), AlphaLab Inc., Calamit, KANETEC, SENIS AG, List-Magnetik, Magnaflux, MAGSYS magnet systeme, Group3 Technology, Dexing Magnet Tech, CH-Magnetoelectricity, Litian Magnetoelectrican, ROM Elektronik, Magnii Technologies, Tunkia Co., Ltd.
Additional Attributes Revenue analysis by product type and application segment, regional market dynamics, competitive landscape assessment, calibration service requirements, measurement accuracy trends, and digital connectivity innovations driving quality control advancement, research capability enhancement, and measurement automation

Digital Hall Effect Gaussmeter Market Segmentation

By Product Type

  • Portable Gaussmeters
  • Bench-top Gaussmeters
  • Others

By Application

  • Industrial Application
  • Laboratory Application
  • Others

By Region

  • North America
  • Europe
  • Asia Pacific
  • Latin America
  • Middle East & Africa

Frequently Asked Questions

How big is the digital hall effect gaussmeter market in 2025?

The global digital hall effect gaussmeter market is estimated to be valued at USD 49.7 million in 2025.

What will be the size of digital hall effect gaussmeter market in 2035?

The market size for the digital hall effect gaussmeter market is projected to reach USD 77.2 million by 2035.

How much will be the digital hall effect gaussmeter market growth between 2025 and 2035?

The digital hall effect gaussmeter market is expected to grow at a 4.5% CAGR between 2025 and 2035.

What are the key product types in the digital hall effect gaussmeter market?

The key product types in digital hall effect gaussmeter market are portable gaussmeters, bench-top gaussmeters and others.

Which application segment to contribute significant share in the digital hall effect gaussmeter market in 2025?

In terms of application, industrial application segment to command 72.0% share in the digital hall effect gaussmeter market in 2025.

Table of Content

  1. Executive Summary
    • Global Market Outlook
    • Demand to side Trends
    • Supply to side Trends
    • Technology Roadmap Analysis
    • Analysis and Recommendations
  2. Market Overview
    • Market Coverage / Taxonomy
    • Market Definition / Scope / Limitations
  3. Market Background
    • Market Dynamics
      • Drivers
      • Restraints
      • Opportunity
      • Trends
    • Scenario Forecast
      • Demand in Optimistic Scenario
      • Demand in Likely Scenario
      • Demand in Conservative Scenario
    • Opportunity Map Analysis
    • Product Life Cycle Analysis
    • Supply Chain Analysis
    • Investment Feasibility Matrix
    • Value Chain Analysis
    • PESTLE and Porter’s Analysis
    • Regulatory Landscape
    • Regional Parent Market Outlook
    • Production and Consumption Statistics
    • Import and Export Statistics
  4. Global Market Analysis 2020 to 2024 and Forecast, 2025 to 2035
    • Historical Market Size Value (USD Million) Analysis, 2020 to 2024
    • Current and Future Market Size Value (USD Million) Projections, 2025 to 2035
      • Y to o to Y Growth Trend Analysis
      • Absolute $ Opportunity Analysis
  5. Global Market Pricing Analysis 2020 to 2024 and Forecast 2025 to 2035
  6. Global Market Analysis 2020 to 2024 and Forecast 2025 to 2035, By Product Type
    • Introduction / Key Findings
    • Historical Market Size Value (USD Million) Analysis By Product Type , 2020 to 2024
    • Current and Future Market Size Value (USD Million) Analysis and Forecast By Product Type , 2025 to 2035
      • Portable Gaussmeters
      • Bench-top Gaussmeters
      • Others
    • Y to o to Y Growth Trend Analysis By Product Type , 2020 to 2024
    • Absolute $ Opportunity Analysis By Product Type , 2025 to 2035
  7. Global Market Analysis 2020 to 2024 and Forecast 2025 to 2035, By Application
    • Introduction / Key Findings
    • Historical Market Size Value (USD Million) Analysis By Application, 2020 to 2024
    • Current and Future Market Size Value (USD Million) Analysis and Forecast By Application, 2025 to 2035
      • Industrial Application
      • Laboratory Application
      • Others
    • Y to o to Y Growth Trend Analysis By Application, 2020 to 2024
    • Absolute $ Opportunity Analysis By Application, 2025 to 2035
  8. Global Market Analysis 2020 to 2024 and Forecast 2025 to 2035, By Region
    • Introduction
    • Historical Market Size Value (USD Million) Analysis By Region, 2020 to 2024
    • Current Market Size Value (USD Million) Analysis and Forecast By Region, 2025 to 2035
      • North America
      • Latin America
      • Western Europe
      • Eastern Europe
      • East Asia
      • South Asia and Pacific
      • Middle East & Africa
    • Market Attractiveness Analysis By Region
  9. North America Market Analysis 2020 to 2024 and Forecast 2025 to 2035, By Country
    • Historical Market Size Value (USD Million) Trend Analysis By Market Taxonomy, 2020 to 2024
    • Market Size Value (USD Million) Forecast By Market Taxonomy, 2025 to 2035
      • By Country
        • USA
        • Canada
        • Mexico
      • By Product Type
      • By Application
    • Market Attractiveness Analysis
      • By Country
      • By Product Type
      • By Application
    • Key Takeaways
  10. Latin America Market Analysis 2020 to 2024 and Forecast 2025 to 2035, By Country
    • Historical Market Size Value (USD Million) Trend Analysis By Market Taxonomy, 2020 to 2024
    • Market Size Value (USD Million) Forecast By Market Taxonomy, 2025 to 2035
      • By Country
        • Brazil
        • Chile
        • Rest of Latin America
      • By Product Type
      • By Application
    • Market Attractiveness Analysis
      • By Country
      • By Product Type
      • By Application
    • Key Takeaways
  11. Western Europe Market Analysis 2020 to 2024 and Forecast 2025 to 2035, By Country
    • Historical Market Size Value (USD Million) Trend Analysis By Market Taxonomy, 2020 to 2024
    • Market Size Value (USD Million) Forecast By Market Taxonomy, 2025 to 2035
      • By Country
        • Germany
        • UK
        • Italy
        • Spain
        • France
        • Nordic
        • BENELUX
        • Rest of Western Europe
      • By Product Type
      • By Application
    • Market Attractiveness Analysis
      • By Country
      • By Product Type
      • By Application
    • Key Takeaways
  12. Eastern Europe Market Analysis 2020 to 2024 and Forecast 2025 to 2035, By Country
    • Historical Market Size Value (USD Million) Trend Analysis By Market Taxonomy, 2020 to 2024
    • Market Size Value (USD Million) Forecast By Market Taxonomy, 2025 to 2035
      • By Country
        • Russia
        • Poland
        • Hungary
        • Balkan & Baltic
        • Rest of Eastern Europe
      • By Product Type
      • By Application
    • Market Attractiveness Analysis
      • By Country
      • By Product Type
      • By Application
    • Key Takeaways
  13. East Asia Market Analysis 2020 to 2024 and Forecast 2025 to 2035, By Country
    • Historical Market Size Value (USD Million) Trend Analysis By Market Taxonomy, 2020 to 2024
    • Market Size Value (USD Million) Forecast By Market Taxonomy, 2025 to 2035
      • By Country
        • China
        • Japan
        • South Korea
      • By Product Type
      • By Application
    • Market Attractiveness Analysis
      • By Country
      • By Product Type
      • By Application
    • Key Takeaways
  14. South Asia and Pacific Market Analysis 2020 to 2024 and Forecast 2025 to 2035, By Country
    • Historical Market Size Value (USD Million) Trend Analysis By Market Taxonomy, 2020 to 2024
    • Market Size Value (USD Million) Forecast By Market Taxonomy, 2025 to 2035
      • By Country
        • India
        • ASEAN
        • Australia & New Zealand
        • Rest of South Asia and Pacific
      • By Product Type
      • By Application
    • Market Attractiveness Analysis
      • By Country
      • By Product Type
      • By Application
    • Key Takeaways
  15. Middle East & Africa Market Analysis 2020 to 2024 and Forecast 2025 to 2035, By Country
    • Historical Market Size Value (USD Million) Trend Analysis By Market Taxonomy, 2020 to 2024
    • Market Size Value (USD Million) Forecast By Market Taxonomy, 2025 to 2035
      • By Country
        • Kingdom of Saudi Arabia
        • Other GCC Countries
        • Turkiye
        • South Africa
        • Other African Union
        • Rest of Middle East & Africa
      • By Product Type
      • By Application
    • Market Attractiveness Analysis
      • By Country
      • By Product Type
      • By Application
    • Key Takeaways
  16. Key Countries Market Analysis
    • USA
      • Pricing Analysis
      • Market Share Analysis, 2024
        • By Product Type
        • By Application
    • Canada
      • Pricing Analysis
      • Market Share Analysis, 2024
        • By Product Type
        • By Application
    • Mexico
      • Pricing Analysis
      • Market Share Analysis, 2024
        • By Product Type
        • By Application
    • Brazil
      • Pricing Analysis
      • Market Share Analysis, 2024
        • By Product Type
        • By Application
    • Chile
      • Pricing Analysis
      • Market Share Analysis, 2024
        • By Product Type
        • By Application
    • Germany
      • Pricing Analysis
      • Market Share Analysis, 2024
        • By Product Type
        • By Application
    • UK
      • Pricing Analysis
      • Market Share Analysis, 2024
        • By Product Type
        • By Application
    • Italy
      • Pricing Analysis
      • Market Share Analysis, 2024
        • By Product Type
        • By Application
    • Spain
      • Pricing Analysis
      • Market Share Analysis, 2024
        • By Product Type
        • By Application
    • France
      • Pricing Analysis
      • Market Share Analysis, 2024
        • By Product Type
        • By Application
    • India
      • Pricing Analysis
      • Market Share Analysis, 2024
        • By Product Type
        • By Application
    • ASEAN
      • Pricing Analysis
      • Market Share Analysis, 2024
        • By Product Type
        • By Application
    • Australia & New Zealand
      • Pricing Analysis
      • Market Share Analysis, 2024
        • By Product Type
        • By Application
    • China
      • Pricing Analysis
      • Market Share Analysis, 2024
        • By Product Type
        • By Application
    • Japan
      • Pricing Analysis
      • Market Share Analysis, 2024
        • By Product Type
        • By Application
    • South Korea
      • Pricing Analysis
      • Market Share Analysis, 2024
        • By Product Type
        • By Application
    • Russia
      • Pricing Analysis
      • Market Share Analysis, 2024
        • By Product Type
        • By Application
    • Poland
      • Pricing Analysis
      • Market Share Analysis, 2024
        • By Product Type
        • By Application
    • Hungary
      • Pricing Analysis
      • Market Share Analysis, 2024
        • By Product Type
        • By Application
    • Kingdom of Saudi Arabia
      • Pricing Analysis
      • Market Share Analysis, 2024
        • By Product Type
        • By Application
    • Turkiye
      • Pricing Analysis
      • Market Share Analysis, 2024
        • By Product Type
        • By Application
    • South Africa
      • Pricing Analysis
      • Market Share Analysis, 2024
        • By Product Type
        • By Application
  17. Market Structure Analysis
    • Competition Dashboard
    • Competition Benchmarking
    • Market Share Analysis of Top Players
      • By Regional
      • By Product Type
      • By Application
  18. Competition Analysis
    • Competition Deep Dive
      • Lake Shore Cryotronics
        • Overview
        • Product Portfolio
        • Profitability by Market Segments (Product/Age /Sales Channel/Region)
        • Sales Footprint
        • Strategy Overview
          • Marketing Strategy
          • Product Strategy
          • Channel Strategy
      • Coliy Group
      • PCE Instruments
      • Gigahertz Meters
      • Safe and Sound (SLT)
      • F.W. Bell (Meggitt PLC)
      • Hirst Magnetic Instruments
      • Brockhaus
      • Magnet-Physik
      • OMEGA Engineering (Spectris)
      • AlphaLab Inc.
      • Calamit
      • KANETEC
      • SENIS AG
      • List-Magnetik
      • Magnaflux
      • MAGSYS magnet systeme
      • Group3 Technology
      • Dexing Magnet Tech
      • CH-Magnetoelectricity
  19. Assumptions & Acronyms Used
  20. Research Methodology

List of Tables

  • Table 1: Global Market Value (USD Million) Forecast by Region, 2020 to 2035
  • Table 2: Global Market Value (USD Million) Forecast by Product Type , 2020 to 2035
  • Table 3: Global Market Value (USD Million) Forecast by Application, 2020 to 2035
  • Table 4: North America Market Value (USD Million) Forecast by Country, 2020 to 2035
  • Table 5: North America Market Value (USD Million) Forecast by Product Type , 2020 to 2035
  • Table 6: North America Market Value (USD Million) Forecast by Application, 2020 to 2035
  • Table 7: Latin America Market Value (USD Million) Forecast by Country, 2020 to 2035
  • Table 8: Latin America Market Value (USD Million) Forecast by Product Type , 2020 to 2035
  • Table 9: Latin America Market Value (USD Million) Forecast by Application, 2020 to 2035
  • Table 10: Western Europe Market Value (USD Million) Forecast by Country, 2020 to 2035
  • Table 11: Western Europe Market Value (USD Million) Forecast by Product Type , 2020 to 2035
  • Table 12: Western Europe Market Value (USD Million) Forecast by Application, 2020 to 2035
  • Table 13: Eastern Europe Market Value (USD Million) Forecast by Country, 2020 to 2035
  • Table 14: Eastern Europe Market Value (USD Million) Forecast by Product Type , 2020 to 2035
  • Table 15: Eastern Europe Market Value (USD Million) Forecast by Application, 2020 to 2035
  • Table 16: East Asia Market Value (USD Million) Forecast by Country, 2020 to 2035
  • Table 17: East Asia Market Value (USD Million) Forecast by Product Type , 2020 to 2035
  • Table 18: East Asia Market Value (USD Million) Forecast by Application, 2020 to 2035
  • Table 19: South Asia and Pacific Market Value (USD Million) Forecast by Country, 2020 to 2035
  • Table 20: South Asia and Pacific Market Value (USD Million) Forecast by Product Type , 2020 to 2035
  • Table 21: South Asia and Pacific Market Value (USD Million) Forecast by Application, 2020 to 2035
  • Table 22: Middle East & Africa Market Value (USD Million) Forecast by Country, 2020 to 2035
  • Table 23: Middle East & Africa Market Value (USD Million) Forecast by Product Type , 2020 to 2035
  • Table 24: Middle East & Africa Market Value (USD Million) Forecast by Application, 2020 to 2035

List of Figures

  • Figure 1: Global Market Pricing Analysis
  • Figure 2: Global Market Value (USD Million) Forecast 2020-2035
  • Figure 3: Global Market Value Share and BPS Analysis by Product Type , 2025 and 2035
  • Figure 4: Global Market Y-o-Y Growth Comparison by Product Type , 2025-2035
  • Figure 5: Global Market Attractiveness Analysis by Product Type
  • Figure 6: Global Market Value Share and BPS Analysis by Application, 2025 and 2035
  • Figure 7: Global Market Y-o-Y Growth Comparison by Application, 2025-2035
  • Figure 8: Global Market Attractiveness Analysis by Application
  • Figure 9: Global Market Value (USD Million) Share and BPS Analysis by Region, 2025 and 2035
  • Figure 10: Global Market Y-o-Y Growth Comparison by Region, 2025-2035
  • Figure 11: Global Market Attractiveness Analysis by Region
  • Figure 12: North America Market Incremental Dollar Opportunity, 2025-2035
  • Figure 13: Latin America Market Incremental Dollar Opportunity, 2025-2035
  • Figure 14: Western Europe Market Incremental Dollar Opportunity, 2025-2035
  • Figure 15: Eastern Europe Market Incremental Dollar Opportunity, 2025-2035
  • Figure 16: East Asia Market Incremental Dollar Opportunity, 2025-2035
  • Figure 17: South Asia and Pacific Market Incremental Dollar Opportunity, 2025-2035
  • Figure 18: Middle East & Africa Market Incremental Dollar Opportunity, 2025-2035
  • Figure 19: North America Market Value Share and BPS Analysis by Country, 2025 and 2035
  • Figure 20: North America Market Value Share and BPS Analysis by Product Type , 2025 and 2035
  • Figure 21: North America Market Y-o-Y Growth Comparison by Product Type , 2025-2035
  • Figure 22: North America Market Attractiveness Analysis by Product Type
  • Figure 23: North America Market Value Share and BPS Analysis by Application, 2025 and 2035
  • Figure 24: North America Market Y-o-Y Growth Comparison by Application, 2025-2035
  • Figure 25: North America Market Attractiveness Analysis by Application
  • Figure 26: Latin America Market Value Share and BPS Analysis by Country, 2025 and 2035
  • Figure 27: Latin America Market Value Share and BPS Analysis by Product Type , 2025 and 2035
  • Figure 28: Latin America Market Y-o-Y Growth Comparison by Product Type , 2025-2035
  • Figure 29: Latin America Market Attractiveness Analysis by Product Type
  • Figure 30: Latin America Market Value Share and BPS Analysis by Application, 2025 and 2035
  • Figure 31: Latin America Market Y-o-Y Growth Comparison by Application, 2025-2035
  • Figure 32: Latin America Market Attractiveness Analysis by Application
  • Figure 33: Western Europe Market Value Share and BPS Analysis by Country, 2025 and 2035
  • Figure 34: Western Europe Market Value Share and BPS Analysis by Product Type , 2025 and 2035
  • Figure 35: Western Europe Market Y-o-Y Growth Comparison by Product Type , 2025-2035
  • Figure 36: Western Europe Market Attractiveness Analysis by Product Type
  • Figure 37: Western Europe Market Value Share and BPS Analysis by Application, 2025 and 2035
  • Figure 38: Western Europe Market Y-o-Y Growth Comparison by Application, 2025-2035
  • Figure 39: Western Europe Market Attractiveness Analysis by Application
  • Figure 40: Eastern Europe Market Value Share and BPS Analysis by Country, 2025 and 2035
  • Figure 41: Eastern Europe Market Value Share and BPS Analysis by Product Type , 2025 and 2035
  • Figure 42: Eastern Europe Market Y-o-Y Growth Comparison by Product Type , 2025-2035
  • Figure 43: Eastern Europe Market Attractiveness Analysis by Product Type
  • Figure 44: Eastern Europe Market Value Share and BPS Analysis by Application, 2025 and 2035
  • Figure 45: Eastern Europe Market Y-o-Y Growth Comparison by Application, 2025-2035
  • Figure 46: Eastern Europe Market Attractiveness Analysis by Application
  • Figure 47: East Asia Market Value Share and BPS Analysis by Country, 2025 and 2035
  • Figure 48: East Asia Market Value Share and BPS Analysis by Product Type , 2025 and 2035
  • Figure 49: East Asia Market Y-o-Y Growth Comparison by Product Type , 2025-2035
  • Figure 50: East Asia Market Attractiveness Analysis by Product Type
  • Figure 51: East Asia Market Value Share and BPS Analysis by Application, 2025 and 2035
  • Figure 52: East Asia Market Y-o-Y Growth Comparison by Application, 2025-2035
  • Figure 53: East Asia Market Attractiveness Analysis by Application
  • Figure 54: South Asia and Pacific Market Value Share and BPS Analysis by Country, 2025 and 2035
  • Figure 55: South Asia and Pacific Market Value Share and BPS Analysis by Product Type , 2025 and 2035
  • Figure 56: South Asia and Pacific Market Y-o-Y Growth Comparison by Product Type , 2025-2035
  • Figure 57: South Asia and Pacific Market Attractiveness Analysis by Product Type
  • Figure 58: South Asia and Pacific Market Value Share and BPS Analysis by Application, 2025 and 2035
  • Figure 59: South Asia and Pacific Market Y-o-Y Growth Comparison by Application, 2025-2035
  • Figure 60: South Asia and Pacific Market Attractiveness Analysis by Application
  • Figure 61: Middle East & Africa Market Value Share and BPS Analysis by Country, 2025 and 2035
  • Figure 62: Middle East & Africa Market Value Share and BPS Analysis by Product Type , 2025 and 2035
  • Figure 63: Middle East & Africa Market Y-o-Y Growth Comparison by Product Type , 2025-2035
  • Figure 64: Middle East & Africa Market Attractiveness Analysis by Product Type
  • Figure 65: Middle East & Africa Market Value Share and BPS Analysis by Application, 2025 and 2035
  • Figure 66: Middle East & Africa Market Y-o-Y Growth Comparison by Application, 2025-2035
  • Figure 67: Middle East & Africa Market Attractiveness Analysis by Application
  • Figure 68: Global Market - Tier Structure Analysis
  • Figure 69: Global Market - Company Share Analysis
Dashboard
Dashboard
Dashboard
Dashboard
Dashboard
Dashboard

Our Research Products

Full Research Suite

The "Full Research Suite" delivers actionable market intel, deep dives on markets or technologies, so clients act faster, cut risk, and unlock growth.

Competitor Leaderboard Report

The Leaderboard benchmarks and ranks top vendors, classifying them as Established Leaders, Leading Challengers, or Disruptors & Challengers.

Future Leaders Index

Locates where complements amplify value and substitutes erode it, forecasting net impact by horizon

Market Data & Forecasts

We deliver granular, decision-grade intel: market sizing, 5-year forecasts, pricing, adoption, usage, revenue, and operational KPIs—plus competitor tracking, regulation, and value chains—across 60 countries broadly.

Market Focus Report

Spot the shifts before they hit your P&L. We track inflection points, adoption curves, pricing moves, and ecosystem plays to show where demand is heading, why it is changing, and what to do next across high-growth markets and disruptive tech

Survey Report

Real-time reads of user behavior. We track shifting priorities, perceptions of today’s and next-gen services, and provider experience, then pace how fast tech moves from trial to adoption, blending buyer, consumer, and channel inputs with social signals (#WhySwitch, #UX).

Bespoke Reports

Partner with our analyst team to build a custom report designed around your business priorities. From analysing market trends to assessing competitors or crafting bespoke datasets, we tailor insights to your needs.

Supplier Intelligence

Discovery & Profiling

Capacity & Footprint

Performance & Risk

Compliance & Governance

Commercial Readiness

Who Supplies Whom

Scorecards & Shortlists

Playbooks & Docs

Category Intelligence

Definition & Scope

Demand & Use Cases

Cost Drivers

Market Structure

Supply Chain Map

Trade & Policy

Operating Norms

Deliverables

Buyer Intelligence

Account Basics

Spend & Scope

Procurement Model

Vendor Requirements

Terms & Policies

Entry Strategy

Pain Points & Triggers

Outputs

Pricing Analysis

Benchmarks

Trends

Should-Cost

Indexation

Landed Cost

Commercial Terms

Deliverables

Brand Analysis

Positioning & Value Prop

Share & Presence

Customer Evidence

Go-to-Market

Digital & Reputation

Compliance & Trust

KPIs & Gaps

Outputs

Full Research Suite comprises of:

Market outlook & trends analysis

Market outlook & trends analysis

Interviews & case studies

Interviews & case studies

Strategic recommendations

Strategic recommendations

Vendor profiles & capabilities analysis

Vendor profiles & capabilities analysis

5-year forecasts

5-year forecasts

8 regions and 60+ country-level data splits

8 regions and 60+ country-level data splits

Market segment data splits

Market segment data splits

12 months of continuous data updates

12 months of continuous data updates

DELIVERED AS:

PDF EXCEL ONLINE

Full Research Suite


$5000

$7500

$10000

Buy Report Now
Similar Industry Reports

Similar Industry Reports

Digital Group Dining Service Market

Digital Group Dining Service Market Size and Share Forecast Outlook 2025 to 2035

Digital Pathology Displays Market

Digital Pathology Displays Market Size and Share Forecast Outlook 2025 to 2035

Digital Rights Management Market

Digital Rights Management Market Size and Share Forecast Outlook 2025 to 2035

Digital Liquid Filling Systems Market

Digital Liquid Filling Systems Market Size and Share Forecast Outlook 2025 to 2035

Digital Transformation Industry Analysis in MENA

Digital Transformation Industry Analysis in MENA Size and Share Forecast Outlook 2025 to 2035

Digital X-Ray Equipment Market

Digital X-Ray Equipment Market Size and Share Forecast Outlook 2025 to 2035

Digital Marketing Analytics Industry Analysis in Latin America

Digital Marketing Analytics Industry Analysis in Latin America Forecast Outlook 2025 to 2035

Digital Health Market

Digital Health Market Forecast and Outlook 2025 to 2035

Digital Pen Market
Digital Pen Market

Digital Pen Market Forecast and Outlook 2025 to 2035

Digital X-ray Market

Digital X-ray Market Size and Share Forecast Outlook 2025 to 2035

Digital Elevation Model Market

Digital Elevation Model Market Size and Share Forecast Outlook 2025 to 2035

Digital Pump Controller Market

Digital Pump Controller Market Size and Share Forecast Outlook 2025 to 2035

Digital Textile Printing Market

Digital Textile Printing Market Size and Share Forecast Outlook 2025 to 2035

Digital Printing Paper Market

Digital Printing Paper Market Size and Share Forecast Outlook 2025 to 2035

Digital Battlefield Market

Digital Battlefield Market Size and Share Forecast Outlook 2025 to 2035

Digital Product Passport Software Market

Digital Product Passport Software Market Size and Share Forecast Outlook 2025 to 2035

Digital Lending Platform Market

Digital Lending Platform Market Size and Share Forecast Outlook 2025 to 2035

Digital Shipyard Market

Digital Shipyard Market Size and Share Forecast Outlook 2025 to 2035

Digital Freight Matching Market

Digital Freight Matching Market Size and Share Forecast Outlook 2025 to 2035

Digital Textile Printer Market

Digital Textile Printer Market Size and Share Forecast Outlook 2025 to 2035

Future Market Insights

Digital Hall Effect Gaussmeter Market

Chat With MaRIA

Chat With

MaRIA

Hi There, I am MaRIA, Your Market Research Intelligence Assistant. How may I help you?