Digital Battlefield Market Size and Share Forecast Outlook 2025 to 2035

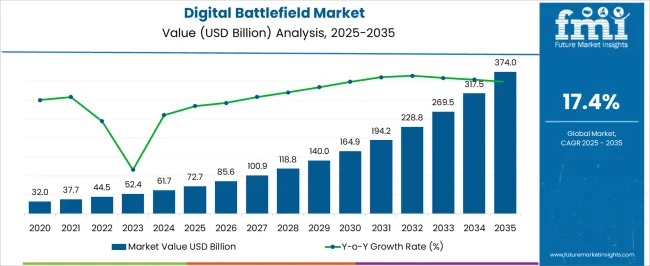
The Digital Battlefield Market is estimated to be valued at USD 72.7 billion in 2025 and is projected to reach USD 374.0 billion by 2035, registering a compound annual growth rate (CAGR) of 17.4% over the forecast period.
Quick Stats for Digital Battlefield Market

  • Digital Battlefield Market Industry Value (2025): USD 72.7 billion
  • Digital Battlefield Market Forecast Value (2035): USD 374.0 billion
  • Digital Battlefield Market Forecast CAGR: 17.4%
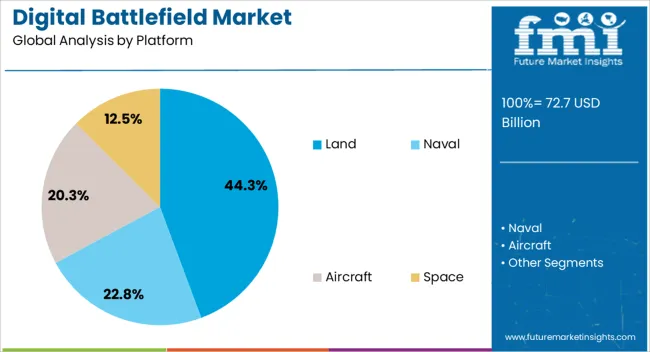
  • Leading Segment in Digital Battlefield Market in 2025: Land (44.3%)
  • Key Growth Region in Digital Battlefield Market: North America, Asia-Pacific, Europe
  • Top Key Players in Digital Battlefield Market: Lockheed Martin Corporation, Raytheon Technologies Corporation, BAE Systems, Elbit Systems Ltd., General Dynamics Corporation, FLIR Systems Inc., Northrop Grumman Corporation, Rheinmetall AG, Thales Group, ATOS SE, Airbus S.A.S

Digital Battlefield Market Market Value Analysis

Metric Value
Digital Battlefield Market Estimated Value in (2025 E) USD 72.7 billion
Digital Battlefield Market Forecast Value in (2035 F) USD 374.0 billion
Forecast CAGR (2025 to 2035) 17.4%

Rationale for Segmental Growth in the Digital Battlefield Market

The digital battlefield market is undergoing robust expansion, driven by rising defense modernization initiatives and the adoption of next-generation technologies to enhance situational awareness, operational efficiency, and decision-making speed. The integration of digital communication systems, AI-driven analytics, and IoT-enabled devices is transforming traditional defense operations into connected ecosystems.

Current market growth is supported by increasing geopolitical tensions and the need for advanced command, control, communications, computers, intelligence, surveillance, and reconnaissance (C4ISR) capabilities. Hardware innovations, combined with software and service-based intelligence solutions, are improving interoperability among defense forces.

Future outlook is strengthened by investment in artificial intelligence, cloud computing, and cyber defense systems, ensuring more adaptive and resilient military operations. With strong government budgets allocated to defense technology upgrades and private sector collaboration, the digital battlefield market is positioned to expand significantly in the coming years.
Segmental Analysis

Insights into the Land Segment

Digital Battlefield Market Analysis By Platform

The land segment dominates the platform category in the digital battlefield market, accounting for approximately 44.34% share. This leadership is attributed to the critical role of ground-based systems in defense operations, where armored vehicles, command centers, and tactical units require advanced digital connectivity.

The integration of real-time surveillance, geospatial mapping, and communication systems has reinforced land platform capabilities. Growth in this segment is supported by ongoing upgrades to land-based defense systems, particularly in response to asymmetric warfare and border security requirements.

The deployment of AI-driven decision-support systems and unmanned ground vehicles further enhances its significance. With rising government investment in modernizing ground forces, the land segment is expected to retain its dominant share across global defense programs.
Insights into the Hardware Segment

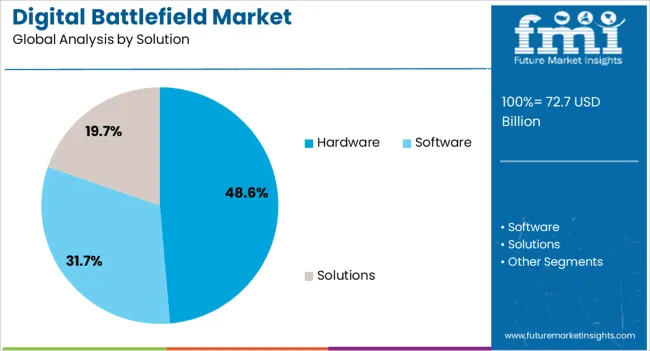
Digital Battlefield Market Analysis By Solution

The hardware segment leads the solution category with approximately 48.63% share, reflecting its central role in equipping defense systems with robust physical infrastructure. Hardware components such as sensors, displays, communication systems, and ruggedized devices are essential for digital battlefield operations.

The demand is driven by increasing procurement of advanced military equipment and modernization of existing platforms. Hardware solutions provide the foundation for software integration and AI-enabled analytics, ensuring mission-critical reliability.

With ongoing innovation in miniaturization and enhanced durability of devices, the segment continues to be a cornerstone of defense transformation programs. Strong investment in radar, surveillance, and tactical communication devices is expected to sustain the hardware segment’s leadership position.
Insights into the Artificial Intelligence Segment

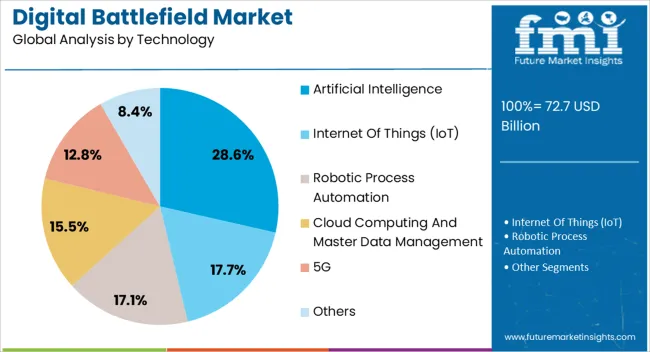
Digital Battlefield Market Analysis By Technology

The artificial intelligence segment accounts for approximately 28.56% share of the technology category, underscoring its pivotal role in transforming defense operations. AI-driven applications enable real-time data processing, predictive analytics, and autonomous decision-making capabilities, significantly enhancing battlefield efficiency.

Adoption of AI spans threat detection, surveillance, logistics optimization, and autonomous vehicle operations. Governments and defense contractors are prioritizing AI integration to ensure faster responses and improved mission outcomes.

The segment’s growth is further fueled by AI’s adaptability to cyber defense, counter-terrorism, and unmanned systems. With continuous advancements in machine learning algorithms and defense-specific AI applications, the segment is projected to expand rapidly, driving innovation in the digital battlefield landscape.

Emerging Trends in the Digital Battlefield Sector

  • 5G technology is allowing soldiers not only to connect better but also to become a part of unarmored vehicles, improving the capability of weapons.
  • Amidst the chaotic battlefield, digital devices are allowing higher-ups to take on-the-fly dictions, improve communication with soldiers on the ground, and plan strategies with the help of digital replicas.
  • As part of the digital battlefield, the use of GIS and GPS technologies is helping armies get precise locations of their soldiers while also keeping tabs on enemy assets.
  • Digital devices are helping armies to track and analyze signals and information relayed between enemy forces, helping decipher codes and secret signals, potentially allowing large advantages in planning maneuvers.
  • Armies are using satellites to track their own and enemy movement. Thus, the reach of the digital battlefield extends into space.
  • As part of the digital battlefield, armies are using robots and drones to supplement human capabilities.
  • Digitization requires heavy investment on the part of governments, which goes some way toward restraining the scope of the digital battlefield. However, with other armies getting quickly technology-proficient, governments are left with no choice but to upgrade to advanced technologies in a bid to keep up.

Digital Battlefield Industry Analysis by Top Investment Segments

Recognizing the varied nature of warfare, digital battlefields offer platforms for naval and air warfare, but it is land that is the platform that is widely concentrated upon. In line with the vast amount of hardware used by militaries, it is hardware that is a sought-after solution in the digital battlefield industry, too.

Digital Battlefields Concentrates Predominantly on Land Warfare

Land as a platform for warfare is predicted to capture a CAGR of 17.6% over the forecast period. Factors driving the growth of land in the market are:

  • Wars are often associated with land battles, and while naval and air warfare is becoming more common, it is tussles over land that still constitute the majority of warfare.
  • Digital battlefield provides enhanced capabilities to armies on land, such as GPS tracking and robots. Such technologies require increased investment to work underwater or in the air, and thus, land is often the first testing ground for new technologies in the market.
Attributes Details
Top Platform Land
CAGR (2025 to 2035) 17.6%

Hardware Segment is Likely to Lead in the Solution Category

Hardware solutions are forecast to progress at a CAGR of 17.4% over the period from 2025 to 2035. Some of the factors for the growth of hardware are:

  • Large allotments of space are made for armies, with defense considered a priority. Armies thus have the capability to store enormous quantities of hardware and are thus not reluctant to house advanced technologies that tag along significant hardware.
  • Militaries often develop their technologies and thus focus on providing the ultimate tools in the form of hardware to their experts.
Attributes Details
Top Solution Hardware
CAGR (2025 to 2035) 17.4%

Analysis of Top Countries Advancing Digital Battlefield Technologies

North America is the traditional powerhouse for military technology. Digital battlefield, too, is seeing increasing adoption across the region. Europe is another traditional base where the market is expected to continue going strong.

The Asia Pacific has emerged as one of the lucrative regions for the market. Increasing geopolitical tensions around the region are leading armies to adopt digital battlefields as a precautionary tactic.

Countries CAGR (2025 to 2035)
United States 18.2%
United Kingdom 19.0%
South Korea 20.1%
Japan 19.6%
China 18.7%

South Korean Government Looking to Keep Up with Technological Prowess of Neighbors

The market is anticipated to register a CAGR of 20.1% in South Korea for the forecast period. Some of the factors driving the incredible growth of the market in the country are:

  • In the wake of South Korea’s neighbor North Korea investing in better technology, South Korea is also looking to keep up. Thus, in December 2025, South Korea launched its first spy satellite shortly after its neighbor claimed to do the same. Thus, the digital battlefield is being engaged in the country not to be left behind technologically.
  • The proliferation of 5G technology in the country is allowing for increased use of the technology in the military, too.

Japan’s Self-defense Needs are Leading to Digital Battlefield Gaining Prominence in the Country

Japan is set to see the market expand at a CAGR of 19.6% over the forecast period. Prominent factors driving the growth of the market are:

  • Japan is focused on enhancing its security capabilities, and thus, the digital battlefield is being relied upon in the country.
  • Japan's ever-advancing technological capabilities, especially in the vehicle sector, are aiding the cause of technologies and, in turn, a digital battlefield in the military sector.

China’s Multi-pronged Conflicts with Various Nations Necessitate the Use of Digital Battlefield

The demand for digital battlefields is expected to register a CAGR of 18.7% in China. Some of the factors driving the growth of the market in China are:

  • China is fighting proxy wars on multiple fronts: land, naval, and air. Thus, there is a requirement for digital battlefield platforms of all kinds in the country.
  • China has several long-standing conflicts and thus is in need of continuous monitoring services. Digital battlefield is being used by the Chinese military for its monitoring of various enemies.

The United Kingdom’s Entry in Various Global Conflicts is Leading the Military in the Country to Adapt Digital Battlefield Solutions

The market is set to progress at a CAGR of 19.0% in the United Kingdom. Factors influencing the growth of the industry in Germany include:

  • The United Kingdom has lent military services to various conflict-stricken countries like Ukraine. Its digital battlefield capabilities too are being shared with these nations.
  • The United Kingdom operates an intricate system of spy networks, and to keep information about it secure, digital battlefield solutions are being sought in the country.

The United States Spending Power Ensures the Market’s Explosion in the Country

The market is expected to register a CAGR of 18.2% in the United States. Some of the reasons for the growth of digital battlefield in the country are:
  • The United States is reputed to be the country with the highest military spending in the world. As part of its military spending, technology is heavily being invested in, and the digital battlefield is emerging as a significant area of concern.
  • The military in the United States is known for its intensive training programs, and the digital battlefield is one way through which military drills and simulations are becoming more advanced in the country.

Competitive Landscape of the Digital Battlefield Market

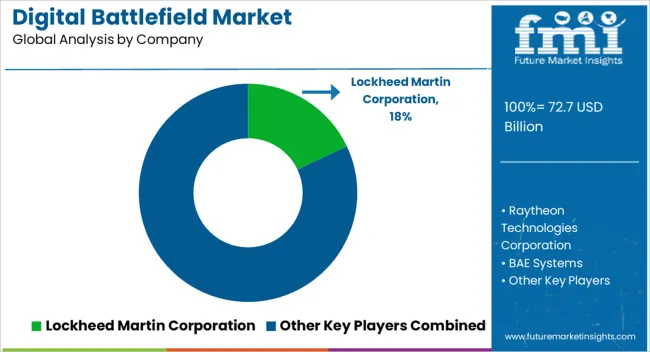
Digital Battlefield Market Analysis By Company

Players in the market are focusing on securing sizable contracts from governments. The development of new technologies is also being concentrated upon to attract the eyes of the militaries.

Market players are collaborating, intending to merge the technological capabilities of two different organizations. They are also concentrating on enhancing new technologies and frameworks for faster communication and effective data analysis and collection.

Recent Developments in the Digital Battlefield Market

  • In December 2024, Elbit Systems Ltd. was awarded a contract by the Royal Netherlands Army to supply digital soldier systems and vehicular integration to the Army.
  • In June 2025, BAE Systems developed the Mobility Air Forces Automated Flight Planning Service, or MAFPS, for the United States Air Force. It is a cloud-based service that aims to improve the planning efficiency of aircraft operations.
  • In April 2024, Raytheon Technolgies’ Stinger Missile Launcher got a training model. Named the Stinger Virtual Trainer System, the training model uses advances in virtual reality and gaming to train soldiers more effectively.

Leading Companies in the Digital Battlefield Sector

  • Raytheon Technologies Corporation
  • BAE Systems
  • Elbit Systems Ltd.
  • General Dynamics Corporation
  • FLIR Systems Inc.
  • Lockheed Martin Corporation
  • Northrop Grumman Corporation
  • Rheinmetall AG
  • Thales Group
  • ATOS SE
  • Airbus S.A.S
  • Rafael Advanced Defence Systems Ltd.
  • Israel Aerospace Industries
  • Curtiss-Wright

Top Segments Studied in the Digital Battlefield Market

By Platform:

  • Land
  • Naval
  • Aircraft
  • Space

By Solution:

  • Hardware
  • Software
  • Solutions

By Technology:

  • Artificial Intelligence
  • Internet of Things (IoT)
  • Robotic Process Automation
  • Cloud Computing and Master Data Management
  • 5G
  • Others

By Application:

  • Warfare Platform
  • Cyber Security
  • Surveillance and Situational Awareness
  • Command and Control
  • Mobile Communication
  • Simulation and Training
  • Design and Manufacturing
  • Electronic Warfare
  • Others

By Region:

  • North America
  • Latin America
  • Europe
  • South Asia
  • East Asia
  • Oceania
  • The Middle East and Africa (MEA)

Frequently Asked Questions

How big is the digital battlefield market in 2025?

The global digital battlefield market is estimated to be valued at USD 72.7 billion in 2025.

What will be the size of digital battlefield market in 2035?

The market size for the digital battlefield market is projected to reach USD 374.0 billion by 2035.

How much will be the digital battlefield market growth between 2025 and 2035?

The digital battlefield market is expected to grow at a 17.4% CAGR between 2025 and 2035.

What are the key product types in the digital battlefield market?

The key product types in digital battlefield market are land, naval, aircraft and space.

Which solution segment to contribute significant share in the digital battlefield market in 2025?

In terms of solution, hardware segment to command 48.6% share in the digital battlefield market in 2025.

Table of Content

  1. Executive Summary
    • Global Market Outlook
    • Demand-side Trends
    • Supply-side Trends
    • Technology Roadmap Analysis
    • Analysis and Recommendations
  2. Market Overview
    • Market Coverage / Taxonomy
    • Market Definition / Scope / Limitations
  3. Market Background
    • Market Dynamics
      • Drivers
      • Restraints
      • Opportunity
      • Trends
    • Scenario Forecast
      • Demand in Optimistic Scenario
      • Demand in Likely Scenario
      • Demand in Conservative Scenario
    • Opportunity Map Analysis
    • Product Life Cycle Analysis
    • Supply Chain Analysis
    • Investment Feasibility Matrix
    • Value Chain Analysis
    • PESTLE and Porter’s Analysis
    • Regulatory Landscape
    • Regional Parent Market Outlook
    • Production and Consumption Statistics
    • Import and Export Statistics
  4. Global Market Analysis 2020 to 2024 and Forecast, 2025 to 2035
    • Historical Market Size Value (USD Million) Analysis, 2020 to 2024
    • Current and Future Market Size Value (USD Million) Projections, 2025 to 2035
      • Y-o-Y Growth Trend Analysis
      • Absolute $ Opportunity Analysis
  5. Global Market Pricing Analysis 2020 to 2024 and Forecast 2025 to 2035
  6. Global Market Analysis 2020 to 2024 and Forecast 2025 to 2035, By Platform
    • Introduction / Key Findings
    • Historical Market Size Value (USD Million) Analysis By Platform , 2020 to 2024
    • Current and Future Market Size Value (USD Million) Analysis and Forecast By Platform , 2025 to 2035
      • Land
      • Naval
      • Aircraft
      • Space
    • Y-o-Y Growth Trend Analysis By Platform , 2020 to 2024
    • Absolute $ Opportunity Analysis By Platform , 2025 to 2035
  7. Global Market Analysis 2020 to 2024 and Forecast 2025 to 2035, By Solution
    • Introduction / Key Findings
    • Historical Market Size Value (USD Million) Analysis By Solution, 2020 to 2024
    • Current and Future Market Size Value (USD Million) Analysis and Forecast By Solution, 2025 to 2035
      • Hardware
      • Software
      • Solutions
    • Y-o-Y Growth Trend Analysis By Solution, 2020 to 2024
    • Absolute $ Opportunity Analysis By Solution, 2025 to 2035
  8. Global Market Analysis 2020 to 2024 and Forecast 2025 to 2035, By Technology
    • Introduction / Key Findings
    • Historical Market Size Value (USD Million) Analysis By Technology, 2020 to 2024
    • Current and Future Market Size Value (USD Million) Analysis and Forecast By Technology, 2025 to 2035
      • Artificial Intelligence
      • Internet Of Things (IoT)
      • Robotic Process Automation
      • Cloud Computing And Master Data Management
      • 5G
      • Others
    • Y-o-Y Growth Trend Analysis By Technology, 2020 to 2024
    • Absolute $ Opportunity Analysis By Technology, 2025 to 2035
  9. Global Market Analysis 2020 to 2024 and Forecast 2025 to 2035, By Application
    • Introduction / Key Findings
    • Historical Market Size Value (USD Million) Analysis By Application, 2020 to 2024
    • Current and Future Market Size Value (USD Million) Analysis and Forecast By Application, 2025 to 2035
      • Warfare Platform
      • Cyber Security
      • Surveillance And Situational Awareness
      • Command And Control
      • Mobile Communication
      • Simulation And Training
      • Design And Manufacturing
      • Electronic Warfare
      • Others
    • Y-o-Y Growth Trend Analysis By Application, 2020 to 2024
    • Absolute $ Opportunity Analysis By Application, 2025 to 2035
  10. Global Market Analysis 2020 to 2024 and Forecast 2025 to 2035, By Region
    • Introduction
    • Historical Market Size Value (USD Million) Analysis By Region, 2020 to 2024
    • Current Market Size Value (USD Million) Analysis and Forecast By Region, 2025 to 2035
      • North America
      • Latin America
      • Western Europe
      • Eastern Europe
      • East Asia
      • South Asia and Pacific
      • Middle East & Africa
    • Market Attractiveness Analysis By Region
  11. North America Market Analysis 2020 to 2024 and Forecast 2025 to 2035, By Country
    • Historical Market Size Value (USD Million) Trend Analysis By Market Taxonomy, 2020 to 2024
    • Market Size Value (USD Million) Forecast By Market Taxonomy, 2025 to 2035
      • By Country
        • USA
        • Canada
        • Mexico
      • By Platform
      • By Solution
      • By Technology
      • By Application
    • Market Attractiveness Analysis
      • By Country
      • By Platform
      • By Solution
      • By Technology
      • By Application
    • Key Takeaways
  12. Latin America Market Analysis 2020 to 2024 and Forecast 2025 to 2035, By Country
    • Historical Market Size Value (USD Million) Trend Analysis By Market Taxonomy, 2020 to 2024
    • Market Size Value (USD Million) Forecast By Market Taxonomy, 2025 to 2035
      • By Country
        • Brazil
        • Chile
        • Rest of Latin America
      • By Platform
      • By Solution
      • By Technology
      • By Application
    • Market Attractiveness Analysis
      • By Country
      • By Platform
      • By Solution
      • By Technology
      • By Application
    • Key Takeaways
  13. Western Europe Market Analysis 2020 to 2024 and Forecast 2025 to 2035, By Country
    • Historical Market Size Value (USD Million) Trend Analysis By Market Taxonomy, 2020 to 2024
    • Market Size Value (USD Million) Forecast By Market Taxonomy, 2025 to 2035
      • By Country
        • Germany
        • UK
        • Italy
        • Spain
        • France
        • Nordic
        • BENELUX
        • Rest of Western Europe
      • By Platform
      • By Solution
      • By Technology
      • By Application
    • Market Attractiveness Analysis
      • By Country
      • By Platform
      • By Solution
      • By Technology
      • By Application
    • Key Takeaways
  14. Eastern Europe Market Analysis 2020 to 2024 and Forecast 2025 to 2035, By Country
    • Historical Market Size Value (USD Million) Trend Analysis By Market Taxonomy, 2020 to 2024
    • Market Size Value (USD Million) Forecast By Market Taxonomy, 2025 to 2035
      • By Country
        • Russia
        • Poland
        • Hungary
        • Balkan & Baltic
        • Rest of Eastern Europe
      • By Platform
      • By Solution
      • By Technology
      • By Application
    • Market Attractiveness Analysis
      • By Country
      • By Platform
      • By Solution
      • By Technology
      • By Application
    • Key Takeaways
  15. East Asia Market Analysis 2020 to 2024 and Forecast 2025 to 2035, By Country
    • Historical Market Size Value (USD Million) Trend Analysis By Market Taxonomy, 2020 to 2024
    • Market Size Value (USD Million) Forecast By Market Taxonomy, 2025 to 2035
      • By Country
        • China
        • Japan
        • South Korea
      • By Platform
      • By Solution
      • By Technology
      • By Application
    • Market Attractiveness Analysis
      • By Country
      • By Platform
      • By Solution
      • By Technology
      • By Application
    • Key Takeaways
  16. South Asia and Pacific Market Analysis 2020 to 2024 and Forecast 2025 to 2035, By Country
    • Historical Market Size Value (USD Million) Trend Analysis By Market Taxonomy, 2020 to 2024
    • Market Size Value (USD Million) Forecast By Market Taxonomy, 2025 to 2035
      • By Country
        • India
        • ASEAN
        • Australia & New Zealand
        • Rest of South Asia and Pacific
      • By Platform
      • By Solution
      • By Technology
      • By Application
    • Market Attractiveness Analysis
      • By Country
      • By Platform
      • By Solution
      • By Technology
      • By Application
    • Key Takeaways
  17. Middle East & Africa Market Analysis 2020 to 2024 and Forecast 2025 to 2035, By Country
    • Historical Market Size Value (USD Million) Trend Analysis By Market Taxonomy, 2020 to 2024
    • Market Size Value (USD Million) Forecast By Market Taxonomy, 2025 to 2035
      • By Country
        • Kingdom of Saudi Arabia
        • Other GCC Countries
        • Turkiye
        • South Africa
        • Other African Union
        • Rest of Middle East & Africa
      • By Platform
      • By Solution
      • By Technology
      • By Application
    • Market Attractiveness Analysis
      • By Country
      • By Platform
      • By Solution
      • By Technology
      • By Application
    • Key Takeaways
  18. Key Countries Market Analysis
    • USA
      • Pricing Analysis
      • Market Share Analysis, 2024
        • By Platform
        • By Solution
        • By Technology
        • By Application
    • Canada
      • Pricing Analysis
      • Market Share Analysis, 2024
        • By Platform
        • By Solution
        • By Technology
        • By Application
    • Mexico
      • Pricing Analysis
      • Market Share Analysis, 2024
        • By Platform
        • By Solution
        • By Technology
        • By Application
    • Brazil
      • Pricing Analysis
      • Market Share Analysis, 2024
        • By Platform
        • By Solution
        • By Technology
        • By Application
    • Chile
      • Pricing Analysis
      • Market Share Analysis, 2024
        • By Platform
        • By Solution
        • By Technology
        • By Application
    • Germany
      • Pricing Analysis
      • Market Share Analysis, 2024
        • By Platform
        • By Solution
        • By Technology
        • By Application
    • UK
      • Pricing Analysis
      • Market Share Analysis, 2024
        • By Platform
        • By Solution
        • By Technology
        • By Application
    • Italy
      • Pricing Analysis
      • Market Share Analysis, 2024
        • By Platform
        • By Solution
        • By Technology
        • By Application
    • Spain
      • Pricing Analysis
      • Market Share Analysis, 2024
        • By Platform
        • By Solution
        • By Technology
        • By Application
    • France
      • Pricing Analysis
      • Market Share Analysis, 2024
        • By Platform
        • By Solution
        • By Technology
        • By Application
    • India
      • Pricing Analysis
      • Market Share Analysis, 2024
        • By Platform
        • By Solution
        • By Technology
        • By Application
    • ASEAN
      • Pricing Analysis
      • Market Share Analysis, 2024
        • By Platform
        • By Solution
        • By Technology
        • By Application
    • Australia & New Zealand
      • Pricing Analysis
      • Market Share Analysis, 2024
        • By Platform
        • By Solution
        • By Technology
        • By Application
    • China
      • Pricing Analysis
      • Market Share Analysis, 2024
        • By Platform
        • By Solution
        • By Technology
        • By Application
    • Japan
      • Pricing Analysis
      • Market Share Analysis, 2024
        • By Platform
        • By Solution
        • By Technology
        • By Application
    • South Korea
      • Pricing Analysis
      • Market Share Analysis, 2024
        • By Platform
        • By Solution
        • By Technology
        • By Application
    • Russia
      • Pricing Analysis
      • Market Share Analysis, 2024
        • By Platform
        • By Solution
        • By Technology
        • By Application
    • Poland
      • Pricing Analysis
      • Market Share Analysis, 2024
        • By Platform
        • By Solution
        • By Technology
        • By Application
    • Hungary
      • Pricing Analysis
      • Market Share Analysis, 2024
        • By Platform
        • By Solution
        • By Technology
        • By Application
    • Kingdom of Saudi Arabia
      • Pricing Analysis
      • Market Share Analysis, 2024
        • By Platform
        • By Solution
        • By Technology
        • By Application
    • Turkiye
      • Pricing Analysis
      • Market Share Analysis, 2024
        • By Platform
        • By Solution
        • By Technology
        • By Application
    • South Africa
      • Pricing Analysis
      • Market Share Analysis, 2024
        • By Platform
        • By Solution
        • By Technology
        • By Application
  19. Market Structure Analysis
    • Competition Dashboard
    • Competition Benchmarking
    • Market Share Analysis of Top Players
      • By Regional
      • By Platform
      • By Solution
      • By Technology
      • By Application
  20. Competition Analysis
    • Competition Deep Dive
      • Lockheed Martin Corporation
        • Overview
        • Product Portfolio
        • Profitability by Market Segments (Product/Age /Sales Channel/Region)
        • Sales Footprint
        • Strategy Overview
          • Marketing Strategy
          • Product Strategy
          • Channel Strategy
      • Raytheon Technologies Corporation
      • BAE Systems
      • Elbit Systems Ltd.
      • General Dynamics Corporation
      • FLIR Systems Inc.
      • Northrop Grumman Corporation
      • Rheinmetall AG
      • Thales Group
      • ATOS SE
      • Airbus S.A.S
  21. Assumptions & Acronyms Used
  22. Research Methodology

List of Tables

  • Table 1: Global Market Value (USD Million) Forecast by Region, 2020-2035
  • Table 2: Global Market Value (USD Million) Forecast by Platform , 2020-2035
  • Table 3: Global Market Value (USD Million) Forecast by Solution, 2020-2035
  • Table 4: Global Market Value (USD Million) Forecast by Technology, 2020-2035
  • Table 5: Global Market Value (USD Million) Forecast by Application, 2020-2035
  • Table 6: North America Market Value (USD Million) Forecast by Country, 2020-2035
  • Table 7: North America Market Value (USD Million) Forecast by Platform , 2020-2035
  • Table 8: North America Market Value (USD Million) Forecast by Solution, 2020-2035
  • Table 9: North America Market Value (USD Million) Forecast by Technology, 2020-2035
  • Table 10: North America Market Value (USD Million) Forecast by Application, 2020-2035
  • Table 11: Latin America Market Value (USD Million) Forecast by Country, 2020-2035
  • Table 12: Latin America Market Value (USD Million) Forecast by Platform , 2020-2035
  • Table 13: Latin America Market Value (USD Million) Forecast by Solution, 2020-2035
  • Table 14: Latin America Market Value (USD Million) Forecast by Technology, 2020-2035
  • Table 15: Latin America Market Value (USD Million) Forecast by Application, 2020-2035
  • Table 16: Western Europe Market Value (USD Million) Forecast by Country, 2020-2035
  • Table 17: Western Europe Market Value (USD Million) Forecast by Platform , 2020-2035
  • Table 18: Western Europe Market Value (USD Million) Forecast by Solution, 2020-2035
  • Table 19: Western Europe Market Value (USD Million) Forecast by Technology, 2020-2035
  • Table 20: Western Europe Market Value (USD Million) Forecast by Application, 2020-2035
  • Table 21: Eastern Europe Market Value (USD Million) Forecast by Country, 2020-2035
  • Table 22: Eastern Europe Market Value (USD Million) Forecast by Platform , 2020-2035
  • Table 23: Eastern Europe Market Value (USD Million) Forecast by Solution, 2020-2035
  • Table 24: Eastern Europe Market Value (USD Million) Forecast by Technology, 2020-2035
  • Table 25: Eastern Europe Market Value (USD Million) Forecast by Application, 2020-2035
  • Table 26: East Asia Market Value (USD Million) Forecast by Country, 2020-2035
  • Table 27: East Asia Market Value (USD Million) Forecast by Platform , 2020-2035
  • Table 28: East Asia Market Value (USD Million) Forecast by Solution, 2020-2035
  • Table 29: East Asia Market Value (USD Million) Forecast by Technology, 2020-2035
  • Table 30: East Asia Market Value (USD Million) Forecast by Application, 2020-2035
  • Table 31: South Asia and Pacific Market Value (USD Million) Forecast by Country, 2020-2035
  • Table 32: South Asia and Pacific Market Value (USD Million) Forecast by Platform , 2020-2035
  • Table 33: South Asia and Pacific Market Value (USD Million) Forecast by Solution, 2020-2035
  • Table 34: South Asia and Pacific Market Value (USD Million) Forecast by Technology, 2020-2035
  • Table 35: South Asia and Pacific Market Value (USD Million) Forecast by Application, 2020-2035
  • Table 36: Middle East & Africa Market Value (USD Million) Forecast by Country, 2020-2035
  • Table 37: Middle East & Africa Market Value (USD Million) Forecast by Platform , 2020-2035
  • Table 38: Middle East & Africa Market Value (USD Million) Forecast by Solution, 2020-2035
  • Table 39: Middle East & Africa Market Value (USD Million) Forecast by Technology, 2020-2035
  • Table 40: Middle East & Africa Market Value (USD Million) Forecast by Application, 2020-2035

List of Figures

  • Figure 1: Global Market Pricing Analysis
  • Figure 2: Global Market Value (USD Million) Forecast 2020-2035
  • Figure 3: Global Market Value Share and BPS Analysis by Platform , 2025 and 2035
  • Figure 4: Global Market Y-o-Y Growth Comparison by Platform , 2025-2035
  • Figure 5: Global Market Attractiveness Analysis by Platform
  • Figure 6: Global Market Value Share and BPS Analysis by Solution, 2025 and 2035
  • Figure 7: Global Market Y-o-Y Growth Comparison by Solution, 2025-2035
  • Figure 8: Global Market Attractiveness Analysis by Solution
  • Figure 9: Global Market Value Share and BPS Analysis by Technology, 2025 and 2035
  • Figure 10: Global Market Y-o-Y Growth Comparison by Technology, 2025-2035
  • Figure 11: Global Market Attractiveness Analysis by Technology
  • Figure 12: Global Market Value Share and BPS Analysis by Application, 2025 and 2035
  • Figure 13: Global Market Y-o-Y Growth Comparison by Application, 2025-2035
  • Figure 14: Global Market Attractiveness Analysis by Application
  • Figure 15: Global Market Value (USD Million) Share and BPS Analysis by Region, 2025 and 2035
  • Figure 16: Global Market Y-o-Y Growth Comparison by Region, 2025-2035
  • Figure 17: Global Market Attractiveness Analysis by Region
  • Figure 18: North America Market Incremental Dollar Opportunity, 2025-2035
  • Figure 19: Latin America Market Incremental Dollar Opportunity, 2025-2035
  • Figure 20: Western Europe Market Incremental Dollar Opportunity, 2025-2035
  • Figure 21: Eastern Europe Market Incremental Dollar Opportunity, 2025-2035
  • Figure 22: East Asia Market Incremental Dollar Opportunity, 2025-2035
  • Figure 23: South Asia and Pacific Market Incremental Dollar Opportunity, 2025-2035
  • Figure 24: Middle East & Africa Market Incremental Dollar Opportunity, 2025-2035
  • Figure 25: North America Market Value Share and BPS Analysis by Country, 2025 and 2035
  • Figure 26: North America Market Value Share and BPS Analysis by Platform , 2025 and 2035
  • Figure 27: North America Market Y-o-Y Growth Comparison by Platform , 2025-2035
  • Figure 28: North America Market Attractiveness Analysis by Platform
  • Figure 29: North America Market Value Share and BPS Analysis by Solution, 2025 and 2035
  • Figure 30: North America Market Y-o-Y Growth Comparison by Solution, 2025-2035
  • Figure 31: North America Market Attractiveness Analysis by Solution
  • Figure 32: North America Market Value Share and BPS Analysis by Technology, 2025 and 2035
  • Figure 33: North America Market Y-o-Y Growth Comparison by Technology, 2025-2035
  • Figure 34: North America Market Attractiveness Analysis by Technology
  • Figure 35: North America Market Value Share and BPS Analysis by Application, 2025 and 2035
  • Figure 36: North America Market Y-o-Y Growth Comparison by Application, 2025-2035
  • Figure 37: North America Market Attractiveness Analysis by Application
  • Figure 38: Latin America Market Value Share and BPS Analysis by Country, 2025 and 2035
  • Figure 39: Latin America Market Value Share and BPS Analysis by Platform , 2025 and 2035
  • Figure 40: Latin America Market Y-o-Y Growth Comparison by Platform , 2025-2035
  • Figure 41: Latin America Market Attractiveness Analysis by Platform
  • Figure 42: Latin America Market Value Share and BPS Analysis by Solution, 2025 and 2035
  • Figure 43: Latin America Market Y-o-Y Growth Comparison by Solution, 2025-2035
  • Figure 44: Latin America Market Attractiveness Analysis by Solution
  • Figure 45: Latin America Market Value Share and BPS Analysis by Technology, 2025 and 2035
  • Figure 46: Latin America Market Y-o-Y Growth Comparison by Technology, 2025-2035
  • Figure 47: Latin America Market Attractiveness Analysis by Technology
  • Figure 48: Latin America Market Value Share and BPS Analysis by Application, 2025 and 2035
  • Figure 49: Latin America Market Y-o-Y Growth Comparison by Application, 2025-2035
  • Figure 50: Latin America Market Attractiveness Analysis by Application
  • Figure 51: Western Europe Market Value Share and BPS Analysis by Country, 2025 and 2035
  • Figure 52: Western Europe Market Value Share and BPS Analysis by Platform , 2025 and 2035
  • Figure 53: Western Europe Market Y-o-Y Growth Comparison by Platform , 2025-2035
  • Figure 54: Western Europe Market Attractiveness Analysis by Platform
  • Figure 55: Western Europe Market Value Share and BPS Analysis by Solution, 2025 and 2035
  • Figure 56: Western Europe Market Y-o-Y Growth Comparison by Solution, 2025-2035
  • Figure 57: Western Europe Market Attractiveness Analysis by Solution
  • Figure 58: Western Europe Market Value Share and BPS Analysis by Technology, 2025 and 2035
  • Figure 59: Western Europe Market Y-o-Y Growth Comparison by Technology, 2025-2035
  • Figure 60: Western Europe Market Attractiveness Analysis by Technology
  • Figure 61: Western Europe Market Value Share and BPS Analysis by Application, 2025 and 2035
  • Figure 62: Western Europe Market Y-o-Y Growth Comparison by Application, 2025-2035
  • Figure 63: Western Europe Market Attractiveness Analysis by Application
  • Figure 64: Eastern Europe Market Value Share and BPS Analysis by Country, 2025 and 2035
  • Figure 65: Eastern Europe Market Value Share and BPS Analysis by Platform , 2025 and 2035
  • Figure 66: Eastern Europe Market Y-o-Y Growth Comparison by Platform , 2025-2035
  • Figure 67: Eastern Europe Market Attractiveness Analysis by Platform
  • Figure 68: Eastern Europe Market Value Share and BPS Analysis by Solution, 2025 and 2035
  • Figure 69: Eastern Europe Market Y-o-Y Growth Comparison by Solution, 2025-2035
  • Figure 70: Eastern Europe Market Attractiveness Analysis by Solution
  • Figure 71: Eastern Europe Market Value Share and BPS Analysis by Technology, 2025 and 2035
  • Figure 72: Eastern Europe Market Y-o-Y Growth Comparison by Technology, 2025-2035
  • Figure 73: Eastern Europe Market Attractiveness Analysis by Technology
  • Figure 74: Eastern Europe Market Value Share and BPS Analysis by Application, 2025 and 2035
  • Figure 75: Eastern Europe Market Y-o-Y Growth Comparison by Application, 2025-2035
  • Figure 76: Eastern Europe Market Attractiveness Analysis by Application
  • Figure 77: East Asia Market Value Share and BPS Analysis by Country, 2025 and 2035
  • Figure 78: East Asia Market Value Share and BPS Analysis by Platform , 2025 and 2035
  • Figure 79: East Asia Market Y-o-Y Growth Comparison by Platform , 2025-2035
  • Figure 80: East Asia Market Attractiveness Analysis by Platform
  • Figure 81: East Asia Market Value Share and BPS Analysis by Solution, 2025 and 2035
  • Figure 82: East Asia Market Y-o-Y Growth Comparison by Solution, 2025-2035
  • Figure 83: East Asia Market Attractiveness Analysis by Solution
  • Figure 84: East Asia Market Value Share and BPS Analysis by Technology, 2025 and 2035
  • Figure 85: East Asia Market Y-o-Y Growth Comparison by Technology, 2025-2035
  • Figure 86: East Asia Market Attractiveness Analysis by Technology
  • Figure 87: East Asia Market Value Share and BPS Analysis by Application, 2025 and 2035
  • Figure 88: East Asia Market Y-o-Y Growth Comparison by Application, 2025-2035
  • Figure 89: East Asia Market Attractiveness Analysis by Application
  • Figure 90: South Asia and Pacific Market Value Share and BPS Analysis by Country, 2025 and 2035
  • Figure 91: South Asia and Pacific Market Value Share and BPS Analysis by Platform , 2025 and 2035
  • Figure 92: South Asia and Pacific Market Y-o-Y Growth Comparison by Platform , 2025-2035
  • Figure 93: South Asia and Pacific Market Attractiveness Analysis by Platform
  • Figure 94: South Asia and Pacific Market Value Share and BPS Analysis by Solution, 2025 and 2035
  • Figure 95: South Asia and Pacific Market Y-o-Y Growth Comparison by Solution, 2025-2035
  • Figure 96: South Asia and Pacific Market Attractiveness Analysis by Solution
  • Figure 97: South Asia and Pacific Market Value Share and BPS Analysis by Technology, 2025 and 2035
  • Figure 98: South Asia and Pacific Market Y-o-Y Growth Comparison by Technology, 2025-2035
  • Figure 99: South Asia and Pacific Market Attractiveness Analysis by Technology
  • Figure 100: South Asia and Pacific Market Value Share and BPS Analysis by Application, 2025 and 2035
  • Figure 101: South Asia and Pacific Market Y-o-Y Growth Comparison by Application, 2025-2035
  • Figure 102: South Asia and Pacific Market Attractiveness Analysis by Application
  • Figure 103: Middle East & Africa Market Value Share and BPS Analysis by Country, 2025 and 2035
  • Figure 104: Middle East & Africa Market Value Share and BPS Analysis by Platform , 2025 and 2035
  • Figure 105: Middle East & Africa Market Y-o-Y Growth Comparison by Platform , 2025-2035
  • Figure 106: Middle East & Africa Market Attractiveness Analysis by Platform
  • Figure 107: Middle East & Africa Market Value Share and BPS Analysis by Solution, 2025 and 2035
  • Figure 108: Middle East & Africa Market Y-o-Y Growth Comparison by Solution, 2025-2035
  • Figure 109: Middle East & Africa Market Attractiveness Analysis by Solution
  • Figure 110: Middle East & Africa Market Value Share and BPS Analysis by Technology, 2025 and 2035
  • Figure 111: Middle East & Africa Market Y-o-Y Growth Comparison by Technology, 2025-2035
  • Figure 112: Middle East & Africa Market Attractiveness Analysis by Technology
  • Figure 113: Middle East & Africa Market Value Share and BPS Analysis by Application, 2025 and 2035
  • Figure 114: Middle East & Africa Market Y-o-Y Growth Comparison by Application, 2025-2035
  • Figure 115: Middle East & Africa Market Attractiveness Analysis by Application
  • Figure 116: Global Market - Tier Structure Analysis
  • Figure 117: Global Market - Company Share Analysis
Dashboard
Dashboard
Dashboard
Dashboard
Dashboard
Dashboard

Full Research Suite comprises of:

Market outlook & trends analysis

Market outlook & trends analysis

Interviews & case studies

Interviews & case studies

Strategic recommendations

Strategic recommendations

Vendor profiles & capabilities analysis

Vendor profiles & capabilities analysis

5-year forecasts

5-year forecasts

8 regions and 60+ country-level data splits

8 regions and 60+ country-level data splits

Market segment data splits

Market segment data splits

12 months of continuous data updates

12 months of continuous data updates

DELIVERED AS:

PDF EXCEL ONLINE

Full Research Suite


$5000

$7500

$10000

Buy Report Now
Similar Industry Reports

Similar Industry Reports

Digital X-Ray Equipment Market

Digital X-Ray Equipment Market Size and Share Forecast Outlook 2025 to 2035

Digital Marketing Analytics Industry Analysis in Latin America

Digital Marketing Analytics Industry Analysis in Latin America Forecast Outlook 2025 to 2035

Digital Health Market

Digital Health Market Forecast and Outlook 2025 to 2035

Digital Pen Market
Digital Pen Market

Digital Pen Market Forecast and Outlook 2025 to 2035

Digital X-ray Market

Digital X-ray Market Size and Share Forecast Outlook 2025 to 2035

Digital Elevation Model Market

Digital Elevation Model Market Size and Share Forecast Outlook 2025 to 2035

Digital Pump Controller Market

Digital Pump Controller Market Size and Share Forecast Outlook 2025 to 2035

Digital Textile Printing Market

Digital Textile Printing Market Size and Share Forecast Outlook 2025 to 2035

Digital Printing Paper Market

Digital Printing Paper Market Size and Share Forecast Outlook 2025 to 2035

Digital Product Passport Software Market

Digital Product Passport Software Market Size and Share Forecast Outlook 2025 to 2035

Digital Lending Platform Market

Digital Lending Platform Market Size and Share Forecast Outlook 2025 to 2035

Digital Shipyard Market

Digital Shipyard Market Size and Share Forecast Outlook 2025 to 2035

Digital Freight Matching Market

Digital Freight Matching Market Size and Share Forecast Outlook 2025 to 2035

Digital Textile Printer Market

Digital Textile Printer Market Size and Share Forecast Outlook 2025 to 2035

Digital Thermo Anemometer Market

Digital Thermo Anemometer Market Size and Share Forecast Outlook 2025 to 2035

Digital Twins Technologies Market

Digital Twins Technologies Market Size and Share Forecast Outlook 2025 to 2035

Digital Servo Motors and Drives Market

Digital Servo Motors and Drives Market Size and Share Forecast Outlook 2025 to 2035

Digital Signature Market

Digital Signature Market Size and Share Forecast Outlook 2025 to 2035

Digital Map Market
Digital Map Market

Digital Map Market Size and Share Forecast Outlook 2025 to 2035

Digital Credential Management Software Market

Digital Credential Management Software Market Size and Share Forecast Outlook 2025 to 2035

Future Market Insights

Digital Battlefield Market

Chat With MaRIA

Chat With

MaRIA

Hi There, I am MaRIA, Your Market Research Intelligence Assistant. How may I help you?