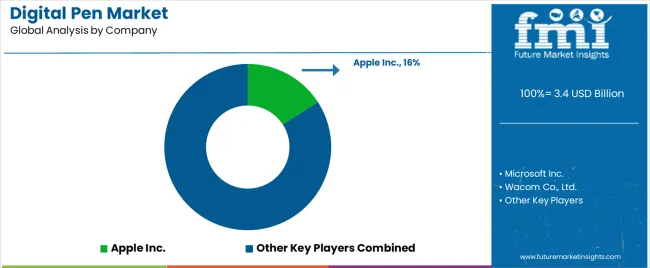
Digital Pen Market Outlook from 2024 to 2034

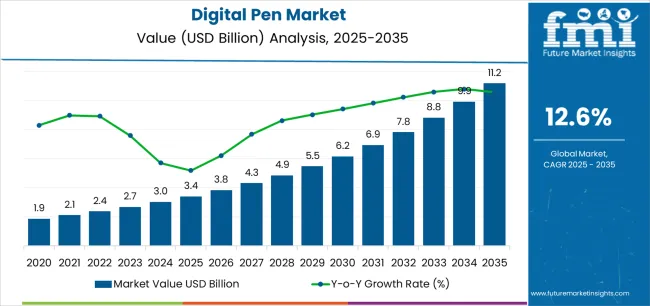
The global digital pen market is anticipated to be propelled at an impressive CAGR of 13.3%, attributed to various key market opportunities and competition to elevate the market size to USD 10.5 billion by 2034.

Attributes Key Insights
Estimated Market Size in 2024 USD 3.0 billion
Projected Market Value in 2034 USD 10.5 billion
Value-based CAGR from 2024 to 2034 13.3%

Digital Pen Market Trends and Highlights

  • The animation industry is growing, fueling the demand-side trends. This is because various allied markets are largely demanding digital pens. It is responsible for the digital pen market growth. Wacom Cintiq 16 was launched in 2019 as an important innovation in digital pen technology.
  • Digital pen market opportunities can be created due to the growth in e-learning platforms. Also, suppliers are demanded to give digital platforms and toolkits, which are fulfilled, propelling the supply-side trends of digital pens.
  • The government has supported the technological infrastructure, fueling different emerging markets. Hence, these digital pen market trends will likely propel the market.
  • The healthcare sector looks for a supply of digital pens to reduce tedious paperwork processes. Suppliers provide simplified solutions that push the supply-side trends of digital pens.

Demand Analysis of the Digital Pen Market from 2019 to 2023 vs. Outlook from 2024 to 2034

The historical period suggests that the digital pen market growth occurred at a staggering CAGR of 16.7%. This elevated the market size from USD 1.4 billion in 2019 to USD 2.6 billion in 2023.

Demand-side trends of digital pens suggest that the demand for digital pens suddenly surged during the pandemic. Digital transformation was the key reason behind this. Consequently, digital pen market growth was substantial during the historical period.

The creative industry was also booming in the historical period. Digital pens were required to be supplied frequently. Hence, this is another key digital pen market trend.

Supply-side trends of digital pens suggest that reduced manufacturing costs enhanced the profit margins. Also, the demand for digital pens was rising due to the inevitability of substituting traditional methods. Therefore, this has fuelled the digital pen market growth.

Historical CAGR from 2019 to 2023 16.7%
Forecast CAGR from 2024 to 2034 13.3%

The growing e-learning market will govern the forecasted period, creating lucrative digital pen market opportunities. The rising demand for digital support to enhance educational quality will likely bring constructive innovation in digital pen technology to meet the need. Hence, this will fuel the digital pen market growth.

Additionally, the healthcare sector will fetch the attention of leading digital pen manufacturers to meet the demand for reduced paperwork. Thus, it generates demand and will likely drive the subject market significantly.

Market Drivers

  • The digital pen market competition is the primary driver, as leading digital pen manufacturers bring about innovation in digital pen technology. For instance, Samsung launched the S Pen recently, which simplifies video and photo editing. Similarly, the Apple Pencil was launched, giving consumers multiple choices. It leverages digital pen market opportunities by catching consumer attention.
  • The growing technological infrastructure assists the digital pen market growth. This is due to reduced costs and elevated profit margins for key marketers.
  • The integration of AI in digital pens adds several user-friendly features. It expands the reach of the technology among all population subsets. Due to this, digital pen market opportunities are developed.
  • The growth of different industries, including entertainment, healthcare, and other markets, is responsible for the digital pen market growth.

Market Challenges

  • Lack of technological knowledge is a primary market restraint. Consumers refrain from buying digital pens as they find themselves incompetent to cope with them.
  • Compatibility issues might create hindrances to the digital pen market growth.
  • The digital pen market expansion opportunities might be compromised due to lacking standardization. This is another key market challenge.

Country-wise Analysis

The electronics market and the digital pen market are growing in North America. Based on supply-side trends of digital pens, large-scale businesses are fuelled by the efficient supply of relevant goods and services. Hence, this forecasts a great leap for the region in the market.

Europe secures a respectable market share due to the rising number of leading digital pen manufacturers. The increasing number of competitors gives ample product options for customers, supporting their demand-side trends of digital pens.

Asia-Pacific is the combination of emerging marketers and existing players. They foster innovation in digital pen technology through various initiatives. Hence, it is a promising market for key players.

Forecast CAGRs from 2024 to 2034

Countries Forecasted CAGR
The United States of America 13.5%
The United Kingdom 14.4%
China 13.9%
Japan 14.9%
South Korea 15.5%

Technological Integration into the Educational Sector Develops More Digital Pen Market Opportunities in the United States of America

  • The United States of America is estimated to leap at an impressive CAGR of 13.5%, estimating the market size to reach USD 1.9 billion, the highest among all other leading countries.
  • Many key players, like Apple, Microsoft, etc., have introduced digital pens specially designed for the educational sector.
  • Digitization has made remote learning necessary in the country, which these organizations fulfil.
  • Digital classrooms, interactive learning platforms, and remote learning fuel the demand-side trends of digital pens.

NHS Revolutionize the Data Management of Patients in the United Kingdom

  • The digital pen market growth will likely accelerate the market size at a massive CAGR of 14.4% through 2034 to reach a market valuation of USD 0.42 billion.
  • National Health Services (NHS) adopts digital pens to enhance the data management of its patients.
  • The primary aim of the public-sector NGO is to reduce paperwork and enhance efficiency.
  • Due to this, many digital pen suppliers have clustered in the market, pushing the supply trends of digital pens.

China Expands the Technological Development in Rural Areas, Fueling Digital Pen Market Growth

  • China produces lucrative digital pen market opportunities by investing in the technological infrastructure.
  • Extending the digital pen market competition by creating lucrative business opportunities in remote rural areas will likely serve the cause.
  • This explains a USD 1.6 billion market size through 2034 at an impressive CAGR of 13.9%.
  • China also exports components required for the technology, fueling supply-side trends of digital pens in the global landscape.

Assisting Technology for Aging Population Brings Innovation in Digital Pen Technology in Japan

  • Japan has a growing proportion of geriatric population, requiring constant assistance. This requirement can be met through the innovation in digital pen technology.
  • Software compatibility, easy-grip designs, and voice notes are some key technological features included in devices by Japan's leading digital pen manufacturers.
  • This amplifies the digital pen market competition, resulting in the availability of choices for customers.
  • These market dynamics will likely take the market size to USD 1.2 billion by 2034 at a propelling CAGR of 14.9%.

Creativity Boosts the Demand-side Trends of Digital Pens in South Korea

  • Animation, digital art, and graphic designing are the leading creative industries that surge the demand for digital pens for digital creations of their artworks.
  • These demand-side trends elevate the production of digital pens, which invites the leading digital pen manufacturers.
  • Consequently, this enhances the digital pen market competition, resulting in more product choices for customers.
  • Hence, this propels the market at a staggering CAGR of 15.5%, the highest, estimating the market to reach USD 0.67 billion by 2034.

Category-wise Insights

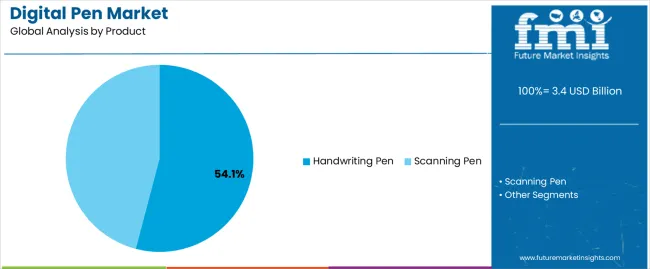
Category Top Product- Handwriting Pen
CAGR % 2024 to End of Forecast (2034) 13.1%
Market Segment Drivers
  • The versatility of handwriting pens justifies the market segment growth.
  • Moreover, innovation in digital pen technology diversifies the usability across different screens, helping the market segment gain more popularity.
Category Top End-User- Healthcare
CAGR % 2024 to End of Forecast (2034) 12.9%
Market Segment Drivers
  • The reduction in the documentation is responsible for the digital pen market growth. Reduced paperwork increases convenience, surging the demand for digital pens in the sector.
  • Digital pens are revolutionizing the healthcare sector by reducing human efforts. Hence, this drives the market segment.

Digital Pen Market Competition

Leading digital pen manufacturers clutter the competitive landscape of the global digital pen market. The cluttered digital pen market competition results in different market expansion strategies, including partnerships, collaborations, mergers and acquisitions, and product innovation.

The market might get threatened due to new entrants cluttering the market competition. Restricted resources control the costs levitated by the entry of new players. New entrants can reduce the profit margins.

Key Market Developments

  • In May 2023, Apple Inc. partnered with Google. This partnership helped the technological world eliminate unwanted tracking from devices. These leading digital pen manufacturers collaborated to mitigate the threat to deliver a safer consumer experience.
  • In March 2024, Microsoft Inc. and NVIDIA integrated. Moreover, Microsoft Azure adopted NVIDIA Grace Blackwell Superchip to streamline the AI development model.

Key Coverage of Digital Pen Market Report

  • Digital pen market investment matrix and its analysis.
  • Investment opportunities and trends in digital pen technologies.
  • Strengths and weaknesses of digital pen manufacturers and their comparison.
  • Bargaining power of suppliers in the digital pen industry.
  • Impact of buyer power on digital pen pricing.
  • Competitive landscape of digital pens.
  • Key coverage of the future of digital pen manufacturing.

Report Scope

Attributes Details
Estimated Market Size in 2024 USD 3.0 billion
Projected Market Valuation in 2034 USD 10.5 billion
Value-based CAGR 2024 to 2034 13.3%
Forecast Period 2024 to 2034
Historical Data Available for 2019 to 2023
Market Analysis Value in USD billion
Key Regions Covered

North America; Latin America; Western Europe; Eastern Europe; South Asia and Pacific; East Asia; The Middle East and Africa

Key Market Segments Covered

Product, Type, Compatibility, Usage, End-User, Region

Key Countries Profiled

The United States, Canada, Brazil, Mexico, Germany, The United Kingdom, France, Spain, Italy, Poland, Russia, Czech Republic, Romania, India, Bangladesh, Australia, New Zealand, China, Japan, South Korea, GCC Countries, South Africa, Israel

Key Companies Profiled

IRIS S.A.; Lucidia Inc.; Kent Displays; Wacom Co., Ltd.; ACECAD Digital Corp.; NeoLAB Convergence Lab; Livescribe Inc.; Moleskine S.p.A.; Apple Inc.; Microsoft Inc.

Digital Pen Market- Key Segments

By Product:

  • Scanning Pen
  • Handwriting Pen

By Type:

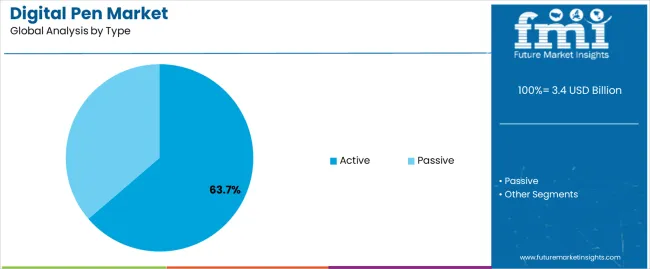
  • Active
  • Passive

By Compatibility:

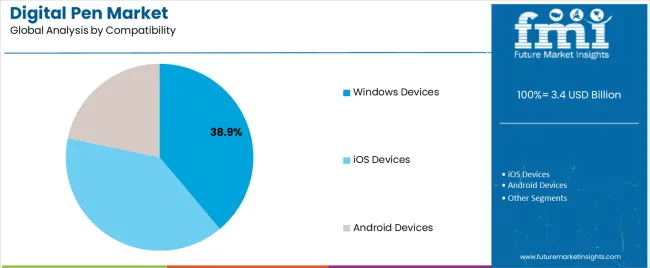
  • iOS Devices
  • Android Devices
  • Windows Devices

By Usage:

  • PC
  • Tablet
  • Smartphone

By End User:

  • BFSI
  • Healthcare
  • Government
  • Media & Entertainment
  • Education
  • Retail
  • Others

By Region:

  • North America
  • Latin America
  • Western Europe
  • Eastern Europe
  • South Asia and Pacific
  • East Asia
  • The Middle East and Africa

Table of Content

  • 1. Executive Summary
  • 2. Market Overview
  • 3. Market Background
  • 4. Global Market Analysis 2019 to 2023 and Forecast, 2024 to 2034
  • 5. Global Market Analysis 2019 to 2023 and Forecast 2024 to 2034, By Product
    • 5.1. Scanning Pen
    • 5.2. Handwriting Pen
  • 6. Global Market Analysis 2019 to 2023 and Forecast 2024 to 2034, By Type
    • 6.1. Active
    • 6.2. Passive
  • 7. Global Market Analysis 2019 to 2023 and Forecast 2024 to 2034, By Compatibility
    • 7.1. iOS Devices
    • 7.2. Android Devices
    • 7.3. Windows Devices
  • 8. Global Market Analysis 2019 to 2023 and Forecast 2024 to 2034, By Usage
    • 8.1. PC
    • 8.2. Tablet
    • 8.3. Smartphone
  • 9. Global Market Analysis 2019 to 2023 and Forecast 2024 to 2034, By End-User
    • 9.1. BFSI
    • 9.2. Healthcare
    • 9.3. Government
    • 9.4. Media & Entertainment
    • 9.5. Education
    • 9.6. Retail
    • 9.7. Others
  • 10. Global Market Analysis 2019 to 2023 and Forecast 2024 to 2034, By Region
    • 10.1. North America
    • 10.2. Latin America
    • 10.3. Western Europe
    • 10.4. Eastern Europe
    • 10.5. South Asia and Pacific
    • 10.6. East Asia
    • 10.7. Middle East and Africa
  • 11. North America Market Analysis 2019 to 2023 and Forecast 2024 to 2034, By Country
  • 12. Latin America Market Analysis 2019 to 2023 and Forecast 2024 to 2034, By Country
  • 13. Western Europe Market Analysis 2019 to 2023 and Forecast 2024 to 2034, By Country
  • 14. Eastern Europe Market Analysis 2019 to 2023 and Forecast 2024 to 2034, By Country
  • 15. South Asia and Pacific Market Analysis 2019 to 2023 and Forecast 2024 to 2034, By Country
  • 16. East Asia Market Analysis 2019 to 2023 and Forecast 2024 to 2034, By Country
  • 17. Middle East and Africa Market Analysis 2019 to 2023 and Forecast 2024 to 2034, By Country
  • 18. Key Countries Market Analysis
  • 19. Market Structure Analysis
  • 20. Competition Analysis
    • 20.1. IRIS S.A.
    • 20.2. Lucidia Inc.
    • 20.3. Kent Displays
    • 20.4. Wacom Co., Ltd.
    • 20.5. ACECAD Digital Corp.
    • 20.6. NeoLAB Convergence Lab
    • 20.7. Livescribe Inc.
    • 20.8. Moleskine S.p.A.
    • 20.9. Apple Inc.
    • 20.10. Microsoft Inc.
  • 21. Assumptions & Acronyms Used
  • 22. Research Methodology

List of Tables

Table 1: Global Market Value (US$ Million) Forecast by Region, 2019 to 2034

Table 2: Global Market Volume (Units) Forecast by Region, 2019 to 2034

Table 3: Global Market Value (US$ Million) Forecast by Product, 2019 to 2034

Table 4: Global Market Volume (Units) Forecast by Product, 2019 to 2034

Table 5: Global Market Value (US$ Million) Forecast by Type, 2019 to 2034

Table 6: Global Market Volume (Units) Forecast by Type, 2019 to 2034

Table 7: Global Market Value (US$ Million) Forecast by Compatibility, 2019 to 2034

Table 8: Global Market Volume (Units) Forecast by Compatibility, 2019 to 2034

Table 9: Global Market Value (US$ Million) Forecast by Usage, 2019 to 2034

Table 10: Global Market Volume (Units) Forecast by Usage, 2019 to 2034

Table 11: Global Market Value (US$ Million) Forecast by End-User, 2019 to 2034

Table 12: Global Market Volume (Units) Forecast by End-User, 2019 to 2034

Table 13: North America Market Value (US$ Million) Forecast by Country, 2019 to 2034

Table 14: North America Market Volume (Units) Forecast by Country, 2019 to 2034

Table 15: North America Market Value (US$ Million) Forecast by Product, 2019 to 2034

Table 16: North America Market Volume (Units) Forecast by Product, 2019 to 2034

Table 17: North America Market Value (US$ Million) Forecast by Type, 2019 to 2034

Table 18: North America Market Volume (Units) Forecast by Type, 2019 to 2034

Table 19: North America Market Value (US$ Million) Forecast by Compatibility, 2019 to 2034

Table 20: North America Market Volume (Units) Forecast by Compatibility, 2019 to 2034

Table 21: North America Market Value (US$ Million) Forecast by Usage, 2019 to 2034

Table 22: North America Market Volume (Units) Forecast by Usage, 2019 to 2034

Table 23: North America Market Value (US$ Million) Forecast by End-User, 2019 to 2034

Table 24: North America Market Volume (Units) Forecast by End-User, 2019 to 2034

Table 25: Latin America Market Value (US$ Million) Forecast by Country, 2019 to 2034

Table 26: Latin America Market Volume (Units) Forecast by Country, 2019 to 2034

Table 27: Latin America Market Value (US$ Million) Forecast by Product, 2019 to 2034

Table 28: Latin America Market Volume (Units) Forecast by Product, 2019 to 2034

Table 29: Latin America Market Value (US$ Million) Forecast by Type, 2019 to 2034

Table 30: Latin America Market Volume (Units) Forecast by Type, 2019 to 2034

Table 31: Latin America Market Value (US$ Million) Forecast by Compatibility, 2019 to 2034

Table 32: Latin America Market Volume (Units) Forecast by Compatibility, 2019 to 2034

Table 33: Latin America Market Value (US$ Million) Forecast by Usage, 2019 to 2034

Table 34: Latin America Market Volume (Units) Forecast by Usage, 2019 to 2034

Table 35: Latin America Market Value (US$ Million) Forecast by End-User, 2019 to 2034

Table 36: Latin America Market Volume (Units) Forecast by End-User, 2019 to 2034

Table 37: Western Europe Market Value (US$ Million) Forecast by Country, 2019 to 2034

Table 38: Western Europe Market Volume (Units) Forecast by Country, 2019 to 2034

Table 39: Western Europe Market Value (US$ Million) Forecast by Product, 2019 to 2034

Table 40: Western Europe Market Volume (Units) Forecast by Product, 2019 to 2034

Table 41: Western Europe Market Value (US$ Million) Forecast by Type, 2019 to 2034

Table 42: Western Europe Market Volume (Units) Forecast by Type, 2019 to 2034

Table 43: Western Europe Market Value (US$ Million) Forecast by Compatibility, 2019 to 2034

Table 44: Western Europe Market Volume (Units) Forecast by Compatibility, 2019 to 2034

Table 45: Western Europe Market Value (US$ Million) Forecast by Usage, 2019 to 2034

Table 46: Western Europe Market Volume (Units) Forecast by Usage, 2019 to 2034

Table 47: Western Europe Market Value (US$ Million) Forecast by End-User, 2019 to 2034

Table 48: Western Europe Market Volume (Units) Forecast by End-User, 2019 to 2034

Table 49: Eastern Europe Market Value (US$ Million) Forecast by Country, 2019 to 2034

Table 50: Eastern Europe Market Volume (Units) Forecast by Country, 2019 to 2034

Table 51: Eastern Europe Market Value (US$ Million) Forecast by Product, 2019 to 2034

Table 52: Eastern Europe Market Volume (Units) Forecast by Product, 2019 to 2034

Table 53: Eastern Europe Market Value (US$ Million) Forecast by Type, 2019 to 2034

Table 54: Eastern Europe Market Volume (Units) Forecast by Type, 2019 to 2034

Table 55: Eastern Europe Market Value (US$ Million) Forecast by Compatibility, 2019 to 2034

Table 56: Eastern Europe Market Volume (Units) Forecast by Compatibility, 2019 to 2034

Table 57: Eastern Europe Market Value (US$ Million) Forecast by Usage, 2019 to 2034

Table 58: Eastern Europe Market Volume (Units) Forecast by Usage, 2019 to 2034

Table 59: Eastern Europe Market Value (US$ Million) Forecast by End-User, 2019 to 2034

Table 60: Eastern Europe Market Volume (Units) Forecast by End-User, 2019 to 2034

Table 61: South Asia and Pacific Market Value (US$ Million) Forecast by Country, 2019 to 2034

Table 62: South Asia and Pacific Market Volume (Units) Forecast by Country, 2019 to 2034

Table 63: South Asia and Pacific Market Value (US$ Million) Forecast by Product, 2019 to 2034

Table 64: South Asia and Pacific Market Volume (Units) Forecast by Product, 2019 to 2034

Table 65: South Asia and Pacific Market Value (US$ Million) Forecast by Type, 2019 to 2034

Table 66: South Asia and Pacific Market Volume (Units) Forecast by Type, 2019 to 2034

Table 67: South Asia and Pacific Market Value (US$ Million) Forecast by Compatibility, 2019 to 2034

Table 68: South Asia and Pacific Market Volume (Units) Forecast by Compatibility, 2019 to 2034

Table 69: South Asia and Pacific Market Value (US$ Million) Forecast by Usage, 2019 to 2034

Table 70: South Asia and Pacific Market Volume (Units) Forecast by Usage, 2019 to 2034

Table 71: South Asia and Pacific Market Value (US$ Million) Forecast by End-User, 2019 to 2034

Table 72: South Asia and Pacific Market Volume (Units) Forecast by End-User, 2019 to 2034

Table 73: East Asia Market Value (US$ Million) Forecast by Country, 2019 to 2034

Table 74: East Asia Market Volume (Units) Forecast by Country, 2019 to 2034

Table 75: East Asia Market Value (US$ Million) Forecast by Product, 2019 to 2034

Table 76: East Asia Market Volume (Units) Forecast by Product, 2019 to 2034

Table 77: East Asia Market Value (US$ Million) Forecast by Type, 2019 to 2034

Table 78: East Asia Market Volume (Units) Forecast by Type, 2019 to 2034

Table 79: East Asia Market Value (US$ Million) Forecast by Compatibility, 2019 to 2034

Table 80: East Asia Market Volume (Units) Forecast by Compatibility, 2019 to 2034

Table 81: East Asia Market Value (US$ Million) Forecast by Usage, 2019 to 2034

Table 82: East Asia Market Volume (Units) Forecast by Usage, 2019 to 2034

Table 83: East Asia Market Value (US$ Million) Forecast by End-User, 2019 to 2034

Table 84: East Asia Market Volume (Units) Forecast by End-User, 2019 to 2034

Table 85: Middle East and Africa Market Value (US$ Million) Forecast by Country, 2019 to 2034

Table 86: Middle East and Africa Market Volume (Units) Forecast by Country, 2019 to 2034

Table 87: Middle East and Africa Market Value (US$ Million) Forecast by Product, 2019 to 2034

Table 88: Middle East and Africa Market Volume (Units) Forecast by Product, 2019 to 2034

Table 89: Middle East and Africa Market Value (US$ Million) Forecast by Type, 2019 to 2034

Table 90: Middle East and Africa Market Volume (Units) Forecast by Type, 2019 to 2034

Table 91: Middle East and Africa Market Value (US$ Million) Forecast by Compatibility, 2019 to 2034

Table 92: Middle East and Africa Market Volume (Units) Forecast by Compatibility, 2019 to 2034

Table 93: Middle East and Africa Market Value (US$ Million) Forecast by Usage, 2019 to 2034

Table 94: Middle East and Africa Market Volume (Units) Forecast by Usage, 2019 to 2034

Table 95: Middle East and Africa Market Value (US$ Million) Forecast by End-User, 2019 to 2034

Table 96: Middle East and Africa Market Volume (Units) Forecast by End-User, 2019 to 2034

List of Figures

Figure 1: Global Market Value (US$ Million) by Product, 2024 to 2034

Figure 2: Global Market Value (US$ Million) by Type, 2024 to 2034

Figure 3: Global Market Value (US$ Million) by Compatibility, 2024 to 2034

Figure 4: Global Market Value (US$ Million) by Usage, 2024 to 2034

Figure 5: Global Market Value (US$ Million) by End-User, 2024 to 2034

Figure 6: Global Market Value (US$ Million) by Region, 2024 to 2034

Figure 7: Global Market Value (US$ Million) Analysis by Region, 2019 to 2034

Figure 8: Global Market Volume (Units) Analysis by Region, 2019 to 2034

Figure 9: Global Market Value Share (%) and BPS Analysis by Region, 2024 to 2034

Figure 10: Global Market Y-o-Y Growth (%) Projections by Region, 2024 to 2034

Figure 11: Global Market Value (US$ Million) Analysis by Product, 2019 to 2034

Figure 12: Global Market Volume (Units) Analysis by Product, 2019 to 2034

Figure 13: Global Market Value Share (%) and BPS Analysis by Product, 2024 to 2034

Figure 14: Global Market Y-o-Y Growth (%) Projections by Product, 2024 to 2034

Figure 15: Global Market Value (US$ Million) Analysis by Type, 2019 to 2034

Figure 16: Global Market Volume (Units) Analysis by Type, 2019 to 2034

Figure 17: Global Market Value Share (%) and BPS Analysis by Type, 2024 to 2034

Figure 18: Global Market Y-o-Y Growth (%) Projections by Type, 2024 to 2034

Figure 19: Global Market Value (US$ Million) Analysis by Compatibility, 2019 to 2034

Figure 20: Global Market Volume (Units) Analysis by Compatibility, 2019 to 2034

Figure 21: Global Market Value Share (%) and BPS Analysis by Compatibility, 2024 to 2034

Figure 22: Global Market Y-o-Y Growth (%) Projections by Compatibility, 2024 to 2034

Figure 23: Global Market Value (US$ Million) Analysis by Usage, 2019 to 2034

Figure 24: Global Market Volume (Units) Analysis by Usage, 2019 to 2034

Figure 25: Global Market Value Share (%) and BPS Analysis by Usage, 2024 to 2034

Figure 26: Global Market Y-o-Y Growth (%) Projections by Usage, 2024 to 2034

Figure 27: Global Market Value (US$ Million) Analysis by End-User, 2019 to 2034

Figure 28: Global Market Volume (Units) Analysis by End-User, 2019 to 2034

Figure 29: Global Market Value Share (%) and BPS Analysis by End-User, 2024 to 2034

Figure 30: Global Market Y-o-Y Growth (%) Projections by End-User, 2024 to 2034

Figure 31: Global Market Attractiveness by Product, 2024 to 2034

Figure 32: Global Market Attractiveness by Type, 2024 to 2034

Figure 33: Global Market Attractiveness by Compatibility, 2024 to 2034

Figure 34: Global Market Attractiveness by Usage, 2024 to 2034

Figure 35: Global Market Attractiveness by End-User, 2024 to 2034

Figure 36: Global Market Attractiveness by Region, 2024 to 2034

Figure 37: North America Market Value (US$ Million) by Product, 2024 to 2034

Figure 38: North America Market Value (US$ Million) by Type, 2024 to 2034

Figure 39: North America Market Value (US$ Million) by Compatibility, 2024 to 2034

Figure 40: North America Market Value (US$ Million) by Usage, 2024 to 2034

Figure 41: North America Market Value (US$ Million) by End-User, 2024 to 2034

Figure 42: North America Market Value (US$ Million) by Country, 2024 to 2034

Figure 43: North America Market Value (US$ Million) Analysis by Country, 2019 to 2034

Figure 44: North America Market Volume (Units) Analysis by Country, 2019 to 2034

Figure 45: North America Market Value Share (%) and BPS Analysis by Country, 2024 to 2034

Figure 46: North America Market Y-o-Y Growth (%) Projections by Country, 2024 to 2034

Figure 47: North America Market Value (US$ Million) Analysis by Product, 2019 to 2034

Figure 48: North America Market Volume (Units) Analysis by Product, 2019 to 2034

Figure 49: North America Market Value Share (%) and BPS Analysis by Product, 2024 to 2034

Figure 50: North America Market Y-o-Y Growth (%) Projections by Product, 2024 to 2034

Figure 51: North America Market Value (US$ Million) Analysis by Type, 2019 to 2034

Figure 52: North America Market Volume (Units) Analysis by Type, 2019 to 2034

Figure 53: North America Market Value Share (%) and BPS Analysis by Type, 2024 to 2034

Figure 54: North America Market Y-o-Y Growth (%) Projections by Type, 2024 to 2034

Figure 55: North America Market Value (US$ Million) Analysis by Compatibility, 2019 to 2034

Figure 56: North America Market Volume (Units) Analysis by Compatibility, 2019 to 2034

Figure 57: North America Market Value Share (%) and BPS Analysis by Compatibility, 2024 to 2034

Figure 58: North America Market Y-o-Y Growth (%) Projections by Compatibility, 2024 to 2034

Figure 59: North America Market Value (US$ Million) Analysis by Usage, 2019 to 2034

Figure 60: North America Market Volume (Units) Analysis by Usage, 2019 to 2034

Figure 61: North America Market Value Share (%) and BPS Analysis by Usage, 2024 to 2034

Figure 62: North America Market Y-o-Y Growth (%) Projections by Usage, 2024 to 2034

Figure 63: North America Market Value (US$ Million) Analysis by End-User, 2019 to 2034

Figure 64: North America Market Volume (Units) Analysis by End-User, 2019 to 2034

Figure 65: North America Market Value Share (%) and BPS Analysis by End-User, 2024 to 2034

Figure 66: North America Market Y-o-Y Growth (%) Projections by End-User, 2024 to 2034

Figure 67: North America Market Attractiveness by Product, 2024 to 2034

Figure 68: North America Market Attractiveness by Type, 2024 to 2034

Figure 69: North America Market Attractiveness by Compatibility, 2024 to 2034

Figure 70: North America Market Attractiveness by Usage, 2024 to 2034

Figure 71: North America Market Attractiveness by End-User, 2024 to 2034

Figure 72: North America Market Attractiveness by Country, 2024 to 2034

Figure 73: Latin America Market Value (US$ Million) by Product, 2024 to 2034

Figure 74: Latin America Market Value (US$ Million) by Type, 2024 to 2034

Figure 75: Latin America Market Value (US$ Million) by Compatibility, 2024 to 2034

Figure 76: Latin America Market Value (US$ Million) by Usage, 2024 to 2034

Figure 77: Latin America Market Value (US$ Million) by End-User, 2024 to 2034

Figure 78: Latin America Market Value (US$ Million) by Country, 2024 to 2034

Figure 79: Latin America Market Value (US$ Million) Analysis by Country, 2019 to 2034

Figure 80: Latin America Market Volume (Units) Analysis by Country, 2019 to 2034

Figure 81: Latin America Market Value Share (%) and BPS Analysis by Country, 2024 to 2034

Figure 82: Latin America Market Y-o-Y Growth (%) Projections by Country, 2024 to 2034

Figure 83: Latin America Market Value (US$ Million) Analysis by Product, 2019 to 2034

Figure 84: Latin America Market Volume (Units) Analysis by Product, 2019 to 2034

Figure 85: Latin America Market Value Share (%) and BPS Analysis by Product, 2024 to 2034

Figure 86: Latin America Market Y-o-Y Growth (%) Projections by Product, 2024 to 2034

Figure 87: Latin America Market Value (US$ Million) Analysis by Type, 2019 to 2034

Figure 88: Latin America Market Volume (Units) Analysis by Type, 2019 to 2034

Figure 89: Latin America Market Value Share (%) and BPS Analysis by Type, 2024 to 2034

Figure 90: Latin America Market Y-o-Y Growth (%) Projections by Type, 2024 to 2034

Figure 91: Latin America Market Value (US$ Million) Analysis by Compatibility, 2019 to 2034

Figure 92: Latin America Market Volume (Units) Analysis by Compatibility, 2019 to 2034

Figure 93: Latin America Market Value Share (%) and BPS Analysis by Compatibility, 2024 to 2034

Figure 94: Latin America Market Y-o-Y Growth (%) Projections by Compatibility, 2024 to 2034

Figure 95: Latin America Market Value (US$ Million) Analysis by Usage, 2019 to 2034

Figure 96: Latin America Market Volume (Units) Analysis by Usage, 2019 to 2034

Figure 97: Latin America Market Value Share (%) and BPS Analysis by Usage, 2024 to 2034

Figure 98: Latin America Market Y-o-Y Growth (%) Projections by Usage, 2024 to 2034

Figure 99: Latin America Market Value (US$ Million) Analysis by End-User, 2019 to 2034

Figure 100: Latin America Market Volume (Units) Analysis by End-User, 2019 to 2034

Figure 101: Latin America Market Value Share (%) and BPS Analysis by End-User, 2024 to 2034

Figure 102: Latin America Market Y-o-Y Growth (%) Projections by End-User, 2024 to 2034

Figure 103: Latin America Market Attractiveness by Product, 2024 to 2034

Figure 104: Latin America Market Attractiveness by Type, 2024 to 2034

Figure 105: Latin America Market Attractiveness by Compatibility, 2024 to 2034

Figure 106: Latin America Market Attractiveness by Usage, 2024 to 2034

Figure 107: Latin America Market Attractiveness by End-User, 2024 to 2034

Figure 108: Latin America Market Attractiveness by Country, 2024 to 2034

Figure 109: Western Europe Market Value (US$ Million) by Product, 2024 to 2034

Figure 110: Western Europe Market Value (US$ Million) by Type, 2024 to 2034

Figure 111: Western Europe Market Value (US$ Million) by Compatibility, 2024 to 2034

Figure 112: Western Europe Market Value (US$ Million) by Usage, 2024 to 2034

Figure 113: Western Europe Market Value (US$ Million) by End-User, 2024 to 2034

Figure 114: Western Europe Market Value (US$ Million) by Country, 2024 to 2034

Figure 115: Western Europe Market Value (US$ Million) Analysis by Country, 2019 to 2034

Figure 116: Western Europe Market Volume (Units) Analysis by Country, 2019 to 2034

Figure 117: Western Europe Market Value Share (%) and BPS Analysis by Country, 2024 to 2034

Figure 118: Western Europe Market Y-o-Y Growth (%) Projections by Country, 2024 to 2034

Figure 119: Western Europe Market Value (US$ Million) Analysis by Product, 2019 to 2034

Figure 120: Western Europe Market Volume (Units) Analysis by Product, 2019 to 2034

Figure 121: Western Europe Market Value Share (%) and BPS Analysis by Product, 2024 to 2034

Figure 122: Western Europe Market Y-o-Y Growth (%) Projections by Product, 2024 to 2034

Figure 123: Western Europe Market Value (US$ Million) Analysis by Type, 2019 to 2034

Figure 124: Western Europe Market Volume (Units) Analysis by Type, 2019 to 2034

Figure 125: Western Europe Market Value Share (%) and BPS Analysis by Type, 2024 to 2034

Figure 126: Western Europe Market Y-o-Y Growth (%) Projections by Type, 2024 to 2034

Figure 127: Western Europe Market Value (US$ Million) Analysis by Compatibility, 2019 to 2034

Figure 128: Western Europe Market Volume (Units) Analysis by Compatibility, 2019 to 2034

Figure 129: Western Europe Market Value Share (%) and BPS Analysis by Compatibility, 2024 to 2034

Figure 130: Western Europe Market Y-o-Y Growth (%) Projections by Compatibility, 2024 to 2034

Figure 131: Western Europe Market Value (US$ Million) Analysis by Usage, 2019 to 2034

Figure 132: Western Europe Market Volume (Units) Analysis by Usage, 2019 to 2034

Figure 133: Western Europe Market Value Share (%) and BPS Analysis by Usage, 2024 to 2034

Figure 134: Western Europe Market Y-o-Y Growth (%) Projections by Usage, 2024 to 2034

Figure 135: Western Europe Market Value (US$ Million) Analysis by End-User, 2019 to 2034

Figure 136: Western Europe Market Volume (Units) Analysis by End-User, 2019 to 2034

Figure 137: Western Europe Market Value Share (%) and BPS Analysis by End-User, 2024 to 2034

Figure 138: Western Europe Market Y-o-Y Growth (%) Projections by End-User, 2024 to 2034

Figure 139: Western Europe Market Attractiveness by Product, 2024 to 2034

Figure 140: Western Europe Market Attractiveness by Type, 2024 to 2034

Figure 141: Western Europe Market Attractiveness by Compatibility, 2024 to 2034

Figure 142: Western Europe Market Attractiveness by Usage, 2024 to 2034

Figure 143: Western Europe Market Attractiveness by End-User, 2024 to 2034

Figure 144: Western Europe Market Attractiveness by Country, 2024 to 2034

Figure 145: Eastern Europe Market Value (US$ Million) by Product, 2024 to 2034

Figure 146: Eastern Europe Market Value (US$ Million) by Type, 2024 to 2034

Figure 147: Eastern Europe Market Value (US$ Million) by Compatibility, 2024 to 2034

Figure 148: Eastern Europe Market Value (US$ Million) by Usage, 2024 to 2034

Figure 149: Eastern Europe Market Value (US$ Million) by End-User, 2024 to 2034

Figure 150: Eastern Europe Market Value (US$ Million) by Country, 2024 to 2034

Figure 151: Eastern Europe Market Value (US$ Million) Analysis by Country, 2019 to 2034

Figure 152: Eastern Europe Market Volume (Units) Analysis by Country, 2019 to 2034

Figure 153: Eastern Europe Market Value Share (%) and BPS Analysis by Country, 2024 to 2034

Figure 154: Eastern Europe Market Y-o-Y Growth (%) Projections by Country, 2024 to 2034

Figure 155: Eastern Europe Market Value (US$ Million) Analysis by Product, 2019 to 2034

Figure 156: Eastern Europe Market Volume (Units) Analysis by Product, 2019 to 2034

Figure 157: Eastern Europe Market Value Share (%) and BPS Analysis by Product, 2024 to 2034

Figure 158: Eastern Europe Market Y-o-Y Growth (%) Projections by Product, 2024 to 2034

Figure 159: Eastern Europe Market Value (US$ Million) Analysis by Type, 2019 to 2034

Figure 160: Eastern Europe Market Volume (Units) Analysis by Type, 2019 to 2034

Figure 161: Eastern Europe Market Value Share (%) and BPS Analysis by Type, 2024 to 2034

Figure 162: Eastern Europe Market Y-o-Y Growth (%) Projections by Type, 2024 to 2034

Figure 163: Eastern Europe Market Value (US$ Million) Analysis by Compatibility, 2019 to 2034

Figure 164: Eastern Europe Market Volume (Units) Analysis by Compatibility, 2019 to 2034

Figure 165: Eastern Europe Market Value Share (%) and BPS Analysis by Compatibility, 2024 to 2034

Figure 166: Eastern Europe Market Y-o-Y Growth (%) Projections by Compatibility, 2024 to 2034

Figure 167: Eastern Europe Market Value (US$ Million) Analysis by Usage, 2019 to 2034

Figure 168: Eastern Europe Market Volume (Units) Analysis by Usage, 2019 to 2034

Figure 169: Eastern Europe Market Value Share (%) and BPS Analysis by Usage, 2024 to 2034

Figure 170: Eastern Europe Market Y-o-Y Growth (%) Projections by Usage, 2024 to 2034

Figure 171: Eastern Europe Market Value (US$ Million) Analysis by End-User, 2019 to 2034

Figure 172: Eastern Europe Market Volume (Units) Analysis by End-User, 2019 to 2034

Figure 173: Eastern Europe Market Value Share (%) and BPS Analysis by End-User, 2024 to 2034

Figure 174: Eastern Europe Market Y-o-Y Growth (%) Projections by End-User, 2024 to 2034

Figure 175: Eastern Europe Market Attractiveness by Product, 2024 to 2034

Figure 176: Eastern Europe Market Attractiveness by Type, 2024 to 2034

Figure 177: Eastern Europe Market Attractiveness by Compatibility, 2024 to 2034

Figure 178: Eastern Europe Market Attractiveness by Usage, 2024 to 2034

Figure 179: Eastern Europe Market Attractiveness by End-User, 2024 to 2034

Figure 180: Eastern Europe Market Attractiveness by Country, 2024 to 2034

Figure 181: South Asia and Pacific Market Value (US$ Million) by Product, 2024 to 2034

Figure 182: South Asia and Pacific Market Value (US$ Million) by Type, 2024 to 2034

Figure 183: South Asia and Pacific Market Value (US$ Million) by Compatibility, 2024 to 2034

Figure 184: South Asia and Pacific Market Value (US$ Million) by Usage, 2024 to 2034

Figure 185: South Asia and Pacific Market Value (US$ Million) by End-User, 2024 to 2034

Figure 186: South Asia and Pacific Market Value (US$ Million) by Country, 2024 to 2034

Figure 187: South Asia and Pacific Market Value (US$ Million) Analysis by Country, 2019 to 2034

Figure 188: South Asia and Pacific Market Volume (Units) Analysis by Country, 2019 to 2034

Figure 189: South Asia and Pacific Market Value Share (%) and BPS Analysis by Country, 2024 to 2034

Figure 190: South Asia and Pacific Market Y-o-Y Growth (%) Projections by Country, 2024 to 2034

Figure 191: South Asia and Pacific Market Value (US$ Million) Analysis by Product, 2019 to 2034

Figure 192: South Asia and Pacific Market Volume (Units) Analysis by Product, 2019 to 2034

Figure 193: South Asia and Pacific Market Value Share (%) and BPS Analysis by Product, 2024 to 2034

Figure 194: South Asia and Pacific Market Y-o-Y Growth (%) Projections by Product, 2024 to 2034

Figure 195: South Asia and Pacific Market Value (US$ Million) Analysis by Type, 2019 to 2034

Figure 196: South Asia and Pacific Market Volume (Units) Analysis by Type, 2019 to 2034

Figure 197: South Asia and Pacific Market Value Share (%) and BPS Analysis by Type, 2024 to 2034

Figure 198: South Asia and Pacific Market Y-o-Y Growth (%) Projections by Type, 2024 to 2034

Figure 199: South Asia and Pacific Market Value (US$ Million) Analysis by Compatibility, 2019 to 2034

Figure 200: South Asia and Pacific Market Volume (Units) Analysis by Compatibility, 2019 to 2034

Figure 201: South Asia and Pacific Market Value Share (%) and BPS Analysis by Compatibility, 2024 to 2034

Figure 202: South Asia and Pacific Market Y-o-Y Growth (%) Projections by Compatibility, 2024 to 2034

Figure 203: South Asia and Pacific Market Value (US$ Million) Analysis by Usage, 2019 to 2034

Figure 204: South Asia and Pacific Market Volume (Units) Analysis by Usage, 2019 to 2034

Figure 205: South Asia and Pacific Market Value Share (%) and BPS Analysis by Usage, 2024 to 2034

Figure 206: South Asia and Pacific Market Y-o-Y Growth (%) Projections by Usage, 2024 to 2034

Figure 207: South Asia and Pacific Market Value (US$ Million) Analysis by End-User, 2019 to 2034

Figure 208: South Asia and Pacific Market Volume (Units) Analysis by End-User, 2019 to 2034

Figure 209: South Asia and Pacific Market Value Share (%) and BPS Analysis by End-User, 2024 to 2034

Figure 210: South Asia and Pacific Market Y-o-Y Growth (%) Projections by End-User, 2024 to 2034

Figure 211: South Asia and Pacific Market Attractiveness by Product, 2024 to 2034

Figure 212: South Asia and Pacific Market Attractiveness by Type, 2024 to 2034

Figure 213: South Asia and Pacific Market Attractiveness by Compatibility, 2024 to 2034

Figure 214: South Asia and Pacific Market Attractiveness by Usage, 2024 to 2034

Figure 215: South Asia and Pacific Market Attractiveness by End-User, 2024 to 2034

Figure 216: South Asia and Pacific Market Attractiveness by Country, 2024 to 2034

Figure 217: East Asia Market Value (US$ Million) by Product, 2024 to 2034

Figure 218: East Asia Market Value (US$ Million) by Type, 2024 to 2034

Figure 219: East Asia Market Value (US$ Million) by Compatibility, 2024 to 2034

Figure 220: East Asia Market Value (US$ Million) by Usage, 2024 to 2034

Figure 221: East Asia Market Value (US$ Million) by End-User, 2024 to 2034

Figure 222: East Asia Market Value (US$ Million) by Country, 2024 to 2034

Figure 223: East Asia Market Value (US$ Million) Analysis by Country, 2019 to 2034

Figure 224: East Asia Market Volume (Units) Analysis by Country, 2019 to 2034

Figure 225: East Asia Market Value Share (%) and BPS Analysis by Country, 2024 to 2034

Figure 226: East Asia Market Y-o-Y Growth (%) Projections by Country, 2024 to 2034

Figure 227: East Asia Market Value (US$ Million) Analysis by Product, 2019 to 2034

Figure 228: East Asia Market Volume (Units) Analysis by Product, 2019 to 2034

Figure 229: East Asia Market Value Share (%) and BPS Analysis by Product, 2024 to 2034

Figure 230: East Asia Market Y-o-Y Growth (%) Projections by Product, 2024 to 2034

Figure 231: East Asia Market Value (US$ Million) Analysis by Type, 2019 to 2034

Figure 232: East Asia Market Volume (Units) Analysis by Type, 2019 to 2034

Figure 233: East Asia Market Value Share (%) and BPS Analysis by Type, 2024 to 2034

Figure 234: East Asia Market Y-o-Y Growth (%) Projections by Type, 2024 to 2034

Figure 235: East Asia Market Value (US$ Million) Analysis by Compatibility, 2019 to 2034

Figure 236: East Asia Market Volume (Units) Analysis by Compatibility, 2019 to 2034

Figure 237: East Asia Market Value Share (%) and BPS Analysis by Compatibility, 2024 to 2034

Figure 238: East Asia Market Y-o-Y Growth (%) Projections by Compatibility, 2024 to 2034

Figure 239: East Asia Market Value (US$ Million) Analysis by Usage, 2019 to 2034

Figure 240: East Asia Market Volume (Units) Analysis by Usage, 2019 to 2034

Figure 241: East Asia Market Value Share (%) and BPS Analysis by Usage, 2024 to 2034

Figure 242: East Asia Market Y-o-Y Growth (%) Projections by Usage, 2024 to 2034

Figure 243: East Asia Market Value (US$ Million) Analysis by End-User, 2019 to 2034

Figure 244: East Asia Market Volume (Units) Analysis by End-User, 2019 to 2034

Figure 245: East Asia Market Value Share (%) and BPS Analysis by End-User, 2024 to 2034

Figure 246: East Asia Market Y-o-Y Growth (%) Projections by End-User, 2024 to 2034

Figure 247: East Asia Market Attractiveness by Product, 2024 to 2034

Figure 248: East Asia Market Attractiveness by Type, 2024 to 2034

Figure 249: East Asia Market Attractiveness by Compatibility, 2024 to 2034

Figure 250: East Asia Market Attractiveness by Usage, 2024 to 2034

Figure 251: East Asia Market Attractiveness by End-User, 2024 to 2034

Figure 252: East Asia Market Attractiveness by Country, 2024 to 2034

Figure 253: Middle East and Africa Market Value (US$ Million) by Product, 2024 to 2034

Figure 254: Middle East and Africa Market Value (US$ Million) by Type, 2024 to 2034

Figure 255: Middle East and Africa Market Value (US$ Million) by Compatibility, 2024 to 2034

Figure 256: Middle East and Africa Market Value (US$ Million) by Usage, 2024 to 2034

Figure 257: Middle East and Africa Market Value (US$ Million) by End-User, 2024 to 2034

Figure 258: Middle East and Africa Market Value (US$ Million) by Country, 2024 to 2034

Figure 259: Middle East and Africa Market Value (US$ Million) Analysis by Country, 2019 to 2034

Figure 260: Middle East and Africa Market Volume (Units) Analysis by Country, 2019 to 2034

Figure 261: Middle East and Africa Market Value Share (%) and BPS Analysis by Country, 2024 to 2034

Figure 262: Middle East and Africa Market Y-o-Y Growth (%) Projections by Country, 2024 to 2034

Figure 263: Middle East and Africa Market Value (US$ Million) Analysis by Product, 2019 to 2034

Figure 264: Middle East and Africa Market Volume (Units) Analysis by Product, 2019 to 2034

Figure 265: Middle East and Africa Market Value Share (%) and BPS Analysis by Product, 2024 to 2034

Figure 266: Middle East and Africa Market Y-o-Y Growth (%) Projections by Product, 2024 to 2034

Figure 267: Middle East and Africa Market Value (US$ Million) Analysis by Type, 2019 to 2034

Figure 268: Middle East and Africa Market Volume (Units) Analysis by Type, 2019 to 2034

Figure 269: Middle East and Africa Market Value Share (%) and BPS Analysis by Type, 2024 to 2034

Figure 270: Middle East and Africa Market Y-o-Y Growth (%) Projections by Type, 2024 to 2034

Figure 271: Middle East and Africa Market Value (US$ Million) Analysis by Compatibility, 2019 to 2034

Figure 272: Middle East and Africa Market Volume (Units) Analysis by Compatibility, 2019 to 2034

Figure 273: Middle East and Africa Market Value Share (%) and BPS Analysis by Compatibility, 2024 to 2034

Figure 274: Middle East and Africa Market Y-o-Y Growth (%) Projections by Compatibility, 2024 to 2034

Figure 275: Middle East and Africa Market Value (US$ Million) Analysis by Usage, 2019 to 2034

Figure 276: Middle East and Africa Market Volume (Units) Analysis by Usage, 2019 to 2034

Figure 277: Middle East and Africa Market Value Share (%) and BPS Analysis by Usage, 2024 to 2034

Figure 278: Middle East and Africa Market Y-o-Y Growth (%) Projections by Usage, 2024 to 2034

Figure 279: Middle East and Africa Market Value (US$ Million) Analysis by End-User, 2019 to 2034

Figure 280: Middle East and Africa Market Volume (Units) Analysis by End-User, 2019 to 2034

Figure 281: Middle East and Africa Market Value Share (%) and BPS Analysis by End-User, 2024 to 2034

Figure 282: Middle East and Africa Market Y-o-Y Growth (%) Projections by End-User, 2024 to 2034

Figure 283: Middle East and Africa Market Attractiveness by Product, 2024 to 2034

Figure 284: Middle East and Africa Market Attractiveness by Type, 2024 to 2034

Figure 285: Middle East and Africa Market Attractiveness by Compatibility, 2024 to 2034

Figure 286: Middle East and Africa Market Attractiveness by Usage, 2024 to 2034

Figure 287: Middle East and Africa Market Attractiveness by End-User, 2024 to 2034

Figure 288: Middle East and Africa Market Attractiveness by Country, 2024 to 2034

Frequently Asked Questions

What is the estimated CAGR of the digital pen market through 2034?

The digital pen market is estimated to propel a CAGR of 13.3% through 2034.

What is the estimated market size of the digital pen market by 2034?

The digital pen market is expected to reach USD 10.5 billion by 2034.

What is the estimated market size of the digital pen market by 2024?

The digital pen market is expected to reach USD 3.0 billion by 2024.

Based on the top product, which category grows most in the digital pen market's material segment through 2034?

The digital pen market's handwriting pen segment will grow at a CAGR of 13.1% through 2034.

Based on end user, which category grows most in the digital pen market's material segment?

The digital pen market's healthcare segment will grow at a CAGR of 12.9% through 2034.

Explore Similar Insights

Future Market Insights

Digital Pen Market