The Impedance-based TEER Measurement System Market is estimated to be valued at USD 83.4 million in 2025 and is projected to reach USD 147.8 million by 2035, registering a compound annual growth rate (CAGR) of 5.9% over the forecast period.
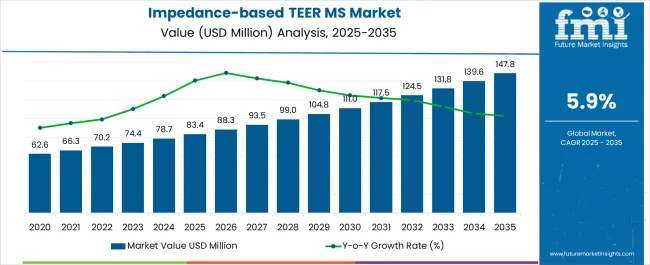
| Metric | Value |
|---|---|
| Impedance-based TEER Measurement System Market Estimated Value in (2025 E) | USD 83.4 million |
| Impedance-based TEER Measurement System Market Forecast Value in (2035 F) | USD 147.8 million |
| Forecast CAGR (2025 to 2035) | 5.9% |
The impedance-based TEER measurement system market is experiencing robust growth. Increasing adoption of advanced cell culture models, rising demand for accurate in vitro barrier integrity assessment, and growth in pharmaceutical and biotechnology research are driving market expansion.
Current dynamics reflect widespread utilization of TEER measurement systems for evaluating tissue permeability and drug transport, while technological advancements in electrode design, automation, and data analytics are enhancing measurement precision and operational efficiency. The future outlook is shaped by growing investment in drug discovery, regenerative medicine, and personalized healthcare research, which are expected to elevate the demand for high-performance TEER systems.
Growth rationale is based on the critical role of these systems in preclinical studies, the need for reliable and reproducible data, and the integration of TEER measurements into standardized laboratory workflows Continued innovation, coupled with strategic distribution and service support, is anticipated to sustain market adoption and ensure steady revenue growth across global research institutions.
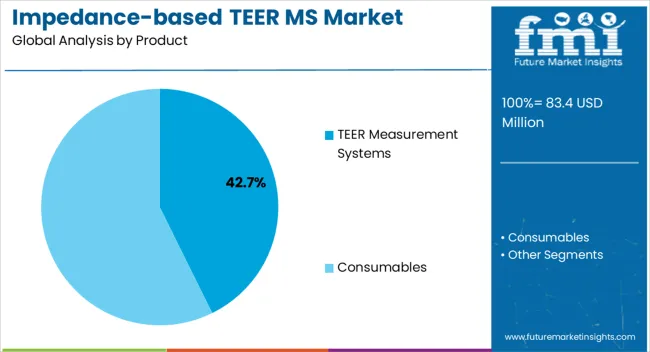
The TEER measurement systems segment, representing 42.7% of the product category, has emerged as the leading product due to its essential role in evaluating epithelial and endothelial barrier function. Adoption has been driven by the system’s high precision, reliability, and compatibility with diverse cell culture models. Performance improvements, including automated electrode arrays and advanced software integration, have enhanced operational efficiency and reproducibility.
Demand has been supported by growing research activity in drug permeability, tissue modeling, and toxicology studies. Manufacturing consistency and compliance with laboratory standards have reinforced market confidence.
Strategic collaborations with research institutions and service providers have expanded accessibility and application scope Ongoing technological enhancements are expected to sustain segment dominance and contribute significantly to the overall market share.
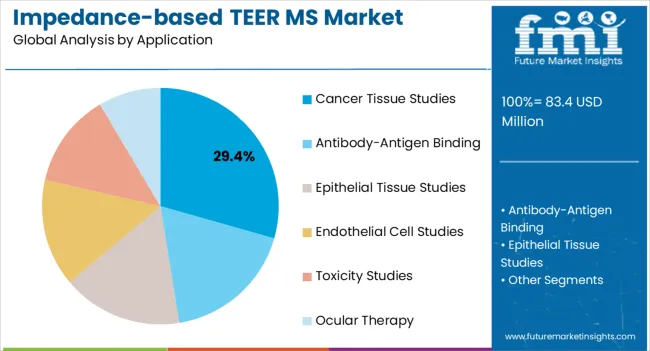
The cancer tissue studies segment, holding 29.4% of the application category, has maintained prominence due to increasing utilization of TEER measurements for assessing tumor barrier integrity and drug transport. Adoption has been facilitated by rising investment in oncology research, the need for predictive in vitro models, and the integration of TEER systems into experimental workflows.
Demand has been supported by regulatory emphasis on preclinical model validation and reproducible results. Technological improvements in measurement sensitivity and data acquisition have enhanced application reliability.
Continued focus on cancer research, combined with advancements in 3D tissue models, is expected to sustain segment share and drive incremental market growth.
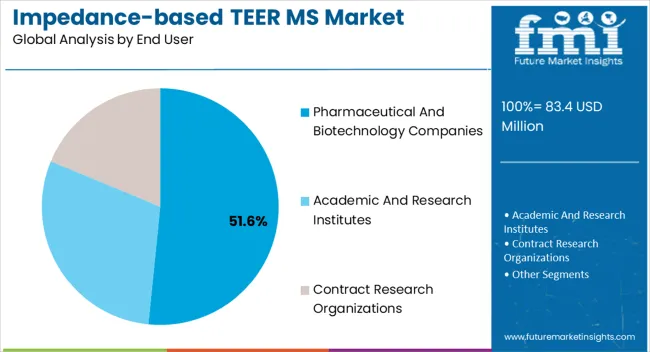
The pharmaceutical and biotechnology companies segment, accounting for 51.6% of the end user category, has emerged as the leading segment due to high demand for TEER systems in drug development, preclinical testing, and translational research. Adoption has been supported by established procurement practices, standardized laboratory protocols, and integration into high-throughput screening workflows.
Operational efficiencies, combined with regulatory compliance and data reliability requirements, have reinforced market leadership. Partnerships with equipment providers and service networks have enhanced accessibility and user support.
Continued expansion of pharmaceutical R&D infrastructure and investment in innovative therapies are expected to sustain segment dominance and support long-term market penetration.
Market to Expand Over 1.8X through 2035
The global impedance-based TEER measurement system market is projected to expand 1.8X through 2035, amid a 1.8% increase in anticipated CAGR compared to the historical one. This is attributable to the expanding field of cell biology and tissue engineering. Increasing drug discovery and drug development and surging demand for non-invasive TEER measurement systems would also drive demand.
Other factors driving impedance-based TEER measurement system market growth include:
Key impedance-based TEER measurement system market trends include:
North America to Remain the Undisputed Market Leader
North America is expected to dominate the global impedance-based transendothelial electrical resistance (TEER) measurement market in 2025 with 43.3% of the share. Research funding, regulatory support, and a culture of innovation would contribute to the market's growth. Other factors boosting the North America impedance-based TEER measurement system industry include-
Technological Advancements: Ongoing technological advancements are paving the way for the development of reliable and more accurate impedance-based TEER measurement systems. For instance, several innovative TEER measurement systems are being developed that use multiple sensors and artificial intelligence to get a more accurate reading. These new advancements are making the systems more attractive to clinicians and wound care professionals, thereby driving their demand.
The demand for impedance-based TEER measurement systems is fueled by the need to reproduce and understand the multi-dimensional interactions within the blood-brain barrier (BBB) in vitro. This is expected to boost the target market through 2035.
The ability to accurately assess the effects of astrocytes, pericytes, and their interactions on the integrity of the blood-brain barrier is paramount in diverse fields such as neuroscience, drug development, and disease modeling. Impedance-based TEER measurement systems are an essential technology to meet this demand and provide researchers with the tools they need to uncover the intricacies of the BBB and its regulation.
The importance of in vitro models for biological barriers has increased significantly, reflecting the growing importance of drug discovery and toxicity assessment. These models replicate important physiological barriers such as the blood-brain barrier, gastrointestinal tract, and pulmonary system.
In the case of the blood-brain barrier, a reliable in vitro setup involves cultivating brain endothelial cells alongside astrocytes, fortifying the barrier's integrity. This system serves as a dependable tool to assess the permeation of pharmaceuticals, which can potentially cause neurotoxicity and impact the barrier itself.
The gastrointestinal tract model is also critical for evaluating how drugs penetrate the epithelial cell layers of the gastric mucosa. The Caco-2 cell line and even primary human GI tract cells are being used to replicate this system and gain insight into drug penetration and potential contaminant entry.
In summary, the increasing focus on drug discovery and toxicity testing is driving the use of in vitro models, particularly those that use impedance-based methods to measure transepithelial electrical resistance (TEER). This will boost sales in the target market.
Global sales of impedance-based TEER measurement systems grew at a CAGR of around 4.4% during the historical period. Total market valuation reached about USD 83.4 million in 2025.
Over the forecast period, the global impedance-based TEER measurement system market is projected to thrive at a CAGR of 6.2%. It is set to total a valuation of USD 147.80 million by 2035.
| Historical CAGR (2020 to 2025) | 4.4% |
|---|---|
| Forecast CAGR (2025 to 2035) | 6.2% |
The advancement in impedance-based TEER measurement systems lies in the integration of additional sensors to monitor critical parameters such as pH or oxygen content. This extension significantly enhances the capabilities of impedance measuring systems, opening up new dimensions in cell analysis and research.
By incorporating pH and oxygen sensors into impedance measuring systems, researchers can simultaneously monitor multiple essential factors that influence cellular behavior. These sensors can be impedance-based, leveraging functionalized electrode surfaces to selectively recognize specific components of the culture medium. This innovation not only provides real-time impedance data but also offers insights into the metabolic and environmental conditions affecting cells.
One prominent example of this hybrid approach is the microfluidic IMOLA-IVD system developed by Cellasys. This system enables the measurement of pH and dissolved oxygen levels, along with impedance readings from cells.
Such integrated systems empower researchers to comprehensively understand how changes in pH and oxygen availability influence cell responses, particularly in drug testing and tissue engineering applications. The development of these novel solutions is expected to boost the market.
Combining impedance flow cytometry and electrical impedance spectroscopy (IS) in a single microfluidic device offers a breakthrough approach to single-cell measurements. As demonstrated by Feng et al., this development enables the assessment of heterogeneous populations of cancer cells individually.
The new advancements have the potential to revolutionize cancer research by allowing investigators to more closely examine the characteristics of diverse cell populations. This will likely bode well for the global impedance-based TEER measurement system market.
The possibilities for integrating additional sensors into impedance-based TEER measurements are significant. The ability to monitor multiple parameters simultaneously would enable researchers to understand how cells interact with their environment and pave the way for advances in personalized medicine, drug discovery, and basic biology.
Technological advancements are expected to propel the global market for impedance-based TEER measurement systems, offering lucrative growth prospects for market players. Hence, a robust CAGR has been predicted for the target market through 2035.
Electrode Contamination and Throughput Limitations
Impedance-based TEER measurement systems hold immense potential for advancing cell analysis and drug discovery. However, as with any technology, there are critical restraints that must be considered to ensure accurate results and optimal utilization of these systems.
Two primary concerns in the impedance-based TEER measurement market are electrode contamination and throughput limitations. These factors are limiting the expansion of the target market to a certain extent.
The accuracy and reliability of impedance-based TEER measurements are contingent upon pristine electrode surfaces. Prior to each measurement, electrodes must undergo meticulous cleaning to prevent the risk of cross-contamination between samples. Neglecting this crucial step can introduce artifacts, leading to inaccurate TEER readings.
Electrode contamination can be attributed to residual molecules or debris from previous measurements, potentially skewing the impedance data. To mitigate this concern, researchers must adhere to stringent cleaning protocols and allocate additional time for electrode preparation.
This necessity for careful cleaning procedures not only extends the experimental timeline but also demands specialized attention, impacting the ease of use of impedance-based TEER systems.
While impedance-based TEER measurement systems offer real-time insights into cellular responses, they can face limitations when it comes to handling multiple samples simultaneously or achieving high throughput. This becomes particularly pertinent in scenarios demanding rapid analysis of several samples, such as high-throughput drug screening or large-scale experiments.
The time required to sequentially measure each sample can be a bottleneck, impeding the efficiency of data generation. Researchers aiming to process a significant number of samples can find their experimental timelines prolonged due to the inherently slower throughput of impedance-based TEER systems. Addressing these restraints presents opportunities for further innovation in impedance-based TEER measurement systems.
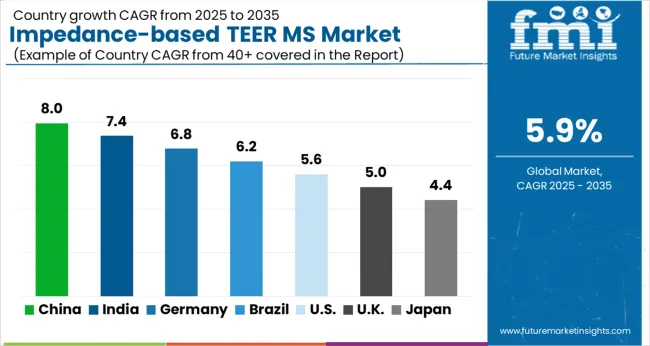
The United States accounted for a 41.6% share of the global impedance-based TEER measurement system market in 2025. Over the assessment period, the United States impedance-based TEER measurement system market is set to thrive at a 5.2% CAGR.
The growth of the biotechnology and tissue engineering sectors in the United States is driving the demand for technologies, including impedance-based TEER measurements. These methods are set to be used to assess the functionality and viability of engineered tissues and organoids.
TEER measurements are projected to be extensively used in pharmaceutical and medical research for studying barrier functions, such as the blood-brain barrier, and for evaluating the effects of drugs on cell layers. The United States market caters to academic and industrial research institutions involved in drug development.
The impedance-based TEER measurement system market in the United States will likely be competitive, with established players as well as new entrants vying for market share. This competition could drive innovation and product improvements.
The growing demand for non-invasive wound assessment methods is expected to improve the United States impedance-based TEER measurement system market share through 2035. These systems are becoming suitable for usage in sensitive populations such as children and the elderly due to their non-invasive and painless nature.
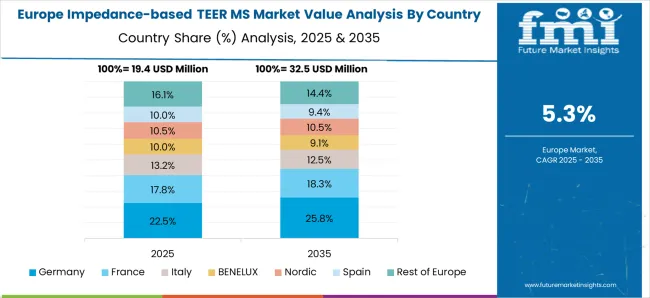
Germany accounted for around 5.2% share of the global impedance-based TEER measurement systems industry in 2025. From 2025 to 2035, the demand for impedance-based TEER measurement systems in the country is set to rise at 4.3% CAGR.
Germany-based companies’ participation in the Impedance-Based Cellular Assays (IBCA) conference is fueling the adoption of impedance-based TEER measurement systems in the country. It highlights their proactive stance in aligning with market trends and technological advancements.
Key Germany-based companies are further participating in different conferences to unveil their technologies and expand their reach. For instance, NanoAnalytics GmbH announced its involvement in the Conference on IBCA in Aachen, Germany, from September 4 to 6, 2025. This is a pivotal factor in raising the adoption of impedance-based TEER measurement systems.
Such conferences serve as a crucial platform for industry leaders, experts, and researchers to share advancements and insights in the field. It also fosters increased awareness and understanding of these measurement technologies in the Germany market.
Germany is estimated to hold a prominent share of the Europe impedance-based TEER measurement system market during the assessment period. This is attributable to the rising geriatric population, increasing research in cell biology and tissue engineering, and expansion of the biopharmaceutical industry.
China accounted for around 8.4% share of the global market in 2025. Over the forecast period, sales of impedance-based TEER measurement systems in China are set to soar at 7.0% CAGR.
In recent years, market players in China have predominantly focused on developing advanced TEER measurement systems with cutting-edge technologies. They are introducing novel solutions and exhibiting them at famous exhibitions to educate people about their benefits.
The Annual Meeting of the Chinese Society for Cell Biology, conducted in Suzhou, China, from April 10 to 14, 2025, served as a significant platform for technological advancements and industry collaboration. Quantum Design China, a notable exhibitor at the event, achieved a noteworthy milestone during the conference by showcasing nanoAnalytics GmbH's state-of-the-art product, cellZscope.
The event provided a unique opportunity for researchers, professionals, and industry enthusiasts to witness firsthand the innovative capabilities of cellZscope in cellular assays and related applications. These developments are expected to ultimately drive the demand for advanced products such as cellZscope in China.
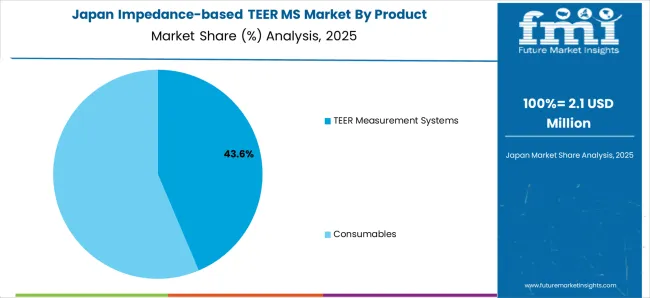
Japan's impedance-based TEER measurement system market size reached USD 83.40 million in 2025. For the projection period, a CAGR of 6.3% has been predicted for Japan market. This is attributable to the rising awareness of the importance of TEER measurement in wound healing and favorable government support.
TEER is set to be a vital indicator of wound healing as it measures the integrity of the epithelial barrier. For conveniently and accurately measuring TEER, end users across Japan are increasingly employing impedance-based TEER measurement systems, thereby boosting the market.
The Japan government is also launching several initiatives to promote the usage of advanced medical technologies in the country. These initiatives are anticipated to fuel the adoption of impedance-based TEER measurement systems in clinics and hospitals across Japan.
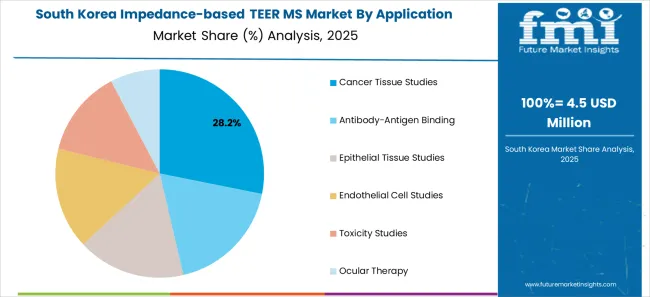
South Korea is expected to emerge as a highly lucrative market for impedance-based TEER measurement system manufacturers. As per the latest analysis, the South Korea impedance-based TEER measurement system market is poised to exhibit a robust CAGR of 7.3% through 2035.
Several factors are expected to drive the impedance-based TEER measurement system market demand in South Korea. These include an aging population, the rising popularity of personalized medicine, and the growing adoption of AI and ML in healthcare.
The rising geriatric population in Korea is leading to an increasing prevalence of chronic diseases such as skin ulcers and diabetes. These diseases can damage skin barriers, causing impaired wound healing and a high risk of infection.
To assess the integrity of the skin barrier and identify patients at risk of complications, TEER measurement systems are widely used across South Korea. This is driving the demand for impedance-based TEER measurement systems in the country, and the trend will likely continue through 2035.
The below section shows the prediction for the TEER measurement systems segment, which is anticipated to hold a dominant share based on product. It is poised to exhibit a CAGR of 6.6% through 2035.
In terms of application, the endothelial cell studies segment is set to lead the market. It will likely thrive at a 6.9% CAGR during the assessment period.
Based on end users, the academic and research institutes segment is projected to generate significant revenue generation opportunities for impedance-based TEER measurement system manufacturers. It is expected to progress at a 6.2% CAGR through 2035.
| Top Segment (Product) | TEER Measurement Systems |
|---|---|
| Predicted CAGR (2025 to 2035) | 6.6% |
As per the new report, the TEER measurement system segment will likely occupy the leading 78.5% share of the global market in 2025. Over the forecast period, the demand for TEER measurement systems is expected to increase at 6.6% CAGR.
The TEER measurement system segment is expected to remain the most lucrative product category through 2035. This is primarily due to the rising usage of in vitro models, such as cell monolayers, tissue barriers, and organ-on-a-chip systems in multiple fields, including pharmaceuticals, biotechnology, and academic research.
TEER measurement systems are expected to be essential tools for characterizing and validating these models, which would drive their demand. They are set to be widely used by clinicians and researchers who study cell barriers and develop drugs and therapies that target cell barriers.
Ongoing advancements in TEER measurement technology have resulted in more accurate, user-friendly, and high-throughput systems. These technological improvements would make TEER measurement systems more attractive to researchers and industry professionals.
The growing popularity of automated TEER measurement systems is expected to boost the target segment during the forecast period. These automated systems would help provide increased speed and throughput, improved reproducibility, and reduced variability, making them attractive to end users.
| Top Segment (Application) | Endothelial Cell Studies |
|---|---|
| Predicted CAGR (2025 to 2035) | 6.9% |
By application, the endothelial cell studies segment is expected to hold a dominant market share of 27.7% in 2025 and will continue to follow a similar trend over the forecast period. As per the latest impedance-based TEER measurement system market analysis, the target segment is set to progress at 6.9% CAGR through 2035.
In neuroscience, the blood-brain barrier is expected to be a critical component that controls the passage of substances between the bloodstream and the brain. Studying endothelial cells using TEER measurements would be vital for understanding brain health, neuroinflammation, and drug delivery to the central nervous system.
Impedance-based TEER measurement systems are becoming ideal for studying the dynamic changes in endothelial cell barrier function in response to stimuli, including drugs and pathogens. This is due to their several advantages, such as non-invasive and continuous nature.
| Top Segment (End User) | Endothelial Cell Studies |
|---|---|
| Predicted CAGR (2025 to 2035) | 6.2% |
Based on end users, the academic and research institutes segment is expected to hold a dominant share of 40.3% in 2025. It is anticipated to exhibit a CAGR of 6.2% throughout the forecast period.
Academic institutions often conduct fundamental research to better understand cellular and tissue biology, barrier function, and disease mechanisms. Impedance-based TEER measurements are essential tools in this research, as they allow scientists to study the integrity of cellular barriers in real-time, providing critical insights into biological processes.
The growing usage of impedance-based TEER measurement systems in academic and research institutes to study a range of biological processes is set to boost the target segment. These systems are expected to be widely used in these institutions as they provide a non-invasive and label-free way to access cell barrier function.
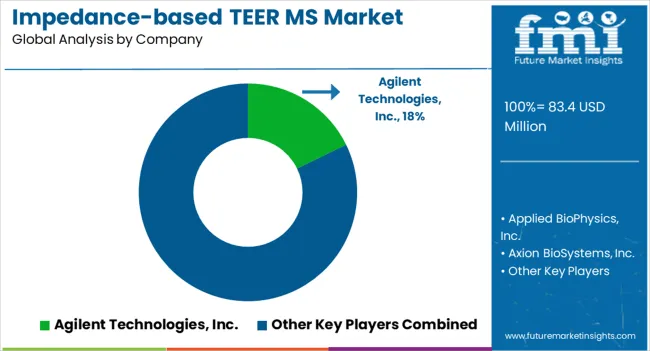
Key manufacturers of impedance-based TEER measurement systems are promoting their products by conducting several events in summer schools and other places. They are actively engaged in the advancement of innovative technologies. They are set to present them at conferences to promote their products.
Recent Developments in the Impedance-based TEER Measurement System Market
| Attribute | Details |
|---|---|
| Estimated Market Value (2025) | USD 83.4 million |
| Projected Market Size (2035) | USD 147.8 million |
| Expected Growth Rate (2025 to 2035) | 5.9% CAGR |
| Forecast Period | 2025 to 2035 |
| Historical Data Available for | 2020 to 2025 |
| Market Analysis | USD Million for Value and Units for Volume |
| Key Countries Covered | United States, Canada, Brazil, Argentina, Mexico, United Kingdom, Germany, Italy, France, Spain, Russia, BENELUX, Nordic Countries, India, Indonesia, Thailand, Malaysia, Philippines, Vietnam, China, Japan, South Korea, Australia, New Zealand, GCC Countries, Türkiye, South Africa, Israel and North Africa |
| Key Market Segments Covered | Product, Application, End User, and Region |
| Key Companies Covered | Applied BioPhysics, Inc.; Axion BioSystems, Inc; SynVivo, Inc.; Mimetas; TissUse GmbH; nanoAnalytics GmbH; SABEU GmbH & Co. KG.; Locsense B.V.; Agilent Technologies, Inc. |
| Report Coverage | Market Forecast, Competition Intelligence, Market Dynamics and Challenges, and Strategic Growth Initiatives |
The global impedance-based TEER measurement system market is estimated to be valued at USD 83.4 million in 2025.
The market size for the impedance-based TEER measurement system market is projected to reach USD 147.8 million by 2035.
The impedance-based TEER measurement system market is expected to grow at a 5.9% CAGR between 2025 and 2035.
The key product types in impedance-based TEER measurement system market are TEER measurement systems, consumables, _culture plates, _culture inserts, _electrodes and _others.
In terms of application, cancer tissue studies segment to command 29.4% share in the impedance-based TEER measurement system market in 2025.


Full Research Suite comprises of:
Market outlook & trends analysis
Interviews & case studies
Strategic recommendations
Vendor profiles & capabilities analysis
5-year forecasts
8 regions and 60+ country-level data splits
Market segment data splits
12 months of continuous data updates
DELIVERED AS:
PDF EXCEL ONLINE
Steerable Needle Market Size and Share Forecast Outlook 2025 to 2035
Steering Wheel Switches Market Size and Share Forecast Outlook 2025 to 2035
Steering Column Control Module Market Growth – Trends & Forecast 2025 to 2035
Steering Stabilizers Market Growth – Trends & Forecast 2025 to 2035
Steering Column Locks Market Growth - Trends & Forecast 2025 to 2035
Steering Tie Rod Market Growth – Trends & Forecast 2024-2034
Steering Gear Market
Steering Wheel Armature Market
Boat Steering Wheels Market Size and Share Forecast Outlook 2025 to 2035
Skid Steer Loader Market Growth - Trends & Forecast 2025 to 2035
Power Steering Filter Market Growth - Trends & Forecast 2025 to 2035
Power Steering Fluids Market
Heated Steering Wheel Market
Marine Steering Systems Market Size and Share Forecast Outlook 2025 to 2035
Rotary Steerable System Market
Adaptive Steering Market Size and Share Forecast Outlook 2025 to 2035
Automotive Steering Knuckle Market Size and Share Forecast Outlook 2025 to 2035
Electrical Steering Column Lock Market Size and Share Forecast Outlook 2025 to 2035
Automotive Steering Column Market
Automotive Steering System Market Growth - Trends & Forecast 2025 to 2035

Thank you!
You will receive an email from our Business Development Manager. Please be sure to check your SPAM/JUNK folder too.
Chat With
MaRIA