Steerable Needle Market Size and Share Forecast Outlook (2023 to 2033)

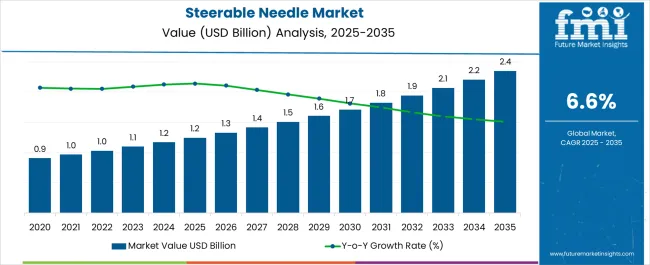
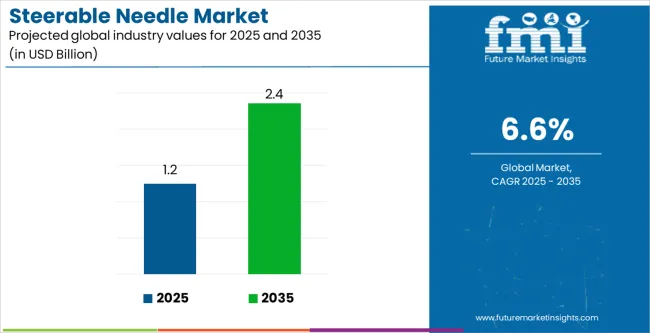
The steerable needle market size is projected to be worth USD 1.09 billion in 2023. The market is likely to surpass USD 2.13 billion by 2033 at a CAGR of 6.9% during the forecast period. With the global population aging rapidly, there is an increased demand for effective diagnostic and treatment solutions for age-related conditions.

Steerable needles are advanced medical devices designed to enhance the precision and accuracy of needle-based procedures, such as biopsies, ablations, and drug delivery.

Other Drivers Propelling the Demand for Steerable Needle Market include:

  • A primary market driver for steerable needles is the rising preference for minimally invasive procedures. The demand for steerable needles with improved maneuverability and targeting capabilities has increased recently as a result of several benefits that these procedures offer, such as decreased discomfort, shorter hospital stays, and quicker recovery.
  • The prevalence of chronic diseases, such as cardiovascular diseases, cancer, and neurological diseases, has increased worldwide. Steerable needles are a crucial part in accurate disease diagnosis, treatment, and drug delivery, which is what is fueling market expansion.
  • Pharmaceutical companies, manufacturers of medical equipment, and research institutions are all making significant investments in the development of steerable needle technology. The launch of novel products with enhanced functionality as a result of this emphasis on research and development has further fueled market growth.

Challenges for Companies /Manufacturers in the Steerable Needle Market:

  • Due to their advanced features and technologies, steerable needles might be costly. The costly nature of these tools may limit their use, particularly in developing economies with budget constraints.
  • The steerable needle market is subject to stringent oversight to protect patient safety. Obtaining regulatory approvals and adhering to different regional standards can be a complex and time-consuming procedure, providing a challenge for market players.
  • Steerable needles require distinctive training and expertise. The scarcity of medical professionals proficient in using these devices may impede their general adoption, particularly in certain regions.

Opportunities in the Steerable Needle Industry:

  • The use of interventional radiology procedures, such as image-guided biopsies, ablations, and vascular treatments, is increasing. Steerable needles are essential in these treatments as they allow for precise targeting while reducing harm to surrounding tissues. Steerable needle manufacturers could profit particularly from the increasing field of interventional radiology.
  • The growing emphasis on targeted drug administration, particularly in oncology, generates a significant opportunity for steerable needles market. These needles can administer therapeutic medications precisely to specific tumor areas, decreasing systemic side effects and enhancing treatment success.
  • The integration of steerable needles with robotic-assisted systems represents a considerable market expansion opportunity. Robotic platforms provide increased precision and flexibility, allowing for more complex maneuvers and better results in needle-based treatments.

Latest Trends in the Steerable Needle Market:

  • Smart needle technologies with sensors and feedback mechanisms are emerging as an industry trend. These needles give clinicians with real-time information regarding tissue properties, vessel proximity, and needle direction, allowing them to make informed decisions during procedures.
  • Concerns about infection control and patient safety are driving up demand for disposable and single-use medical devices. Steerable needles are being developed by manufacturers to be used for a single treatment and then discarded, decreasing the danger of cross-contamination and simplifying workflow in healthcare settings.
  • The steerable needle market is also being influenced by the tendency toward reduction in size of medical devices and the addition of wireless connectivity. Smaller, wirelessly enabled steerable needles provide increased flexibility, convenience of use, and compatibility with other medical equipment, all of which contribute to enhanced procedural efficiency.
Attributes Details
Steerable Needle Market Size (2023) USD 1.09 billion
Steerable Needle Market Projected Size (2033) USD 2.13 billion
Value CAGR (2023 to 2033) 6.9%

Comparison of Historical vs Future Outlook on Steerable Needle Demand (2017 to 2022 vs 2023 to 2033)

From 2017 to 2022, the global steerable needle market experienced a CAGR of 5.7%, reaching a market size of USD 1.09 billion in 2023.

Worldwide, there is a significant shift toward minimally invasive procedures. Steerable needles allow practitioners to perform precise and targeted interventions while causing minimum tissue damage, reducing patient discomfort, and allowing for shorter recovery times. As a result, demand for steerable needles is projected to rise as medical professionals seek to provide patients with minimally invasive alternatives.

Personalized medicine, in which therapies are tailored to specific patients, is gaining popularity. Steerable needles enable targeted drug delivery and precise interventions based on individual patient characteristics. The demand for steerable needles is projected to rise as personalized treatment becomes more common.

Future Forecast for Steerable Needle Industry:

Looking ahead, the global steerable needle market is expected to rise at a CAGR of 6.9% from 2023 to 2033. During the forecast period, the market size is expected to reach USD 2.13 billion by 2033.

The steerable needle market is seeing growth opportunities in developing regions such as Asia-Pacific and Latin America. These regions are undergoing tremendous economic development, as well as improvements in healthcare infrastructure and increased investments in healthcare technologies. Steerable needles are predicted to become more popular in these markets as access to modern medical technologies improves.

Steerable needles are in demand due to technological improvements such as robotic-assisted steering mechanisms, real-time imaging guiding, and sensor-enabled navigation systems. These developments improve the precision, accuracy, and safety of needle-based operations, resulting in increased utilization by healthcare practitioners.
Country-Wise Insights on Steerable Needle Market Trends

How is the USA Market Growing?

Country The United States
Market Size (USD million) by End of Forecast Period (2033) USD 676.0 million
CAGR % 2023 to End of Forecast (2033) 7.0%

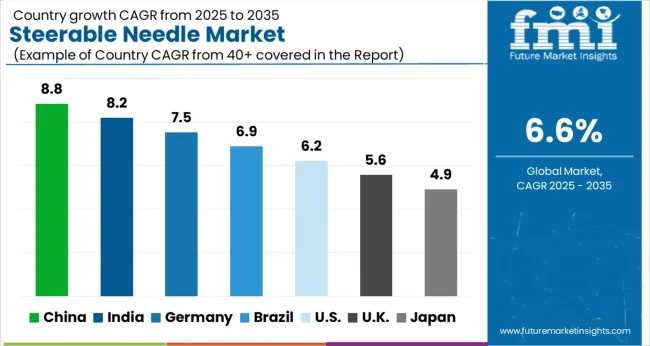
The steerable needle market in the United States is expected to reach a market size of USD 676.0 million by 2033, expanding at a CAGR of 7.0%. In the USA, the market expansion is fueled by factors such as the increasing adoption of minimally invasive procedures, a rising incidence of chronic diseases, advancements in needle technology, and a growing emphasis on personalized medicine. Also, the aging population and investments in healthcare infrastructure contribute to the market's growth.

The UK is Expected to Witness Significant Growth Attributed to Availability of Advanced Healthcare Infrastructure.

Country The United Kingdom
Market Size (USD million) by End of Forecast Period (2033) USD 116.3 million
CAGR % 2023 to End of Forecast (2033) 7.2%

The steerable needle market in the United Kingdom is expected to reach a market value of USD 116.3 million, expanding at a CAGR of 7.2% during the forecast period. The market in the UK is expected to witness significant growth in the coming years. The UK's focus on healthcare advancements, investments in research and development, and the availability of advanced healthcare infrastructure contribute to the market's expansion. The market is poised to benefit from the increasing demand for precise and targeted interventions, driving the growth of the steerable needle market in the UK.

Why China is a Key Market in East Asia Steerable Needle Market?

Country China
Market Size (USD million) by End of Forecast Period (2033) USD 147.8 million
CAGR % 2023 to End of Forecast (2033) 7.6%

The steerable needle market in China is anticipated to reach a market size of USD 147.8 million by the end of 2033, growing at a CAGR of 7.6% throughout the forecast period. With rising income levels and increased awareness of advanced healthcare technologies, the demand for precise and targeted interventions is growing in China. Patients are seeking high-quality medical treatments, leading to increased adoption of steerable needles by healthcare providers to meet the rising demand.
Well Developed Healthcare Infrastructure Have Led the Market Flourish Substantially in Japan.

Country Japan
Market Size (USD million) by End of Forecast Period (2033) USD 107.6 million
CAGR % 2023 to End of Forecast (2033) 7.5%

The steerable needle market in Japan is estimated to reach a market size of USD 107.6 million by 2033, expected to thrive at a CAGR of 7.5%. Japan boasts a robust healthcare infrastructure, with well-equipped hospitals, research institutes, and skilled healthcare professionals. The presence of advanced healthcare facilities and a highly trained medical workforce supports the adoption of advanced medical devices like steerable needles. The strong healthcare infrastructure acts as a catalyst for market growth.

Demand for Steerable Needle Market is Rising Due to Strong Healthcare Infrastructure.

Country South Korea
Market Size (USD million) by End of Forecast Period (2033) USD 121.9 million
CAGR % 2023 to End of Forecast (2033) 7.2%

The steerable needle market in South Korea is expected to reach a market size of USD 121.9 million, expanding at a CAGR of 7.2% during the forecast period. South Korea has witnessed an increasing preference for minimally invasive procedures across various medical specialties. Steerable needles are essential tools in performing precise and targeted interventions with minimal tissue disruption, reduced patient discomfort, and faster recovery times. The rising demand for minimally invasive procedures has led to an increased adoption of steerable needles in the country.

Category-Wise Insights into Steerable Needle Applications

Which Product is Predominantly in Demand in the Global Scenario?

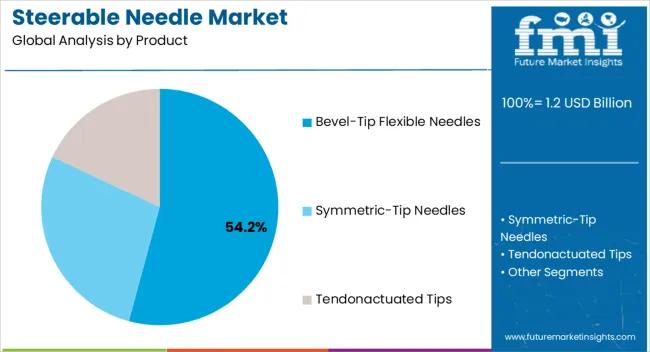
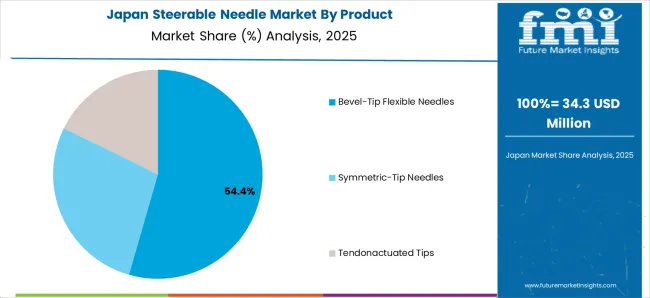
Based on products, bevel-tip flexible needles dominated the category withholding the significant share of the market at around 38.9% at the end of 2022. Bevel-tip flexible needles are designed with a flexible shaft that allows for greater maneuverability and navigation through complex anatomical structures.

Over time, surgeons have become accustomed to using bevel-tip flexible needles due to their widespread availability and advantages. Familiarity and positive experiences with these needles lead to their continued adoption in the field.

Why Steerable Needles are Getting Widely Utilized for Biopsies?

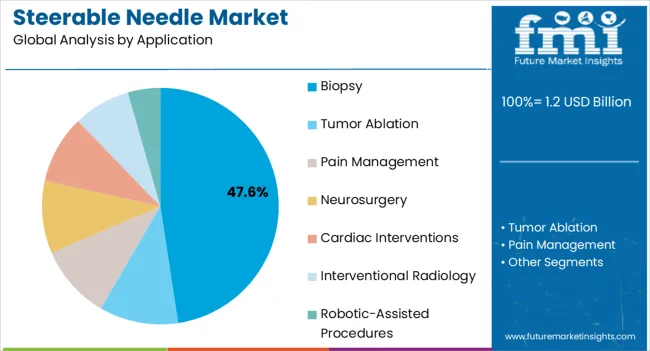
Based on application, biopsy segment has led the category withholding about 24.5% of the total market share. Steerable needles enable a minimally invasive approach to biopsies. Compared to traditional open surgical procedures, steerable needles can be inserted through small incisions or even percutaneously, resulting in less tissue trauma, reduced scarring, shorter recovery times, and lower risks of complications.

  • The minimally invasive nature of steerable needle biopsies generally leads to reduced patient discomfort compared to open surgical biopsies which results in result in less pain, reduced tissue trauma, and shorter recovery times, enhancing patient comfort and satisfaction.

Which End User Has Widely Adopted the Steerable Needle Devices?

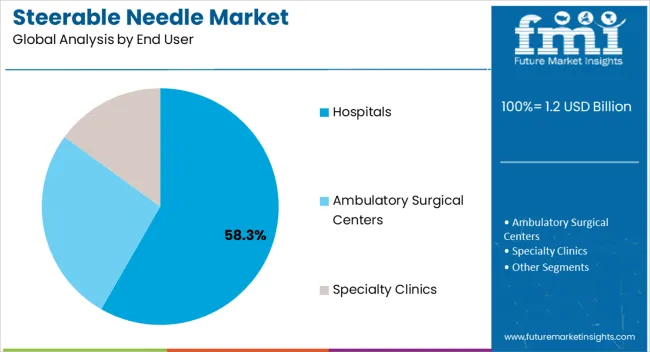
The hospitals have led the steerable needle market as the leading end user with the market share of 59.4% in 2022. Hospitals are full-service medical facilities that offer a wide range of medical services, including diagnostic tests. They have the infrastructure, technology, and competence to provide a wide range of diagnostic tests, treatments and services, which demands the need for needles, including steerable needles.
How Key Players Stay Competitive in the Steerable Needle Industry

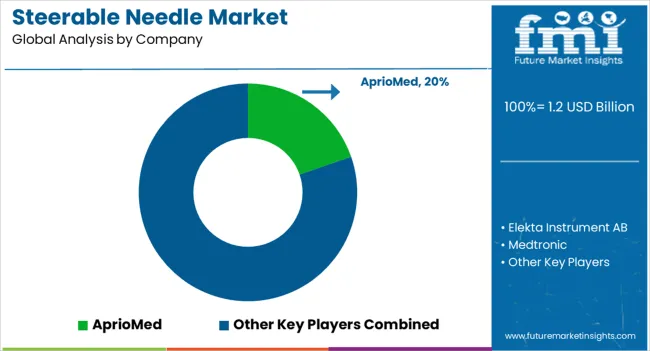
The steerable needle market has undergone market consolidation, with key players establishing and vying to maintain their competitive edge. Key players in the steerable needle industry are using certain strategies to stay competitive, such as differentiating their offerings, and adapting to evolving market dynamics. Continuous innovation, strong partnerships, regulatory compliance, and strategic market expansion.

Key Strategies Used by the Participants

Product Innovation

Key players continuously invest in research and development to introduce innovative products. They strive to develop assays with improved sensitivity, specificity, accuracy, and ease of use.

Strategic Partnerships and Collaborations

Key players often form strategic partnerships and collaborations with other companies, research institutions, and healthcare organizations. These partnerships can lead to knowledge sharing, joint product development, and expanded market reach.

Expansion into Emerging Markets

Expanding into emerging markets with growing healthcare infrastructure and rising demand for steerable needles allows companies to tap into new opportunities and gain a competitive edge.

Mergers and Acquisitions

Companies in the market may engage in mergers or acquisitions to streamline their product portfolio, obtain new technologies, enter new market niches, and gain access to novel products or intellectual property.

Key Players in the Steerable Needle Industry

  • AprioMed
  • Elekta Instrument AB,
  • Medtronic
  • Boston Scientific
  • Cook Medical
  • Olympus Corporation
  • Terumo Corporation
  • Merit Medical Systems
  • Vygon
  • Johnson & Johnson
  • B. Braun Melsungen AG
  • Stryker Corporation
  • Smith & Nephew
  • AngioDynamics Inc.
  • Teleflex Incorporated
  • Argon Medical Devices Inc.
  • BD (Becton, Dickinson and Company)
  • Cardinal Health Inc.
  • Teleflex Medical OEM
  • ConMed Corporation
  • Mindray Medical International Limited
  • Hologic Inc.

Key Developments in the Steerable Needle Market:

  • In May 2021, Olympus Corporation announced the availability of the licensed BF-UC190F, which was the newest addition to their strong EBUS range of devices back then for less intrusive lung cancer detection by needle biopsy.

Segmentation Analysis of the Steerable Needle Market

By Product:

  • Bevel-Tip Flexible Needles
  • Symmetric-Tip Needles
  • Tendonactuated Tips

By Application:

  • Biopsy
  • Tumor Ablation
  • Pain Management
  • Neurosurgery
  • Cardiac Interventions
  • Interventional Radiology
  • Robotic-Assisted Procedures

By End User:

  • Hospitals
  • Ambulatory Surgical Centers
  • Specialty Clinics

By Region:

  • North America
  • Latin America
  • Europe
  • East Asia
  • South Asia
  • Oceania
  • The Middle East & Africa

Table of Content

  • 1. Executive Summary
  • 2. Market Overview
  • 3. Key Market Trends
  • 4. Value Added Insights
  • 5. Market Background
  • 6. Global Market Demand (in Value or Size in USD Million) Analysis 2017 to 2022 and Forecast, 2023 to 2033
  • 7. Global Market Analysis 2017 to 2022 and Forecast 2023 to 2033, By Product
    • 7.1. Bevel-Tip Flexible Needles
    • 7.2. Symmetric-Tip Needles
    • 7.3. Tendonactuated Tips
  • 8. Global Market Analysis 2017 to 2022 and Forecast 2023 to 2033, By Application
    • 8.1. Biopsy
    • 8.2. Tumor Ablation
    • 8.3. Pain Management
    • 8.4. Neurosurgery
    • 8.5. Cardiac Interventions
    • 8.6. Interventional Radiology
    • 8.7. Robotic-Assisted Procedures
  • 9. Global Market Analysis 2017 to 2022 and Forecast 2023 to 2033, By End User
    • 9.1. Hospitals
    • 9.2. Ambulatory Surgical Centers
    • 9.3. Specialty Clinics
  • 10. Global Market Analysis 2017 to 2022 and Forecast 2023 to 2033, by Region
    • 10.1. North America
    • 10.2. Latin America
    • 10.3. Europe
    • 10.4. South Asia
    • 10.5. East Asia
    • 10.6. Oceania
    • 10.7. Middle East & Africa
  • 11. North America Market Analysis 2017 to 2022 and Forecast 2023 to 2033
  • 12. Latin America Market Analysis 2017 to 2022 and Forecast 2023 to 2033
  • 13. Europe Market Analysis 2017 to 2022 and Forecast 2023 to 2033
  • 14. East Asia Market Analysis 2017 to 2022 and Forecast 2023 to 2033
  • 15. South Asia Market Analysis 2017 to 2022 and Forecast 2023 to 2033
  • 16. Oceania Market Analysis 2017 to 2022 and Forecast 2023 to 2033
  • 17. Middle East & Africa Market Analysis 2017 to 2022 and Forecast 2023 to 2033
  • 18. Market Structure Analysis
  • 19. Competition Analysis
    • 19.1. AprioMed
    • 19.2. Elekta Instrument AB
    • 19.3. Medtronic
    • 19.4. Boston Scientific
    • 19.5. Cook Medical
    • 19.6. Olympus Corporation
    • 19.7. Terumo Corporation
    • 19.8. Merit Medical Systems
    • 19.9. Vygon
    • 19.10. Johnson & Johnson
    • 19.11. B. Braun Melsungen AG
    • 19.12. Stryker Corporation
    • 19.13. Smith & Nephew
    • 19.14. AngioDynamics Inc.
    • 19.15. Teleflex Incorporated
    • 19.16. Argon Medical Devices Inc.
    • 19.17. BD (Becton, Dickinson and Company)
    • 19.18. Cardinal Health Inc.
    • 19.19. Teleflex Medical OEM
    • 19.20. ConMed Corporation
    • 19.21. Mindray Medical International Limited
    • 19.22. Hologic Inc.
  • 20. Assumptions and Acronyms Used
  • 21. Research Methodology

List of Tables

Table 01: Global Market Analysis 2017 to 2022 and Forecast 2023 to 2033, by Product

Table 02: Global Market Analysis 2017 to 2022 and Forecast 2023 to 2033by Application

Table 03: Global Market Analysis 2017 to 2022 and Forecast 2023 to 2033, by End User

Table 04: Global Market Analysis 2017 to 2022 and Forecast 2023 to 2033, by Region

Table 05: North America Market Value (US$ Million) Analysis 2017 to 2022 and Forecast 2023 to 2033, by Country

Table 06: North America Market Value (US$ Million) Analysis 2017 to 2022 and Forecast 2023 to 2033, by Product

Table 07: North America Market Value (US$ Million) Analysis 2017 to 2022 and Forecast 2023 to 2033, by Application

Table 08: North America Market Value (US$ Million) Analysis 2017 to 2022 and Forecast 2023 to 2033, by End User

Table 09: Latin America Market Value (US$ Million) Analysis 2017 to 2022 and Forecast 2023 to 2033, by Country

Table 10: Latin America Market Value (US$ Million) Analysis 2017 to 2022 and Forecast 2023 to 2033, by Product

Table 11: Latin America Market Value (US$ Million) Analysis 2017 to 2022 and Forecast 2023 to 2033, by Application

Table 12: Latin America Market Value (US$ Million) Analysis 2017 to 2022 and Forecast 2023 to 2033, by End User

Table 13: Europe Market Value (US$ Million) Analysis 2017 to 2022 and Forecast 2023 to 2033, by Country

Table 14: Europe Market Value (US$ Million) Analysis 2017 to 2022 and Forecast 2023 to 2033, by Product

Table 15: Europe Market Analysis 2017 to 2022 and Forecast 2023 to 2033by Application

Table 16: Europe Market Value (US$ Million) Analysis 2017 to 2022 and Forecast 2023 to 2033, by End User

Table 17: East Asia Market Value (US$ Million) Analysis 2017 to 2022 and Forecast 2023 to 2033, by Country

Table 18: East Asia Market Value (US$ Million) Analysis 2017 to 2022 and Forecast 2023 to 2033, by Product

Table 19: East Asia Market Value (US$ Million) Analysis 2017 to 2022 and Forecast 2023 to 2033, by Application

Table 20: East Asia Market Value (US$ Million) Analysis 2017 to 2022 and Forecast 2023 to 2033, by End User

Table 21: South Asia Market Value (US$ Million) Analysis 2017 to 2022 and Forecast 2023 to 2033, by Country

Table 22: South Asia Market Value (US$ Million) Analysis 2017 to 2022 and Forecast 2023 to 2033, by Product

Table 23: South Asia Market Value (US$ Million) Analysis 2017 to 2022 and Forecast 2023 to 2033, by Application

Table 24: South Asia Market Value (US$ Million) Analysis 2017 to 2022 and Forecast 2023 to 2033, by End User

Table 25: Oceania Market Value (US$ Million) Analysis 2017 to 2022 and Forecast 2023 to 2033, by Country

Table 26: Oceania Market Value (US$ Million) Analysis 2017 to 2022 and Forecast 2023 to 2033, by Product

Table 27: Oceania Market Analysis 2017 to 2022 and Forecast 2023 to 2033by Application

Table 28: Oceania Market Value (US$ Million) Analysis 2017 to 2022 and Forecast 2023 to 2033, by End User

Table 29: Middle East & Africa Market Value (US$ Million) Analysis 2017 to 2022 and Forecast 2023 to 2033, by Country

Table 30: Middle East & Africa Market Value (US$ Million) Analysis 2017 to 2022 and Forecast 2023 to 2033, by Product

Table 31: Middle East & Africa Market Analysis 2017 to 2022 and Forecast 2023 to 2033by Application

Table 32: Middle East & Africa Market Value (US$ Million) Analysis 2017 to 2022 and Forecast 2023 to 2033, by End User

List of Figures

Figure 01: Global Market Value (US$ Million) Analysis, 2017 to 2022

Figure 02: Global Market Forecast & Y-o-Y Growth, 2023 to 2033

Figure 03: Global Market Absolute $ Opportunity (US$ Million) Analysis, 2023 to 2033

Figure 04: Global Market Value Share (%) Analysis 2023 and 2033, by Product

Figure 05: Global Market Y-o-Y Growth (%) Analysis 2023 to 2033, by Product

Figure 06: Global Market Attractiveness Analysis 2023 to 2033, by Product

Figure 07: Global Market Value Share (%) Analysis 2023 and 2033, by Application

Figure 08: Global Market Y-o-Y Growth (%) Analysis 2023 to 2033, by Application

Figure 09: Global Market Attractiveness Analysis 2023 to 2033, by Application

Figure 10: Global Market Value Share (%) Analysis 2023 and 2033, by End User

Figure 11: Global Market Y-o-Y Growth (%) Analysis 2023 to 2033, by End User

Figure 12: Global Market Attractiveness Analysis 2023 to 2033, by End User

Figure 13: Global Market Value Share (%) Analysis 2023 and 2033, by Region

Figure 14: Global Market Y-o-Y Growth (%) Analysis 2023 to 2033, by Region

Figure 15: Global Market Attractiveness Analysis 2023 to 2033, by Region

Figure 16: North America Market Value (US$ Million) Analysis, 2017 to 2022

Figure 17: North America Market Value (US$ Million) Forecast, 2023 to 2033

Figure 18: North America Market Value Share, by Product (2023 E)

Figure 19: North America Market Value Share, by Application (2023 E)

Figure 20: North America Market Value Share, by End User (2023 E)

Figure 21: North America Market Value Share, by Country (2023 E)

Figure 22: North America Market Attractiveness Analysis by Product, 2023 to 2033

Figure 23: North America Market Attractiveness Analysis by Application, 2023 to 2033

Figure 24: North America Market Attractiveness Analysis by End User, 2023 to 2033

Figure 25: North America Market Attractiveness Analysis by Country, 2023 to 2033

Figure 26: USA Market Value Proportion Analysis, 2022

Figure 27: Global Vs. USA Growth Comparison

Figure 28: USA Market Share Analysis (%) by Product, 2022 & 2033

Figure 29: USA Market Share Analysis (%) by Application, 2022 & 2033

Figure 30: USA Market Share Analysis (%) by End User, 2022 & 2033

Figure 31: Canada Market Value Proportion Analysis, 2022

Figure 32: Global Vs. Canada. Growth Comparison

Figure 33: Canada Market Share Analysis (%) by Product, 2022 & 2033

Figure 34: Canada Market Share Analysis (%) by Application, 2022 & 2033

Figure 35: Canada Market Share Analysis (%) by End User, 2022 & 2033

Figure 36: Latin America Market Value (US$ Million) Analysis, 2017 to 2022

Figure 37: Latin America Market Value (US$ Million) Forecast, 2023 to 2033

Figure 38: Latin America Market Value Share, by Product (2023 E)

Figure 39: Latin America Market Value Share, by Application (2023 E)

Figure 40: Latin America Market Value Share, by End User (2023 E)

Figure 41: Latin America Market Value Share, by Country (2023 E)

Figure 42: Latin America Market Attractiveness Analysis by Product, 2023 to 2033

Figure 43: Latin America Market Attractiveness Analysis by Application, 2023 to 2033

Figure 44: Latin America Market Attractiveness Analysis by End User, 2023 to 2033

Figure 45: Latin America Market Attractiveness Analysis by Country, 2023 to 2033

Figure 46: Mexico Market Value Proportion Analysis, 2022

Figure 47: Global Vs Mexico Growth Comparison

Figure 48: Mexico Market Share Analysis (%) by Product, 2022 & 2033

Figure 49: Mexico Market Share Analysis (%) by Application, 2022 & 2033

Figure 50: Mexico Market Share Analysis (%) by End User, 2022 & 2033

Figure 51: Brazil Market Value Proportion Analysis, 2022

Figure 52: Global Vs. Brazil. Growth Comparison

Figure 53: Brazil Market Share Analysis (%) by Product, 2022 & 2033

Figure 54: Brazil Market Share Analysis (%) by Application, 2022 & 2033

Figure 55: Brazil Market Share Analysis (%) by End User, 2022 & 2033

Figure 56: Argentina Market Value Proportion Analysis, 2022

Figure 57: Global Vs Argentina Growth Comparison

Figure 58: Argentina Market Share Analysis (%) by Product, 2022 & 2033

Figure 59: Argentina Market Share Analysis (%) by Application, 2022 & 2033

Figure 60: Argentina Market Share Analysis (%) by End User, 2022 & 2033

Figure 61: Europe Market Value (US$ Million) Analysis, 2017 to 2022

Figure 62: Europe Market Value (US$ Million) Forecast, 2023 to 2033

Figure 63: Europe Market Value Share, by Product (2023 E)

Figure 64: Europe Market Value Share, by Application (2023 E)

Figure 65: Europe Market Value Share, by End User (2023 E)

Figure 66: Europe Market Value Share, by Country (2023 E)

Figure 67: Europe Market Attractiveness Analysis by Product, 2023 to 2033

Figure 68: Europe Market Attractiveness Analysis by Application, 2023 to 2033

Figure 69: Europe Market Attractiveness Analysis by End User, 2023 to 2033

Figure 70: Europe Market Attractiveness Analysis by Country, 2023 to 2033

Figure 71: UK Market Value Proportion Analysis, 2022

Figure 72: Global Vs. UK Growth Comparison

Figure 73: UK Market Share Analysis (%) by Product, 2022 & 2033

Figure 74: UK Market Share Analysis (%) by Application, 2022 & 2033

Figure 75: UK Market Share Analysis (%) by End User, 2022 & 2033

Figure 76: Germany Market Value Proportion Analysis, 2022

Figure 77: Global Vs. Germany Growth Comparison

Figure 78: Germany Market Share Analysis (%) by Product, 2022 & 2033

Figure 79: Germany Market Share Analysis (%) by Application, 2022 & 2033

Figure 80: Germany Market Share Analysis (%) by End User, 2022 & 2033

Figure 81: Italy Market Value Proportion Analysis, 2022

Figure 82: Global Vs. Italy Growth Comparison

Figure 83: Italy Market Share Analysis (%) by Product, 2022 & 2033

Figure 84: Italy Market Share Analysis (%) by Application, 2022 & 2033

Figure 85: Italy Market Share Analysis (%) by End User, 2022 & 2033

Figure 86: France Market Value Proportion Analysis, 2022

Figure 87: Global Vs France Growth Comparison

Figure 88: France Market Share Analysis (%) by Product, 2022 & 2033

Figure 89: France Market Share Analysis (%) by Application, 2022 & 2033

Figure 90: France Market Share Analysis (%) by End User, 2022 & 2033

Figure 91: Spain Market Value Proportion Analysis, 2022

Figure 92: Global Vs Spain Growth Comparison

Figure 93: Spain Market Share Analysis (%) by Product, 2022 & 2033

Figure 94: Spain Market Share Analysis (%) by Application, 2022 & 2033

Figure 95: Spain Market Share Analysis (%) by End User, 2022 & 2033

Figure 96: Russia Market Value Proportion Analysis, 2022

Figure 97: Global Vs Russia Growth Comparison

Figure 98: Russia Market Share Analysis (%) by Product, 2022 & 2033

Figure 99: Russia Market Share Analysis (%) by Application, 2022 & 2033

Figure 100: Russia Market Share Analysis (%) by End User, 2022 & 2033

Figure 101: BENELUX Market Value Proportion Analysis, 2022

Figure 102: Global Vs BENELUX Growth Comparison

Figure 103: BENELUX Market Share Analysis (%) by Product, 2022 & 2033

Figure 104: BENELUX Market Share Analysis (%) by Application, 2022 & 2033

Figure 105: BENELUX Market Share Analysis (%) by End User, 2022 & 2033

Figure 106: East Asia Market Value (US$ Million) Analysis, 2017 to 2022

Figure 107: East Asia Market Value (US$ Million) Forecast, 2023 to 2033

Figure 108: East Asia Market Value Share, by Product (2023 E)

Figure 109: East Asia Market Value Share, by Application (2023 E)

Figure 110: East Asia Market Value Share, by End User (2023 E)

Figure 111: East Asia Market Value Share, by Country (2023 E)

Figure 112: East Asia Market Attractiveness Analysis by Product, 2023 to 2033

Figure 113: East Asia Market Attractiveness Analysis by Application, 2023 to 2033

Figure 114: East Asia Market Attractiveness Analysis by End User, 2023 to 2033

Figure 115: East Asia Market Attractiveness Analysis by Country, 2023 to 2033

Figure 116: China Market Value Proportion Analysis, 2022

Figure 117: Global Vs. China Growth Comparison

Figure 118: China Market Share Analysis (%) by Product, 2022 & 2033

Figure 119: China Market Share Analysis (%) by Application, 2022 & 2033

Figure 120: China Market Share Analysis (%) by End User, 2022 & 2033

Figure 121: Japan Market Value Proportion Analysis, 2022

Figure 122: Global Vs. Japan Growth Comparison

Figure 123: Japan Market Share Analysis (%) by Product, 2022 & 2033

Figure 124: Japan Market Share Analysis (%) by Application, 2022 & 2033

Figure 125: Japan Market Share Analysis (%) by End User, 2022 & 2033

Figure 126: South Korea Market Value Proportion Analysis, 2022

Figure 127: Global Vs South Korea Growth Comparison

Figure 128: South Korea Market Share Analysis (%) by Product, 2022 & 2033

Figure 129: South Korea Market Share Analysis (%) by Application, 2022 & 2033

Figure 130: South Korea Market Share Analysis (%) by End User, 2022 & 2033

Figure 131: South Asia Market Value (US$ Million) Analysis, 2017 to 2022

Figure 132: South Asia Market Value (US$ Million) Forecast, 2023 to 2033

Figure 133: South Asia Market Value Share, by Product (2023 E)

Figure 134: South Asia Market Value Share, by Application (2023 E)

Figure 135: South Asia Market Value Share, by End User (2023 E)

Figure 136: South Asia Market Value Share, by Country (2023 E)

Figure 137: South Asia Market Attractiveness Analysis by Product, 2023 to 2033

Figure 138: South Asia Market Attractiveness Analysis by Application, 2023 to 2033

Figure 139: South Asia Market Attractiveness Analysis by End User, 2023 to 2033

Figure 140: South Asia Market Attractiveness Analysis by Country, 2023 to 2033

Figure 141: India Market Value Proportion Analysis, 2022

Figure 142: Global Vs. India Growth Comparison

Figure 143: India Market Share Analysis (%) by Product, 2022 & 2033

Figure 144: India Market Share Analysis (%) by Application, 2022 & 2033

Figure 145: India Market Share Analysis (%) by End User, 2022 & 2033

Figure 146: Indonesia Market Value Proportion Analysis, 2022

Figure 147: Global Vs. Indonesia Growth Comparison

Figure 148: Indonesia Market Share Analysis (%) by Product, 2022 & 2033

Figure 149: Indonesia Market Share Analysis (%) by Application, 2022 & 2033

Figure 150: Indonesia Market Share Analysis (%) by End User, 2022 & 2033

Figure 151: Malaysia Market Value Proportion Analysis, 2022

Figure 152: Global Vs. Malaysia Growth Comparison

Figure 153: Malaysia Market Share Analysis (%) by Product, 2022 & 2033

Figure 154: Malaysia Market Share Analysis (%) by Application, 2022 & 2033

Figure 155: Malaysia Market Share Analysis (%) by End User, 2022 & 2033

Figure 156: Thailand Market Value Proportion Analysis, 2022

Figure 157: Global Vs. Thailand Growth Comparison

Figure 158: Thailand Market Share Analysis (%) by Product, 2022 & 2033

Figure 159: Thailand Market Share Analysis (%) by Application, 2022 & 2033

Figure 160: Thailand Market Share Analysis (%) by End User, 2022 & 2033

Figure 161: Oceania Market Value (US$ Million) Analysis, 2017 to 2022

Figure 162: Oceania Market Value (US$ Million) Forecast, 2023 to 2033

Figure 163: Oceania Market Value Share, by Product (2023 E)

Figure 164: Oceania Market Value Share, by Application (2023 E)

Figure 165: Oceania Market Value Share, by End User (2023 E)

Figure 166: Oceania Market Value Share, by Country (2023 E)

Figure 167: Oceania Market Attractiveness Analysis by Product, 2023 to 2033

Figure 168: Oceania Market Attractiveness Analysis by Application, 2023 to 2033

Figure 169: Oceania Market Attractiveness Analysis by End User, 2023 to 2033

Figure 170: Oceania Market Attractiveness Analysis by Country, 2023 to 2033

Figure 171: Australia Market Value Proportion Analysis, 2022

Figure 172: Global Vs. Australia Growth Comparison

Figure 173: Australia Market Share Analysis (%) by Product, 2022 & 2033

Figure 174: Australia Market Share Analysis (%) by Application, 2022 & 2033

Figure 175: Australia Market Share Analysis (%) by End User, 2022 & 2033

Figure 176: New Zealand Market Value Proportion Analysis, 2022

Figure 177: Global Vs New Zealand Growth Comparison

Figure 178: New Zealand Market Share Analysis (%) by Product, 2022 & 2033

Figure 179: New Zealand Market Share Analysis (%) by Application, 2022 & 2033

Figure 180: New Zealand Market Share Analysis (%) by End User, 2022 & 2033

Figure 181: Middle East & Africa Market Value (US$ Million) Analysis, 2017 to 2022

Figure 182: Middle East & Africa Market Value (US$ Million) Forecast, 2023 to 2033

Figure 183: Middle East & Africa Market Value Share, by Product (2023 E)

Figure 184: Middle East & Africa Market Value Share, by Application (2023 E)

Figure 185: Middle East & Africa Market Value Share, by End User (2023 E)

Figure 186: Middle East & Africa Market Value Share, by Country (2023 E)

Figure 187: Middle East & Africa Market Attractiveness Analysis by Product, 2023 to 2033

Figure 188: Middle East & Africa Market Attractiveness Analysis by Application, 2023 to 2033

Figure 189: Middle East & Africa Market Attractiveness Analysis by End User, 2023 to 2033

Figure 190: Middle East & Africa Market Attractiveness Analysis by Country, 2023 to 2033

Figure 191: GCC Countries Market Value Proportion Analysis, 2022

Figure 192: Global Vs GCC Countries Growth Comparison

Figure 193: GCC Countries Market Share Analysis (%) by Product, 2022 & 2033

Figure 194: GCC Countries Market Share Analysis (%) by Application, 2022 & 2033

Figure 195: GCC Countries Market Share Analysis (%) by End User, 2022 & 2033

Figure 196: Türkiye Market Value Proportion Analysis, 2022

Figure 197: Global Vs. Türkiye Growth Comparison

Figure 198: Türkiye Market Share Analysis (%) by Product, 2022 & 2033

Figure 199: Türkiye Market Share Analysis (%) by Application, 2022 & 2033

Figure 200: Türkiye Market Share Analysis (%) by End User, 2022 & 2033

Figure 201: South Africa Market Value Proportion Analysis, 2022

Figure 202: Global Vs. South Africa Growth Comparison

Figure 203: South Africa Market Share Analysis (%) by Product, 2022 & 2033

Figure 204: South Africa Market Share Analysis (%) by Application, 2022 & 2033

Figure 205: South Africa Market Share Analysis (%) by End User, 2022 & 2033

Figure 206: Northern Africa Market Value Proportion Analysis, 2022

Figure 207: Global Vs Northern Africa Growth Comparison

Figure 208: Northern Africa Market Share Analysis (%) by Product, 2022 & 2033

Figure 209: Northern Africa Market Share Analysis (%) by Application, 2022 & 2033

Figure 210: Northern Africa Market Share Analysis (%) by End User, 2022 & 2033

Frequently Asked Questions

What is the Global Steerable Needle Market Growth Projection?

The steerable needle market is expected to progress at 6.9% CAGR until 2033.

What is the Projected Steerable Needle Market Value by 2033 End?

The overall steerable needle market is projected to reach around USD 2.13 billion by 2033.

Which Type of Product Forms is the Leading Steerable Needle Market Segment?

Bevel-tip flexible needles made up for 38.9% market revenue in 2022.

Which is the Prominent Regional Market in Asia Pacific?

China dominates the Asia Pacific market and is projected to advance at 7.6% CAGR through 2033.

Which is the Leading Market Segment Based on Application of Steerable Needles?

Application steerable needles in biopsy segment captured almost 24.5% market share in 2022.

Explore Medical Supplies Insights

Future Market Insights

Steerable Needle Market