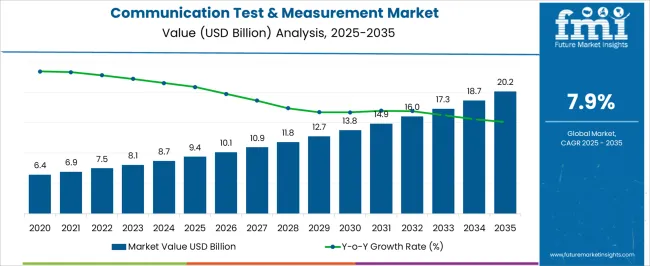
The Communication Test and Measurement Market is estimated to be valued at USD 9.4 billion in 2025 and is projected to reach USD 20.2 billion by 2035, registering a compound annual growth rate (CAGR) of 7.9% over the forecast period.
| Metric | Value |
|---|---|
| Communication Test and Measurement Market Estimated Value in (2025 E) | USD 9.4 billion |
| Communication Test and Measurement Market Forecast Value in (2035 F) | USD 20.2 billion |
| Forecast CAGR (2025 to 2035) | 7.9% |
The communication test and measurement market is expanding rapidly due to the accelerating adoption of 5G, cloud computing, and high speed broadband infrastructure. Growing network complexity and rising data traffic have created strong demand for advanced testing solutions that ensure reliability, scalability, and interoperability.
Enterprises and service providers are investing in test systems that deliver real time performance monitoring, reduced latency, and enhanced security. Furthermore, the proliferation of connected devices and IoT ecosystems has reinforced the need for robust testing frameworks to validate compliance and optimize network efficiency.
Regulatory standards mandating quality of service and the ongoing shift toward software defined and virtualized networks are also shaping the industry landscape. The future outlook remains promising as stakeholders increasingly prioritize network assurance and seamless end user experience across diversified communication platforms.
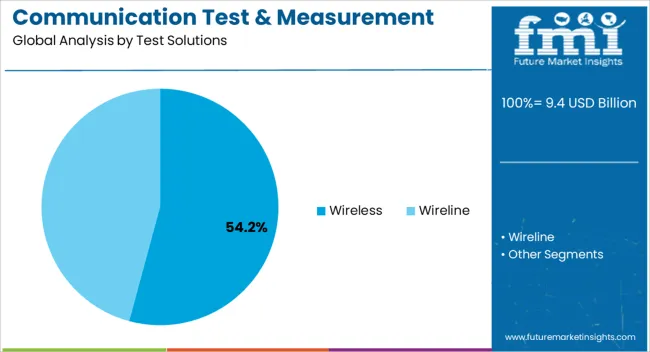
The wireless segment is anticipated to account for 54.20% of total revenue within the test solutions category, making it the leading segment. This dominance is being driven by the widespread rollout of 5G infrastructure, rising mobile data consumption, and demand for reliable connectivity across multiple devices.
Wireless test solutions enable network operators and enterprises to validate coverage, capacity, and performance under varied usage conditions. Their adoption has been reinforced by continuous innovation in spectrum utilization and advanced test equipment that supports high frequency and multi technology environments.
With the growth of IoT, smart cities, and next generation broadband, wireless testing continues to play a critical role, ensuring consistent service quality and enabling scalability of modern communication networks.
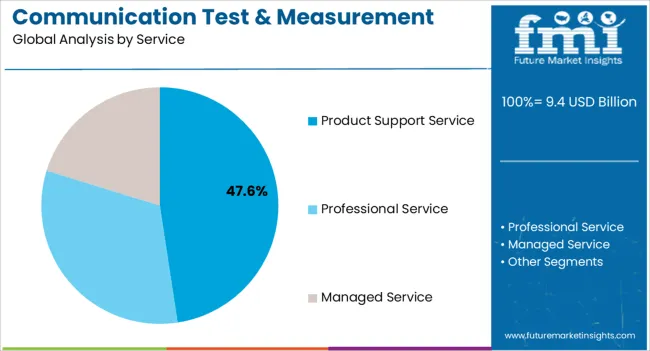
The product support service segment is projected to hold 47.60% of total market revenue within the service category, positioning it as the leading contributor. This share is supported by the increasing complexity of communication systems and the need for ongoing maintenance, upgrades, and technical assistance.
Enterprises and service providers are prioritizing long term partnerships with vendors to ensure smooth operation, compliance with evolving standards, and rapid resolution of technical issues. Product support services also extend the lifecycle of test equipment by providing calibration, software updates, and troubleshooting support.
As networks become more dynamic and software driven, reliance on product support services has increased, solidifying this segment’s role as a critical enabler of uninterrupted operations.
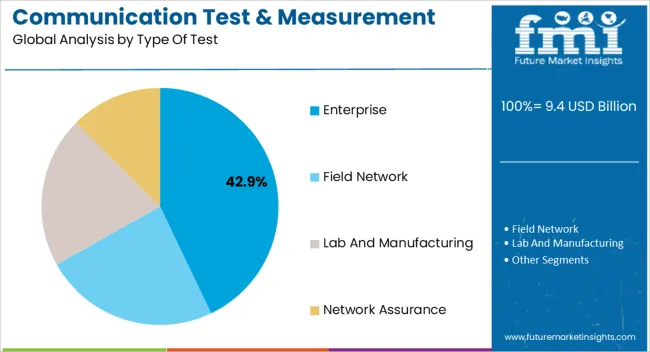
The enterprise segment is expected to capture 42.90% of total revenue within the type of test category, establishing itself as the dominant segment. This leadership is due to the surge in enterprise digital transformation initiatives, adoption of cloud based solutions, and the deployment of hybrid IT infrastructures.
Enterprises require comprehensive test and measurement frameworks to secure networks, ensure uptime, and manage high volumes of real time data. The growth of remote work, video conferencing, and SaaS platforms has further underscored the necessity of rigorous testing environments.
Investment in enterprise specific test solutions has therefore been prioritized to maintain competitive advantage, guarantee regulatory compliance, and deliver seamless communication experiences across global operations.
The key factor expected to propel the growth of the global market during the forecast period includes the increasing adoption of 5G connections which might require wireless test equipment, test performance, and network management solutions.
Testing equipment and networks are critical in the lab and production environment throughout the entire network lifecycle, fueling the market growth over the analysis period.
With the varying bandwidth demands of services, service providers need a complete testing solution. It is to ensure their network meets performance and accessibility requirements while maintaining the quality of service for mission-critical voice, video, and data traffic. This factor is expected to augment the market demand in the forthcoming years.
In the communication and networking sector, rapid changes in network circulation, from voice to integrated voice, video, and data, have created a need for solutions to test performance and capacity. It is expected to accelerate the growth of the global market during the forecast period.
A few factors are acting as obstacles and hindering the growth of the global market during the forecast period. The high labor and testing cost and the fluctuation in prices are expected to hamper the growth of the communications test and measurement market during the analysis period.
The pressure of keeping up with the continuously changing technologies is projected to challenge market growth in the forthcoming years. In addition, the decreasing testing time, which produces substantial cost-savings for OEMs, is a restraint for communication test and measurement vendors.
Reliable test and management services have become vital for digital networks to organize communication channels. Different types of methodologies and techniques are used for keeping track of communications in an enterprise.
The growth in bandwidth use and the introduction of numerous next-generation technologies are creating a strong demand for communications test and management services. Due to the growing demand, the market is expected to maintain a steady growth rate.
The increasing intricacy and number of wireless devices might ensure market growth in the coming years. Other supporting aspects include rising data consumption and an expected need for high-speed, high-quality services.
| Attributes | Details |
|---|---|
| Market CAGR (2025 to 2035) | 8.3% |
| Market Valuation (2025) | USD 8.01 billion |
| Market Valuation (2035) | USD 17.78 billion |
The market was valued at USD 6.4 billion in 2020 and estimated at USD 9.40 billion in 2025. The market experienced steady growth due to increasing demand for reliable, cost-effective, and high-quality communication systems.
The innovation of advanced technologies such as 5G networks, the Internet of Things, and wireless communications drove the market between 2020 and 2025. The growing end-user industries such as healthcare, Information Technology, automotive, aerospace, and others fuel the global market.
Key companies invest in research and development activities to offer advanced services, measurement equipment, and software to expand the market by 2035.
Based on the Test Solutions, the market can be segmented into Wireless Test Solutions and Wireline Test Solutions.
The wireless test solutions category is expected to occupy a high market share and expand at a CAGR of 8.0% during the forecast period. Moreover, the field network test segment is projected to fundamentally transform the communication test and measurement landscape. The segment is expected to grow significantly over the forecast period.
From the business perspective, several consumers consider field network tests accurate and reliable since they allow the user base to make changes in the controlled environment without going through complicated steps.
The market can be segmented based on Service into Product Support Services, Professional Services, and Managed Services.
Based on the Type of Test, the market can be segmented into Enterprise, Field Network, Lab and Manufacturing Test, and Network Assurance.
Based on Organization Size, the market can be classified into Small, Medium Enterprises, and Large Enterprises.
Based on End-User, the market can be categorized into Network Equipment Manufacturers, Mobile Device Manufacturers, and Telecommunication Service Providers.
Based on the end-user segment, network equipment manufacturers (NEMs) and mobile device manufacturers have boosted product demand across the globe. The Network Equipment Manufacturer segment is expected to dominate the market with a CAGR of 8.3%.
The global market is divided into North America, Latin America, Europe, Asia Pacific, the Middle East, and Africa based on geography.
North America region dominates the global market, attributed to the rapid increase in mobile connectivity speed and a growing number of organizations dependent on this technology.
Exponential demand for 4G technology, ZTE - voice, and the adoption of various smart devices by citizens in North America are key drivers for the growth of the global market.
Asia Pacific region is expected to offer several key growth opportunities owing to the steady increase of CTM consumers, such as enterprises and mobile device manufacturers. Moreover, the increasing number of players across Asia Pacific region is further expected to drive the global market.
The United States' communication test and measurement industry is projected to reach a valuation of USD 20.2 billion by 2035 with a CAGR of 8.1%. China is expected to reach a market size of USD 1.2 billion in 2035, representing a CAGR of 7.6% over the forecast period.
Japan and the United Kingdom are expected to reach the same market size of USD 1.0 billion and USD 673.0 million in 2035, representing growth forecasts of 6.6% and 7.0%, respectively, throughout the forecast period. On the other hand, South Korea is expected to reach a market size of USD 597.1 million in 2035, representing a CAGR of 6.1% during the forecast period.
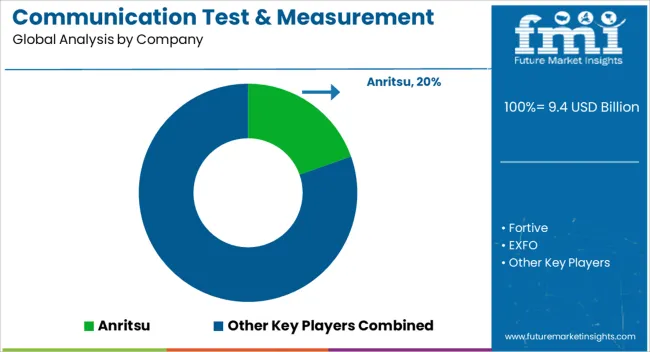
Anritsu, Fortive, EXFO, Rohde & Schwarz, National Instruments, VIAVI, Yokogawa, Spirent, Keysight Technologies, Huawei, VeEX, Empirix, Calnex Solutions, octoScope, Centina Systems, Cisco, SysMech, Luna Innovations, NETSCOUT, ThinkRF, TEOCO Corporation, QualiTest, and Kyrio, among others are the top companies in the global market.
With a sizable global market share, these main firms are concentrating on growing their consumer base in new countries. These businesses use strategic collaboration initiatives to grow their market share and profits.
Mid-size and small businesses, on the other hand, are expanding their market presence by gaining new contracts and entering new markets, thanks to technical developments and product innovations.
Key players focus on developing advanced products in the market as per consumers’ requirements to satisfy their needs. These players are contributing a key role to expand the global market through their innovations and unique products to capture huge revenue.
Recent Developments in the Global Market
| Attribute | Details |
|---|---|
| Forecast Period | 2025 to 2035 |
| Historical Data Available for | 2020 to 2025 |
| Market Analysis | USD billion for Value |
| Key Countries Covered | The United States, The United Kingdom, Japan, India, China, Australia, Germany |
| Key Segments Covered | Test Solutions, Service, Type of Test, Organization Size, Region |
| Key Companies Profiled | Anritsu; Fortive; EXFO; Rohde & Schwarz; National Instruments; VIAVI; Yokogawa; Spirent; Keysight Technologies; Huawei; VeEX; Empirix; Calnex Solutions; OctoScope; Centina Systems; Cisco; SysMech; Luna Innovations; NETSCOUT; ThinkRF; TEOCO Corporation; QualiTest; Kyrio |
| Report Coverage | Market Forecast, Company Share Analysis, Competition Intelligence, DROT Analysis, Market Dynamics and Challenges, and Strategic Growth Initiatives |
| Customization & Pricing | Available upon Request |
The global communication test and measurement market is estimated to be valued at USD 9.4 billion in 2025.
The market size for the communication test and measurement market is projected to reach USD 20.2 billion by 2035.
The communication test and measurement market is expected to grow at a 7.9% CAGR between 2025 and 2035.
The key product types in communication test and measurement market are wireless and wireline.
In terms of service, product support service segment to command 47.6% share in the communication test and measurement market in 2025.


Our Research Products

The "Full Research Suite" delivers actionable market intel, deep dives on markets or technologies, so clients act faster, cut risk, and unlock growth.

The Leaderboard benchmarks and ranks top vendors, classifying them as Established Leaders, Leading Challengers, or Disruptors & Challengers.

Locates where complements amplify value and substitutes erode it, forecasting net impact by horizon

We deliver granular, decision-grade intel: market sizing, 5-year forecasts, pricing, adoption, usage, revenue, and operational KPIs—plus competitor tracking, regulation, and value chains—across 60 countries broadly.

Spot the shifts before they hit your P&L. We track inflection points, adoption curves, pricing moves, and ecosystem plays to show where demand is heading, why it is changing, and what to do next across high-growth markets and disruptive tech

Real-time reads of user behavior. We track shifting priorities, perceptions of today’s and next-gen services, and provider experience, then pace how fast tech moves from trial to adoption, blending buyer, consumer, and channel inputs with social signals (#WhySwitch, #UX).

Partner with our analyst team to build a custom report designed around your business priorities. From analysing market trends to assessing competitors or crafting bespoke datasets, we tailor insights to your needs.
Supplier Intelligence
Discovery & Profiling
Capacity & Footprint
Performance & Risk
Compliance & Governance
Commercial Readiness
Who Supplies Whom
Scorecards & Shortlists
Playbooks & Docs
Category Intelligence
Definition & Scope
Demand & Use Cases
Cost Drivers
Market Structure
Supply Chain Map
Trade & Policy
Operating Norms
Deliverables
Buyer Intelligence
Account Basics
Spend & Scope
Procurement Model
Vendor Requirements
Terms & Policies
Entry Strategy
Pain Points & Triggers
Outputs
Pricing Analysis
Benchmarks
Trends
Should-Cost
Indexation
Landed Cost
Commercial Terms
Deliverables
Brand Analysis
Positioning & Value Prop
Share & Presence
Customer Evidence
Go-to-Market
Digital & Reputation
Compliance & Trust
KPIs & Gaps
Outputs
Full Research Suite comprises of:
Market outlook & trends analysis
Interviews & case studies
Strategic recommendations
Vendor profiles & capabilities analysis
5-year forecasts
8 regions and 60+ country-level data splits
Market segment data splits
12 months of continuous data updates
DELIVERED AS:
PDF EXCEL ONLINE
Test and Measurement Equipment Market Size and Share Forecast Outlook 2025 to 2035
Test and Measurement Sensors Market Size and Share Forecast Outlook 2025 to 2035
General Purpose Electronic Test and Measurement Instruments Market Analysis and Forecast by Product, End Use, and Region Through 2035
Testosterone Test Market Size and Share Forecast Outlook 2025 to 2035
Test rig Market Size and Share Forecast Outlook 2025 to 2035
Measurement Technology in Downstream Processing Market Size and Share Forecast Outlook 2025 to 2035
Communication Platform as a Service (CPaaS) Market Analysis - Size, Share & Forecast 2025 to 2035
Communications Platform as a Service (CPaaS) Market in Korea Growth – Trends & Forecast 2025 to 2035
Testing, Inspection & Certification Market Growth – Trends & Forecast 2025 to 2035
Testosterone Booster Industry Analysis by Component, Source, Distribution Channels and Regions 2025 to 2035
Testosterone Injectable Market
Test Tube Market
Testliner Market
Testicular Cancer Treatment Market
Intestinal Health Pet Dietary Supplement Market Size and Share Forecast Outlook 2025 to 2035
Intestinal Pseudo-Obstruction Treatment Market - Trends, Growth & Forecast 2025 to 2035
Intestinal Fistula Treatment Market Growth - Demand & Innovations 2025 to 2035
5G Testing Market Size and Share Forecast Outlook 2025 to 2035
AB Testing Software Market Size and Share Forecast Outlook 2025 to 2035
RF Test Equipment Market Size and Share Forecast Outlook 2025 to 2035

Thank you!
You will receive an email from our Business Development Manager. Please be sure to check your SPAM/JUNK folder too.
Chat With
MaRIA