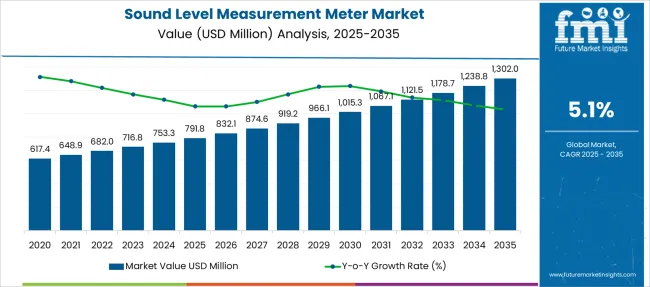
The Sound Level Measurement Meter Market is estimated to be valued at USD 791.8 million in 2025 and is projected to reach USD 1302.0 million by 2035, registering a compound annual growth rate (CAGR) of 5.1% over the forecast period.
| Metric | Value |
|---|---|
| Sound Level Measurement Meter Market Estimated Value in (2025 E) | USD 791.8 million |
| Sound Level Measurement Meter Market Forecast Value in (2035 F) | USD 1302.0 million |
| Forecast CAGR (2025 to 2035) | 5.1% |
The sound level measurement meter market is growing steadily as industries and regulatory bodies focus more on monitoring and controlling noise pollution. Increasing awareness about occupational health and safety has led factories and enterprises to invest in reliable noise measurement solutions.
These devices help ensure compliance with environmental regulations and protect worker hearing health. Technological advancements have enhanced the accuracy and usability of sound level meters, making them more accessible across various industrial settings.
The rising number of factories expanding production capabilities has further driven the demand for sound monitoring tools. Future growth is expected to be supported by stricter noise regulations and the increasing need for environmental impact assessments. Segmental growth is expected to be driven by Ordinary Sound Level Measurement Meters due to their wide applicability and the growing adoption in Factories and Enterprises for noise control and compliance.
The market is segmented by Type and Application and region. By Type, the market is divided into Ordinary Sound Level Measurement Meters and Precision Sound Level Measurement Meters. In terms of Application, the market is classified into Factories & Enterprises Sound Level Measurement Meters, Environment Protection Sound Level Measurement Meters, Transportation Sound Level Measurement Meters, R&D Sound Level Measurement Meters, and Others Sound Level Measurement Meters. Regionally, the market is classified into North America, Latin America, Western Europe, Eastern Europe, Balkan & Baltic Countries, Russia & Belarus, Central Asia, East Asia, South Asia & Pacific, and the Middle East & Africa.
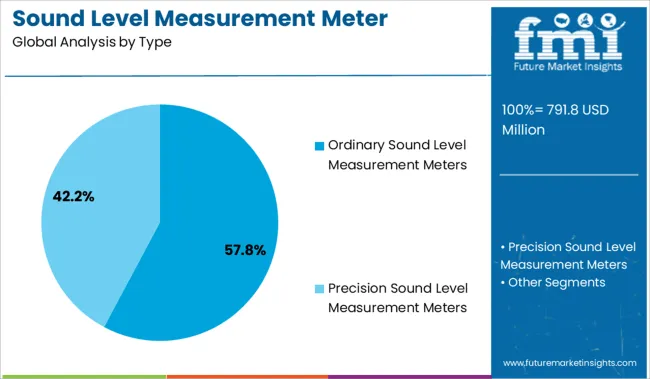
The Ordinary Sound Level Measurement Meters segment is projected to hold 57.8% of the market revenue in 2025, securing its place as the leading type category. This segment’s growth is attributed to the widespread applicability of ordinary meters in various industrial and commercial environments.
These meters provide essential noise level data needed for regulatory compliance and workplace safety audits. Their ease of use and affordability make them preferred by small to large enterprises aiming to maintain noise standards.
The segment has also benefited from improvements in meter design that offer portability and quick readings. As noise pollution awareness increases and industries strive to meet environmental guidelines, demand for ordinary sound level meters is expected to remain strong.
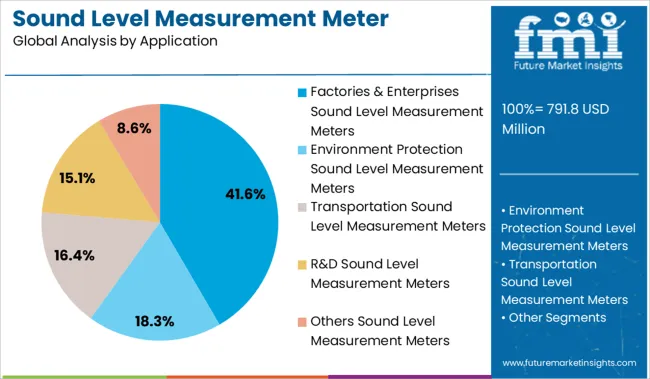
The Factories and Enterprises application segment is projected to contribute 41.6% of the market revenue in 2025, maintaining its leadership among application areas. This growth is supported by the increasing need to monitor noise levels in industrial environments to safeguard worker health and comply with regulations.
Industrial facilities are adopting sound level meters to measure equipment noise and ensure occupational noise exposure limits are not exceeded. Compliance with workplace safety standards and environmental noise regulations has become a key operational requirement for factories and enterprises.
The segment’s expansion is also propelled by modernization and automation in manufacturing plants, which necessitate precise noise monitoring. As industrial activity grows globally and stricter noise control policies are implemented, the Factories and Enterprises segment is expected to continue leading the market.
An increase in the number of investments by governments to maintain eco-friendliness is boosting the demand for sound level measurement meter. In addition, an increase in the number of noise pollution studies for the quantification of different types of noise, especially from the industries, aircraft, and mining, is likely to boost the demand for sound level measurement meter.
Moreover, increasing standards related to noise pollution are expected to spur the demand for sound level measurement meter.
Despite several benefits, sound level measurement meter pose several challenges such as the high cost incurred in the development of sound level meter. This is one of the critical factors hampering the growth of the sound level meter market. Efforts are being taken by several corporations to enhance their research and development activities to present innovations in this field.
The Asia Pacific is likely to be the fastest-growing market throughout the projection period owing to widespread usage in the industrial and environmental fields. Generally, the Sound Level Meter industry market is low pondered as the manufacturing technology of Sound Level Meter is comparatively immature.
Furthermore, some key players, like Bruel and Kjaer, Cirrus Research, TSI-Quest, etc. are well-recognized for the ideal performance of their Sound Level Meter. Likewise, China bagged a 29% sales market share in 2020, which is outstanding in the global Sound Level Meter industry owing to the lowest cost of raw materials and labor.
Based on a recent analysis, the APAC Sound Level Measurement Meter market evaluated nearly USD 753.3 Million in 2024 and is projected to expand to nearly USD 680 Million by the end of the forecast period. During this period, the Y-O-Y growth rate is likely to stay close to 5.1%.
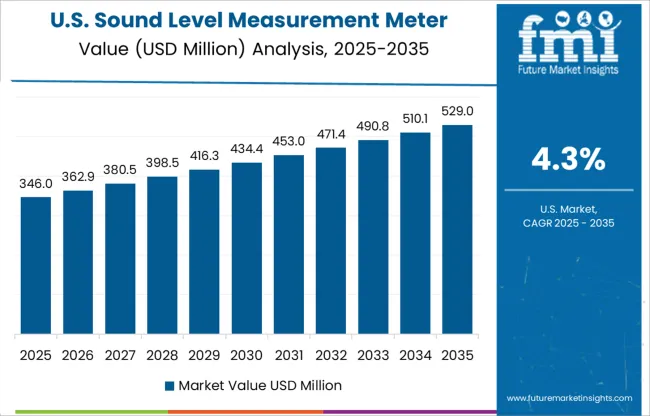
Based on geographical contribution, the North American region captured nearly 35% market share in 2024 and is likely to maintain its dominance in the forecast period. This market growth is driven by the recent advancements in the sound level measurement meter available in the North American region, especially the USA, which are estimated to witness significant market growth over the forecast period.
This can be attributed to the fact that the USA region is the largest market for industrial phase, power generation, and aerospace & defines activities, the sound levels of which need to be continuously monitored. The aforesaid market is projected to project a growth rate of 5% during the conjecture period.
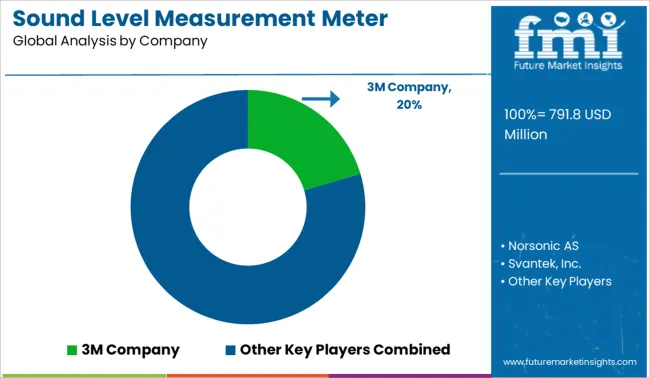
Some of the key participants present in the global demand of the Sound Level Measurement Meter market include 3M Company, Norsonic AS, Svantek, Inc., Testo SE & Co. Kgaa, CIRRUS Research Plc., Tes Electrical Electronic Corp., Nti Audio, Casella, Inc., Bruel & KJR, Rion Co., Ltd., and others and other sound level measurement meter manufacturers, among others.
| Report Attributes | Details |
|---|---|
| Growth Rate | CAGR of 5.1% from 2025 to 2035 |
| Market Value (2025) | USD 791.8 million |
| Market Value (2035) | USD 1302.0 million |
| Base Year for Estimation | 2024 |
| Historical Data | 2020 to 2024 |
| Forecast Period | 2025 to 2035 |
| Quantitative Units | Revenue in USD Million, Volume in Kilotons, and CAGR from 2025 to 2035 |
| Report Coverage | Revenue Forecast, Volume Forecast, Company Ranking, Competitive Landscape, Growth Factors, Trends, and Pricing Analysis |
| Segments Covered | Type, Application, Region |
| Regions Covered | North America; Latin America; Western Europe; Eastern Europe; APEJ; Japan; The Middle East and Africa |
| Key Countries Profiled | USA, Canada, Brazil, Mexico, Germany, UK, France, Spain, Italy, Poland, Russia, Australia & New Zealand, China, India, ASEAN, GCC, South Africa |
| Key Companies Profiled | 3M Company; Norsonic AS; Svantek, Inc.; Testo SE & Co. Kgaa; CIRRUS Research Plc.; Tes Electrical Electronic Corp.; Nti Audio; Casella, Inc.; Bruel & KJR; Rion Co., Ltd. |
| Customization | Available Upon Request |
The global sound level measurement meter market is estimated to be valued at USD 791.8 million in 2025.
The market size for the sound level measurement meter market is projected to reach USD 1,302.0 million by 2035.
The sound level measurement meter market is expected to grow at a 5.1% CAGR between 2025 and 2035.
The key product types in sound level measurement meter market are ordinary sound level measurement meters and precision sound level measurement meters.
In terms of application, factories & enterprises sound level measurement meters segment to command 41.6% share in the sound level measurement meter market in 2025.


Our Research Products

The "Full Research Suite" delivers actionable market intel, deep dives on markets or technologies, so clients act faster, cut risk, and unlock growth.

The Leaderboard benchmarks and ranks top vendors, classifying them as Established Leaders, Leading Challengers, or Disruptors & Challengers.

Locates where complements amplify value and substitutes erode it, forecasting net impact by horizon

We deliver granular, decision-grade intel: market sizing, 5-year forecasts, pricing, adoption, usage, revenue, and operational KPIs—plus competitor tracking, regulation, and value chains—across 60 countries broadly.

Spot the shifts before they hit your P&L. We track inflection points, adoption curves, pricing moves, and ecosystem plays to show where demand is heading, why it is changing, and what to do next across high-growth markets and disruptive tech

Real-time reads of user behavior. We track shifting priorities, perceptions of today’s and next-gen services, and provider experience, then pace how fast tech moves from trial to adoption, blending buyer, consumer, and channel inputs with social signals (#WhySwitch, #UX).

Partner with our analyst team to build a custom report designed around your business priorities. From analysing market trends to assessing competitors or crafting bespoke datasets, we tailor insights to your needs.
Supplier Intelligence
Discovery & Profiling
Capacity & Footprint
Performance & Risk
Compliance & Governance
Commercial Readiness
Who Supplies Whom
Scorecards & Shortlists
Playbooks & Docs
Category Intelligence
Definition & Scope
Demand & Use Cases
Cost Drivers
Market Structure
Supply Chain Map
Trade & Policy
Operating Norms
Deliverables
Buyer Intelligence
Account Basics
Spend & Scope
Procurement Model
Vendor Requirements
Terms & Policies
Entry Strategy
Pain Points & Triggers
Outputs
Pricing Analysis
Benchmarks
Trends
Should-Cost
Indexation
Landed Cost
Commercial Terms
Deliverables
Brand Analysis
Positioning & Value Prop
Share & Presence
Customer Evidence
Go-to-Market
Digital & Reputation
Compliance & Trust
KPIs & Gaps
Outputs
Full Research Suite comprises of:
Market outlook & trends analysis
Interviews & case studies
Strategic recommendations
Vendor profiles & capabilities analysis
5-year forecasts
8 regions and 60+ country-level data splits
Market segment data splits
12 months of continuous data updates
DELIVERED AS:
PDF EXCEL ONLINE
Sound Level Meter Market Size and Share Forecast Outlook 2025 to 2035
Sound Meter Market Size and Share Forecast Outlook 2025 to 2035
Sound Intensity Microphone Market Size and Share Forecast Outlook 2025 to 2035
Level Floats Market Size and Share Forecast Outlook 2025 to 2035
Level Sensor Market Size and Share Forecast Outlook 2025 to 2035
Metering Pump Market Size and Share Forecast Outlook 2025 to 2035
Measurement Technology in Downstream Processing Market Size and Share Forecast Outlook 2025 to 2035
Metered Dose Squeeze Dispenser Market Size and Share Forecast Outlook 2025 to 2035
Sound Barriers Market Size and Share Forecast Outlook 2025 to 2035
Soundproof Drywall Materials Market Size and Share Forecast Outlook 2025 to 2035
Sound Reinforcement Market Size and Share Forecast Outlook 2025 to 2035
The Metered Dose Inhalers Market is Segmented by Type, and End User from 2025 to 2035
Level Transmitter Market Growth – Trends & Forecast 2025 to 2035
Sound Sensor Market Analysis by Type, Technology, Specification, and Region Through 2035
Level Switches Market Growth - Trends & Forecast 2025 to 2035
Level Measuring Instrument Market
Cemetery Software Market Size and Share Forecast Outlook 2025 to 2035
Ammeters Market Size and Share Forecast Outlook 2025 to 2035
Diameter Signaling Market Size and Share Forecast Outlook 2025 to 2035
Odometer Market Trends – Growth & Forecast 2025 to 2035

Thank you!
You will receive an email from our Business Development Manager. Please be sure to check your SPAM/JUNK folder too.
Chat With
MaRIA