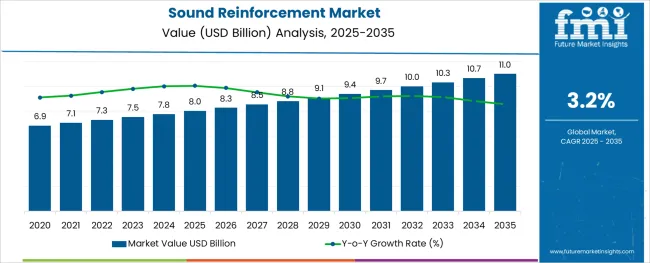
The sound reinforcement market is expected to record a CAGR of 3.2% during the forecast period 2022 to 2032, up from USD 7.3 Billion in the year 2022to reach a valuation of USD 8.5 Billion by 2032.
Report Attributes | Details |
---|---|
CAGR (2022 to 2032) | 3.2 % |
Value (2022) | USD 7.3 Billion |
Value (2032) | USD 8.5 Billion |
The sound reinforcement market is anticipated to show promising growth prospects in the forecasted period 2022 to 2032.
Sound reinforcement systems are complex, involving hundreds of microphones, multiple mixers, thousands of watts of amplifiers, signal processing systems, and a multitude of loudspeakers. Besides the complexity, these systems are as simple as a small public address system. Nevertheless, sound reinforcement systems are employed in both cases to make sound louder and to distribute it more widely.
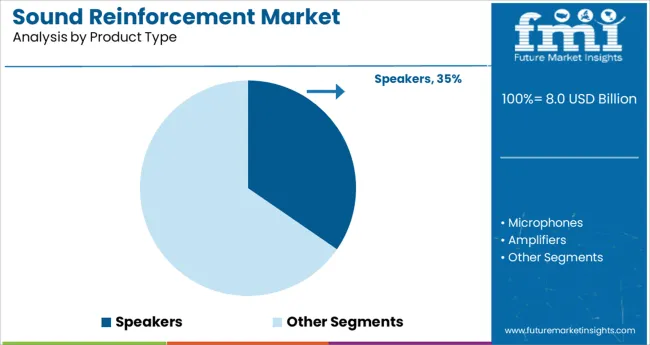
Increasing demand for sound appliances such as speakers, processors, microphones, and others in clubs, malls, hospitals, factories, distribution centers, and public address systems will drive the growth of the sound reinforcement market. The sound reinforcement market is also experiencing significant growth as consumers demand live concerts and entertainment.
As a result of the high cost of sound reinforcement equipment, the market for sound reinforcement is expected to grow slowly. Furthermore, the lack of skilled manufacturers to use the technology to produce quality sound, despite the best materials being used, would restrict the growth of the sound reinforcement market during the forecast period.
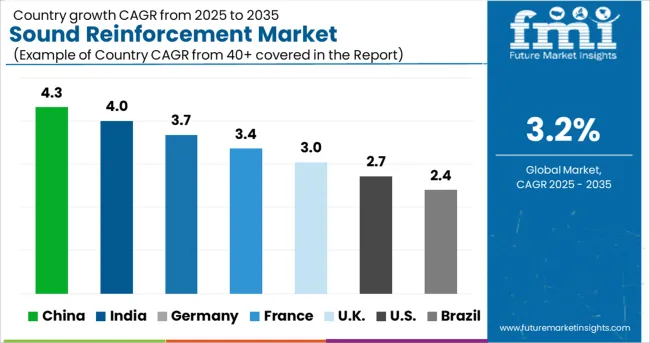
In the industry of sound reinforcement systems, North America holds the largest market share. Modern technologies and innovations, the growing use of sound reinforcement systems for live concerts, and government initiatives promoting digitalization are some of the major factors driving the need for sound reinforcement systems across North America.
Vendors in the Europe and East Asia regions stand to benefit greatly from technological advancements in sound reinforcement components.
Due to the presence of leading audio reinforcement vendors in the United States, the market shows a steady growth rate in North America during the forecast period. During the forecast period, South Asian developing countries are expected to record high adoption rates.
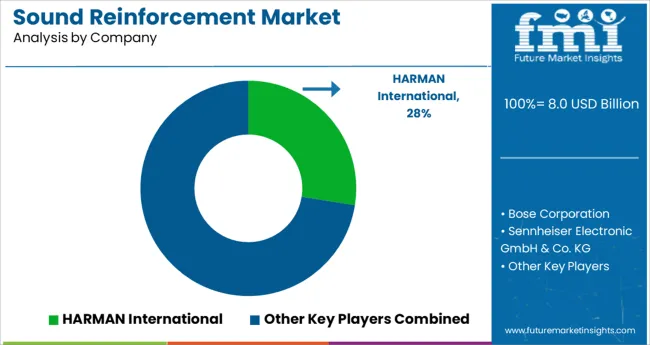
Market players sound reinforcement market are focusing on new product launches and advanced technology to gain a larger share of the market. The use of sound reinforcement equipment in corporate settings is becoming more popular as a way to project a more professional image.
Sound reinforcement equipment demand in the APAC market will be boosted by the adoption of sophisticated lifestyles and higher per capita income in various APAC nations.
Examples of some of the market participants in sound reinforcement market identified across the value chain include Harman International, MUSIC Group, Sony, Sennheiser Electronic, and others
Report Attribute | Details |
---|---|
Growth rate | CAGR of 3.2% from 2022 to 2032 |
Base year for estimation | 2021 |
Historical data | 2020 to 2028 |
Forecast period | 2022 to 2032 |
Quantitative units | Revenue in USD million/billion and CAGR from 2022 to 2032 |
Report coverage | Revenue forecast, volume forecast, company ranking, competitive landscape, growth factors, and trends, Pricing Analysis |
Segments covered | Products, Format, End-User, & Region. |
Regional scope | North America (USA; Canada); Latin America (Mexico; Brazil; Argentina; Peru; Chile; Rest of LATAM); Europe (Germany; Italy; UK; Spain; France; Nordic countries; BENELUX; Eastern Europe; Rest of Europe); East Asia (China; Japan; South Korea); South Asia (India; Indonesia; Malaysia; Thailand; Rest of South Asia); Oceania (Australia; New Zealand); Middle East and Africa (GCC Countries; Turkey; Iran; Israel; S. Africa; Rest of MEA) |
Country scope | USA, Canada, Mexico, Brazil, Argentina, Peru, Chile, Rest of LATAM, Germany, Italy, UK, Spain, France, Nordic countries, BENELUX, Eastern Europe, Rest of Europe, China, Japan, South Korea, India, Indonesia, Malaysia, Thailand, Rest of South Asia, Australia, New Zealand, GCC Countries, Turkey, Iran, Israel, S. Africa, Rest of MEA. |
Key companies profiled | Harman International; MUSIC Group; Sony; Sennheiser Electronic; and others |
Customization scope | Free report customization (equivalent to up to 8 analysts working days) with purchase. Addition or alteration to country, regional & segment scope. |
Pricing and purchase options | Avail customized purchase options to meet your exact research needs. |
Table 1: Global Sound Reinforcement Market Value (US$ Mn) Forecast by Region, 2017-2032
Table 2: Global Sound Reinforcement Market Volume (Units) Forecast by Region, 2017-2032
Table 3: Global Sound Reinforcement Market Value (US$ Mn) Forecast by Product Type, 2017-2032
Table 4: Global Sound Reinforcement Market Volume (Units) Forecast by Product Type, 2017-2032
Table 5: Global Sound Reinforcement Market Value (US$ Mn) Forecast by Distribution Channel, 2017-2032
Table 6: Global Sound Reinforcement Market Volume (Units) Forecast by Distribution Channel, 2017-2032
Table 7: Global Sound Reinforcement Market Value (US$ Mn) Forecast by Application, 2017-2032
Table 8: Global Sound Reinforcement Market Volume (Units) Forecast by Application, 2017-2032
Table 9: North America Sound Reinforcement Market Value (US$ Mn) Forecast by Country, 2017-2032
Table 10: North America Sound Reinforcement Market Volume (Units) Forecast by Country, 2017-2032
Table 11: North America Sound Reinforcement Market Value (US$ Mn) Forecast by Product Type, 2017-2032
Table 12: North America Sound Reinforcement Market Volume (Units) Forecast by Product Type, 2017-2032
Table 13: North America Sound Reinforcement Market Value (US$ Mn) Forecast by Distribution Channel, 2017-2032
Table 14: North America Sound Reinforcement Market Volume (Units) Forecast by Distribution Channel, 2017-2032
Table 15: North America Sound Reinforcement Market Value (US$ Mn) Forecast by Application, 2017-2032
Table 16: North America Sound Reinforcement Market Volume (Units) Forecast by Application, 2017-2032
Table 17: Latin America Sound Reinforcement Market Value (US$ Mn) Forecast by Country, 2017-2032
Table 18: Latin America Sound Reinforcement Market Volume (Units) Forecast by Country, 2017-2032
Table 19: Latin America Sound Reinforcement Market Value (US$ Mn) Forecast by Product Type, 2017-2032
Table 20: Latin America Sound Reinforcement Market Volume (Units) Forecast by Product Type, 2017-2032
Table 21: Latin America Sound Reinforcement Market Value (US$ Mn) Forecast by Distribution Channel, 2017-2032
Table 22: Latin America Sound Reinforcement Market Volume (Units) Forecast by Distribution Channel, 2017-2032
Table 23: Latin America Sound Reinforcement Market Value (US$ Mn) Forecast by Application, 2017-2032
Table 24: Latin America Sound Reinforcement Market Volume (Units) Forecast by Application, 2017-2032
Table 25: Europe Sound Reinforcement Market Value (US$ Mn) Forecast by Country, 2017-2032
Table 26: Europe Sound Reinforcement Market Volume (Units) Forecast by Country, 2017-2032
Table 27: Europe Sound Reinforcement Market Value (US$ Mn) Forecast by Product Type, 2017-2032
Table 28: Europe Sound Reinforcement Market Volume (Units) Forecast by Product Type, 2017-2032
Table 29: Europe Sound Reinforcement Market Value (US$ Mn) Forecast by Distribution Channel, 2017-2032
Table 30: Europe Sound Reinforcement Market Volume (Units) Forecast by Distribution Channel, 2017-2032
Table 31: Europe Sound Reinforcement Market Value (US$ Mn) Forecast by Application, 2017-2032
Table 32: Europe Sound Reinforcement Market Volume (Units) Forecast by Application, 2017-2032
Table 33: East Asia Sound Reinforcement Market Value (US$ Mn) Forecast by Country, 2017-2032
Table 34: East Asia Sound Reinforcement Market Volume (Units) Forecast by Country, 2017-2032
Table 35: East Asia Sound Reinforcement Market Value (US$ Mn) Forecast by Product Type, 2017-2032
Table 36: East Asia Sound Reinforcement Market Volume (Units) Forecast by Product Type, 2017-2032
Table 37: East Asia Sound Reinforcement Market Value (US$ Mn) Forecast by Distribution Channel, 2017-2032
Table 38: East Asia Sound Reinforcement Market Volume (Units) Forecast by Distribution Channel, 2017-2032
Table 39: East Asia Sound Reinforcement Market Value (US$ Mn) Forecast by Application, 2017-2032
Table 40: East Asia Sound Reinforcement Market Volume (Units) Forecast by Application, 2017-2032
Table 41: South Asia & Pacific Sound Reinforcement Market Value (US$ Mn) Forecast by Country, 2017-2032
Table 42: South Asia & Pacific Sound Reinforcement Market Volume (Units) Forecast by Country, 2017-2032
Table 43: South Asia & Pacific Sound Reinforcement Market Value (US$ Mn) Forecast by Product Type, 2017-2032
Table 44: South Asia & Pacific Sound Reinforcement Market Volume (Units) Forecast by Product Type, 2017-2032
Table 45: South Asia & Pacific Sound Reinforcement Market Value (US$ Mn) Forecast by Distribution Channel, 2017-2032
Table 46: South Asia & Pacific Sound Reinforcement Market Volume (Units) Forecast by Distribution Channel, 2017-2032
Table 47: South Asia & Pacific Sound Reinforcement Market Value (US$ Mn) Forecast by Application, 2017-2032
Table 48: South Asia & Pacific Sound Reinforcement Market Volume (Units) Forecast by Application, 2017-2032
Table 49: MEA Sound Reinforcement Market Value (US$ Mn) Forecast by Country, 2017-2032
Table 50: MEA Sound Reinforcement Market Volume (Units) Forecast by Country, 2017-2032
Table 51: MEA Sound Reinforcement Market Value (US$ Mn) Forecast by Product Type, 2017-2032
Table 52: MEA Sound Reinforcement Market Volume (Units) Forecast by Product Type, 2017-2032
Table 53: MEA Sound Reinforcement Market Value (US$ Mn) Forecast by Distribution Channel, 2017-2032
Table 54: MEA Sound Reinforcement Market Volume (Units) Forecast by Distribution Channel, 2017-2032
Table 55: MEA Sound Reinforcement Market Value (US$ Mn) Forecast by Application, 2017-2032
Table 56: MEA Sound Reinforcement Market Volume (Units) Forecast by Application, 2017-2032
Figure 1: Global Sound Reinforcement Market Value (US$ Mn) by Product Type, 2022-2032
Figure 2: Global Sound Reinforcement Market Value (US$ Mn) by Distribution Channel, 2022-2032
Figure 3: Global Sound Reinforcement Market Value (US$ Mn) by Application, 2022-2032
Figure 4: Global Sound Reinforcement Market Value (US$ Mn) by Region, 2022-2032
Figure 5: Global Sound Reinforcement Market Value (US$ Mn) Analysis by Region, 2017-2032
Figure 6: Global Sound Reinforcement Market Volume (Units) Analysis by Region, 2017-2032
Figure 7: Global Sound Reinforcement Market Value Share (%) and BPS Analysis by Region, 2022-2032
Figure 8: Global Sound Reinforcement Market Y-o-Y Growth (%) Projections by Region, 2022-2032
Figure 9: Global Sound Reinforcement Market Value (US$ Mn) Analysis by Product Type, 2017-2032
Figure 10: Global Sound Reinforcement Market Volume (Units) Analysis by Product Type, 2017-2032
Figure 11: Global Sound Reinforcement Market Value Share (%) and BPS Analysis by Product Type, 2022-2032
Figure 12: Global Sound Reinforcement Market Y-o-Y Growth (%) Projections by Product Type, 2022-2032
Figure 13: Global Sound Reinforcement Market Value (US$ Mn) Analysis by Distribution Channel, 2017-2032
Figure 14: Global Sound Reinforcement Market Volume (Units) Analysis by Distribution Channel, 2017-2032
Figure 15: Global Sound Reinforcement Market Value Share (%) and BPS Analysis by Distribution Channel, 2022-2032
Figure 16: Global Sound Reinforcement Market Y-o-Y Growth (%) Projections by Distribution Channel, 2022-2032
Figure 17: Global Sound Reinforcement Market Value (US$ Mn) Analysis by Application, 2017-2032
Figure 18: Global Sound Reinforcement Market Volume (Units) Analysis by Application, 2017-2032
Figure 19: Global Sound Reinforcement Market Value Share (%) and BPS Analysis by Application, 2022-2032
Figure 20: Global Sound Reinforcement Market Y-o-Y Growth (%) Projections by Application, 2022-2032
Figure 21: Global Sound Reinforcement Market Attractiveness by Product Type, 2022-2032
Figure 22: Global Sound Reinforcement Market Attractiveness by Distribution Channel, 2022-2032
Figure 23: Global Sound Reinforcement Market Attractiveness by Application, 2022-2032
Figure 24: Global Sound Reinforcement Market Attractiveness by Region, 2022-2032
Figure 25: North America Sound Reinforcement Market Value (US$ Mn) by Product Type, 2022-2032
Figure 26: North America Sound Reinforcement Market Value (US$ Mn) by Distribution Channel, 2022-2032
Figure 27: North America Sound Reinforcement Market Value (US$ Mn) by Application, 2022-2032
Figure 28: North America Sound Reinforcement Market Value (US$ Mn) by Country, 2022-2032
Figure 29: North America Sound Reinforcement Market Value (US$ Mn) Analysis by Country, 2017-2032
Figure 30: North America Sound Reinforcement Market Volume (Units) Analysis by Country, 2017-2032
Figure 31: North America Sound Reinforcement Market Value Share (%) and BPS Analysis by Country, 2022-2032
Figure 32: North America Sound Reinforcement Market Y-o-Y Growth (%) Projections by Country, 2022-2032
Figure 33: North America Sound Reinforcement Market Value (US$ Mn) Analysis by Product Type, 2017-2032
Figure 34: North America Sound Reinforcement Market Volume (Units) Analysis by Product Type, 2017-2032
Figure 35: North America Sound Reinforcement Market Value Share (%) and BPS Analysis by Product Type, 2022-2032
Figure 36: North America Sound Reinforcement Market Y-o-Y Growth (%) Projections by Product Type, 2022-2032
Figure 37: North America Sound Reinforcement Market Value (US$ Mn) Analysis by Distribution Channel, 2017-2032
Figure 38: North America Sound Reinforcement Market Volume (Units) Analysis by Distribution Channel, 2017-2032
Figure 39: North America Sound Reinforcement Market Value Share (%) and BPS Analysis by Distribution Channel, 2022-2032
Figure 40: North America Sound Reinforcement Market Y-o-Y Growth (%) Projections by Distribution Channel, 2022-2032
Figure 41: North America Sound Reinforcement Market Value (US$ Mn) Analysis by Application, 2017-2032
Figure 42: North America Sound Reinforcement Market Volume (Units) Analysis by Application, 2017-2032
Figure 43: North America Sound Reinforcement Market Value Share (%) and BPS Analysis by Application, 2022-2032
Figure 44: North America Sound Reinforcement Market Y-o-Y Growth (%) Projections by Application, 2022-2032
Figure 45: North America Sound Reinforcement Market Attractiveness by Product Type, 2022-2032
Figure 46: North America Sound Reinforcement Market Attractiveness by Distribution Channel, 2022-2032
Figure 47: North America Sound Reinforcement Market Attractiveness by Application, 2022-2032
Figure 48: North America Sound Reinforcement Market Attractiveness by Country, 2022-2032
Figure 49: Latin America Sound Reinforcement Market Value (US$ Mn) by Product Type, 2022-2032
Figure 50: Latin America Sound Reinforcement Market Value (US$ Mn) by Distribution Channel, 2022-2032
Figure 51: Latin America Sound Reinforcement Market Value (US$ Mn) by Application, 2022-2032
Figure 52: Latin America Sound Reinforcement Market Value (US$ Mn) by Country, 2022-2032
Figure 53: Latin America Sound Reinforcement Market Value (US$ Mn) Analysis by Country, 2017-2032
Figure 54: Latin America Sound Reinforcement Market Volume (Units) Analysis by Country, 2017-2032
Figure 55: Latin America Sound Reinforcement Market Value Share (%) and BPS Analysis by Country, 2022-2032
Figure 56: Latin America Sound Reinforcement Market Y-o-Y Growth (%) Projections by Country, 2022-2032
Figure 57: Latin America Sound Reinforcement Market Value (US$ Mn) Analysis by Product Type, 2017-2032
Figure 58: Latin America Sound Reinforcement Market Volume (Units) Analysis by Product Type, 2017-2032
Figure 59: Latin America Sound Reinforcement Market Value Share (%) and BPS Analysis by Product Type, 2022-2032
Figure 60: Latin America Sound Reinforcement Market Y-o-Y Growth (%) Projections by Product Type, 2022-2032
Figure 61: Latin America Sound Reinforcement Market Value (US$ Mn) Analysis by Distribution Channel, 2017-2032
Figure 62: Latin America Sound Reinforcement Market Volume (Units) Analysis by Distribution Channel, 2017-2032
Figure 63: Latin America Sound Reinforcement Market Value Share (%) and BPS Analysis by Distribution Channel, 2022-2032
Figure 64: Latin America Sound Reinforcement Market Y-o-Y Growth (%) Projections by Distribution Channel, 2022-2032
Figure 65: Latin America Sound Reinforcement Market Value (US$ Mn) Analysis by Application, 2017-2032
Figure 66: Latin America Sound Reinforcement Market Volume (Units) Analysis by Application, 2017-2032
Figure 67: Latin America Sound Reinforcement Market Value Share (%) and BPS Analysis by Application, 2022-2032
Figure 68: Latin America Sound Reinforcement Market Y-o-Y Growth (%) Projections by Application, 2022-2032
Figure 69: Latin America Sound Reinforcement Market Attractiveness by Product Type, 2022-2032
Figure 70: Latin America Sound Reinforcement Market Attractiveness by Distribution Channel, 2022-2032
Figure 71: Latin America Sound Reinforcement Market Attractiveness by Application, 2022-2032
Figure 72: Latin America Sound Reinforcement Market Attractiveness by Country, 2022-2032
Figure 73: Europe Sound Reinforcement Market Value (US$ Mn) by Product Type, 2022-2032
Figure 74: Europe Sound Reinforcement Market Value (US$ Mn) by Distribution Channel, 2022-2032
Figure 75: Europe Sound Reinforcement Market Value (US$ Mn) by Application, 2022-2032
Figure 76: Europe Sound Reinforcement Market Value (US$ Mn) by Country, 2022-2032
Figure 77: Europe Sound Reinforcement Market Value (US$ Mn) Analysis by Country, 2017-2032
Figure 78: Europe Sound Reinforcement Market Volume (Units) Analysis by Country, 2017-2032
Figure 79: Europe Sound Reinforcement Market Value Share (%) and BPS Analysis by Country, 2022-2032
Figure 80: Europe Sound Reinforcement Market Y-o-Y Growth (%) Projections by Country, 2022-2032
Figure 81: Europe Sound Reinforcement Market Value (US$ Mn) Analysis by Product Type, 2017-2032
Figure 82: Europe Sound Reinforcement Market Volume (Units) Analysis by Product Type, 2017-2032
Figure 83: Europe Sound Reinforcement Market Value Share (%) and BPS Analysis by Product Type, 2022-2032
Figure 84: Europe Sound Reinforcement Market Y-o-Y Growth (%) Projections by Product Type, 2022-2032
Figure 85: Europe Sound Reinforcement Market Value (US$ Mn) Analysis by Distribution Channel, 2017-2032
Figure 86: Europe Sound Reinforcement Market Volume (Units) Analysis by Distribution Channel, 2017-2032
Figure 87: Europe Sound Reinforcement Market Value Share (%) and BPS Analysis by Distribution Channel, 2022-2032
Figure 88: Europe Sound Reinforcement Market Y-o-Y Growth (%) Projections by Distribution Channel, 2022-2032
Figure 89: Europe Sound Reinforcement Market Value (US$ Mn) Analysis by Application, 2017-2032
Figure 90: Europe Sound Reinforcement Market Volume (Units) Analysis by Application, 2017-2032
Figure 91: Europe Sound Reinforcement Market Value Share (%) and BPS Analysis by Application, 2022-2032
Figure 92: Europe Sound Reinforcement Market Y-o-Y Growth (%) Projections by Application, 2022-2032
Figure 93: Europe Sound Reinforcement Market Attractiveness by Product Type, 2022-2032
Figure 94: Europe Sound Reinforcement Market Attractiveness by Distribution Channel, 2022-2032
Figure 95: Europe Sound Reinforcement Market Attractiveness by Application, 2022-2032
Figure 96: Europe Sound Reinforcement Market Attractiveness by Country, 2022-2032
Figure 97: East Asia Sound Reinforcement Market Value (US$ Mn) by Product Type, 2022-2032
Figure 98: East Asia Sound Reinforcement Market Value (US$ Mn) by Distribution Channel, 2022-2032
Figure 99: East Asia Sound Reinforcement Market Value (US$ Mn) by Application, 2022-2032
Figure 100: East Asia Sound Reinforcement Market Value (US$ Mn) by Country, 2022-2032
Figure 101: East Asia Sound Reinforcement Market Value (US$ Mn) Analysis by Country, 2017-2032
Figure 102: East Asia Sound Reinforcement Market Volume (Units) Analysis by Country, 2017-2032
Figure 103: East Asia Sound Reinforcement Market Value Share (%) and BPS Analysis by Country, 2022-2032
Figure 104: East Asia Sound Reinforcement Market Y-o-Y Growth (%) Projections by Country, 2022-2032
Figure 105: East Asia Sound Reinforcement Market Value (US$ Mn) Analysis by Product Type, 2017-2032
Figure 106: East Asia Sound Reinforcement Market Volume (Units) Analysis by Product Type, 2017-2032
Figure 107: East Asia Sound Reinforcement Market Value Share (%) and BPS Analysis by Product Type, 2022-2032
Figure 108: East Asia Sound Reinforcement Market Y-o-Y Growth (%) Projections by Product Type, 2022-2032
Figure 109: East Asia Sound Reinforcement Market Value (US$ Mn) Analysis by Distribution Channel, 2017-2032
Figure 110: East Asia Sound Reinforcement Market Volume (Units) Analysis by Distribution Channel, 2017-2032
Figure 111: East Asia Sound Reinforcement Market Value Share (%) and BPS Analysis by Distribution Channel, 2022-2032
Figure 112: East Asia Sound Reinforcement Market Y-o-Y Growth (%) Projections by Distribution Channel, 2022-2032
Figure 113: East Asia Sound Reinforcement Market Value (US$ Mn) Analysis by Application, 2017-2032
Figure 114: East Asia Sound Reinforcement Market Volume (Units) Analysis by Application, 2017-2032
Figure 115: East Asia Sound Reinforcement Market Value Share (%) and BPS Analysis by Application, 2022-2032
Figure 116: East Asia Sound Reinforcement Market Y-o-Y Growth (%) Projections by Application, 2022-2032
Figure 117: East Asia Sound Reinforcement Market Attractiveness by Product Type, 2022-2032
Figure 118: East Asia Sound Reinforcement Market Attractiveness by Distribution Channel, 2022-2032
Figure 119: East Asia Sound Reinforcement Market Attractiveness by Application, 2022-2032
Figure 120: East Asia Sound Reinforcement Market Attractiveness by Country, 2022-2032
Figure 121: South Asia & Pacific Sound Reinforcement Market Value (US$ Mn) by Product Type, 2022-2032
Figure 122: South Asia & Pacific Sound Reinforcement Market Value (US$ Mn) by Distribution Channel, 2022-2032
Figure 123: South Asia & Pacific Sound Reinforcement Market Value (US$ Mn) by Application, 2022-2032
Figure 124: South Asia & Pacific Sound Reinforcement Market Value (US$ Mn) by Country, 2022-2032
Figure 125: South Asia & Pacific Sound Reinforcement Market Value (US$ Mn) Analysis by Country, 2017-2032
Figure 126: South Asia & Pacific Sound Reinforcement Market Volume (Units) Analysis by Country, 2017-2032
Figure 127: South Asia & Pacific Sound Reinforcement Market Value Share (%) and BPS Analysis by Country, 2022-2032
Figure 128: South Asia & Pacific Sound Reinforcement Market Y-o-Y Growth (%) Projections by Country, 2022-2032
Figure 129: South Asia & Pacific Sound Reinforcement Market Value (US$ Mn) Analysis by Product Type, 2017-2032
Figure 130: South Asia & Pacific Sound Reinforcement Market Volume (Units) Analysis by Product Type, 2017-2032
Figure 131: South Asia & Pacific Sound Reinforcement Market Value Share (%) and BPS Analysis by Product Type, 2022-2032
Figure 132: South Asia & Pacific Sound Reinforcement Market Y-o-Y Growth (%) Projections by Product Type, 2022-2032
Figure 133: South Asia & Pacific Sound Reinforcement Market Value (US$ Mn) Analysis by Distribution Channel, 2017-2032
Figure 134: South Asia & Pacific Sound Reinforcement Market Volume (Units) Analysis by Distribution Channel, 2017-2032
Figure 135: South Asia & Pacific Sound Reinforcement Market Value Share (%) and BPS Analysis by Distribution Channel, 2022-2032
Figure 136: South Asia & Pacific Sound Reinforcement Market Y-o-Y Growth (%) Projections by Distribution Channel, 2022-2032
Figure 137: South Asia & Pacific Sound Reinforcement Market Value (US$ Mn) Analysis by Application, 2017-2032
Figure 138: South Asia & Pacific Sound Reinforcement Market Volume (Units) Analysis by Application, 2017-2032
Figure 139: South Asia & Pacific Sound Reinforcement Market Value Share (%) and BPS Analysis by Application, 2022-2032
Figure 140: South Asia & Pacific Sound Reinforcement Market Y-o-Y Growth (%) Projections by Application, 2022-2032
Figure 141: South Asia & Pacific Sound Reinforcement Market Attractiveness by Product Type, 2022-2032
Figure 142: South Asia & Pacific Sound Reinforcement Market Attractiveness by Distribution Channel, 2022-2032
Figure 143: South Asia & Pacific Sound Reinforcement Market Attractiveness by Application, 2022-2032
Figure 144: South Asia & Pacific Sound Reinforcement Market Attractiveness by Country, 2022-2032
Figure 145: MEA Sound Reinforcement Market Value (US$ Mn) by Product Type, 2022-2032
Figure 146: MEA Sound Reinforcement Market Value (US$ Mn) by Distribution Channel, 2022-2032
Figure 147: MEA Sound Reinforcement Market Value (US$ Mn) by Application, 2022-2032
Figure 148: MEA Sound Reinforcement Market Value (US$ Mn) by Country, 2022-2032
Figure 149: MEA Sound Reinforcement Market Value (US$ Mn) Analysis by Country, 2017-2032
Figure 150: MEA Sound Reinforcement Market Volume (Units) Analysis by Country, 2017-2032
Figure 151: MEA Sound Reinforcement Market Value Share (%) and BPS Analysis by Country, 2022-2032
Figure 152: MEA Sound Reinforcement Market Y-o-Y Growth (%) Projections by Country, 2022-2032
Figure 153: MEA Sound Reinforcement Market Value (US$ Mn) Analysis by Product Type, 2017-2032
Figure 154: MEA Sound Reinforcement Market Volume (Units) Analysis by Product Type, 2017-2032
Figure 155: MEA Sound Reinforcement Market Value Share (%) and BPS Analysis by Product Type, 2022-2032
Figure 156: MEA Sound Reinforcement Market Y-o-Y Growth (%) Projections by Product Type, 2022-2032
Figure 157: MEA Sound Reinforcement Market Value (US$ Mn) Analysis by Distribution Channel, 2017-2032
Figure 158: MEA Sound Reinforcement Market Volume (Units) Analysis by Distribution Channel, 2017-2032
Figure 159: MEA Sound Reinforcement Market Value Share (%) and BPS Analysis by Distribution Channel, 2022-2032
Figure 160: MEA Sound Reinforcement Market Y-o-Y Growth (%) Projections by Distribution Channel, 2022-2032
Figure 161: MEA Sound Reinforcement Market Value (US$ Mn) Analysis by Application, 2017-2032
Figure 162: MEA Sound Reinforcement Market Volume (Units) Analysis by Application, 2017-2032
Figure 163: MEA Sound Reinforcement Market Value Share (%) and BPS Analysis by Application, 2022-2032
Figure 164: MEA Sound Reinforcement Market Y-o-Y Growth (%) Projections by Application, 2022-2032
Figure 165: MEA Sound Reinforcement Market Attractiveness by Product Type, 2022-2032
Figure 166: MEA Sound Reinforcement Market Attractiveness by Distribution Channel, 2022-2032
Figure 167: MEA Sound Reinforcement Market Attractiveness by Application, 2022-2032
Figure 168: MEA Sound Reinforcement Market Attractiveness by Country, 2022-2032
The future of the sound reinforcement market is expected to reach USD 8.5 Billion by 2032.
The sound reinforcement market is expected to grow at a CAGR of 3.2% through 2032.
The potential market size of the sound reinforcement market amounts to USD 7.3 Billion in 2022.
North America is likely to dominate the sound reinforcement market.
The key driver in the sound reinforcement market is sound equipment such as speakers, processors and microphones.
Explore Similar Insights
Thank you!
You will receive an email from our Business Development Manager. Please be sure to check your SPAM/JUNK folder too.