The Ultrasound Devices Market is estimated to be valued at USD 8.7 billion in 2025 and is projected to reach USD 17.1 billion by 2035, registering a compound annual growth rate (CAGR) of 7.0% over the forecast period.
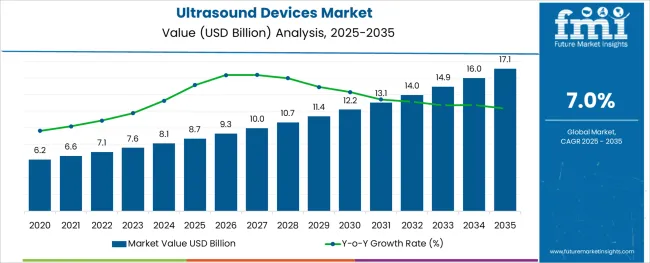
The ultrasound devices market is witnessing accelerated growth due to the rising demand for non invasive diagnostic solutions, rapid technological advancements, and expanding applications across medical specialties. Increased focus on early disease detection, prenatal monitoring, and real time procedural guidance is contributing to the wider adoption of ultrasound imaging.
Advances in image resolution, portability, and AI assisted diagnostics are enhancing clinical efficiency and patient outcomes. Additionally, the growing prevalence of chronic conditions and the shift toward outpatient and home care services are creating favorable conditions for ultrasound device usage.
Regulatory support for portable diagnostics and the need for radiation free imaging alternatives are reinforcing the long term relevance of ultrasound systems. As healthcare systems prioritize cost effective and accessible imaging modalities, the market outlook remains strong with consistent growth anticipated across both advanced and emerging economies.
The market is segmented by Product Type, Portability, Application, and End-User and region. By Product Type, the market is divided into Diagnostic Ultrasound Devices and Therapeutic Ultrasound Devices. In terms of Portability, the market is classified into Handheld and Cart/Trolley. Based on Application, the market is segmented into Cardiology, Obstetrics/Gynaecology, Vascular, Orthopaedics, and General Imaging. By End-User, the market is divided into Hospitals, Imaging Centres, and Research centres. Regionally, the market is classified into North America, Latin America, Western Europe, Eastern Europe, Balkan & Baltic Countries, Russia & Belarus, Central Asia, East Asia, South Asia & Pacific, and the Middle East & Africa.
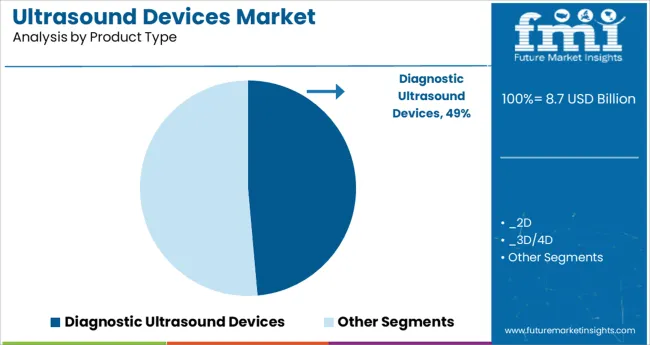
The diagnostic ultrasound devices segment is projected to contribute 48.60% of the total market revenue by 2025 within the product type category, making it the most dominant. This leadership is attributed to its widespread use in routine clinical assessments, including obstetrics, cardiology, and abdominal imaging.
These systems offer real time imaging, non invasive procedures, and a high safety profile, making them a preferred tool across hospital and outpatient settings. The ability to provide dynamic assessments and immediate results has significantly improved clinical decision making and reduced dependency on more expensive imaging techniques.
As hospitals and diagnostic centers expand their service offerings, investment in versatile diagnostic ultrasound platforms continues to grow, reinforcing their dominance in the product landscape.
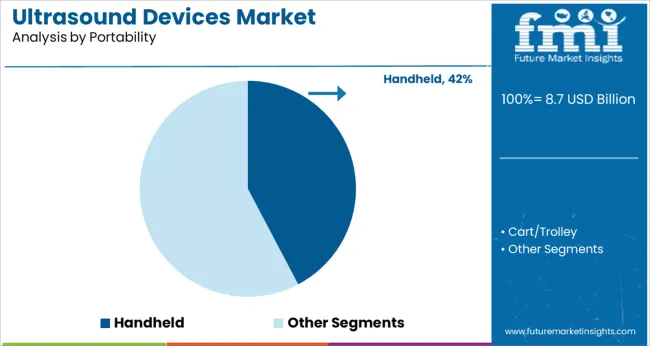
The handheld ultrasound devices segment is expected to account for 42.30% of the market revenue by 2025 within the portability category, marking it as a key area of growth. The surge in adoption is driven by increasing demand for point of care diagnostics, especially in emergency care, ambulatory services, and remote healthcare settings.
Handheld devices offer clinicians mobility, cost efficiency, and immediate imaging access without the need for large infrastructure. These systems have proven especially valuable during public health emergencies and in underserved regions where access to traditional imaging facilities is limited.
With improvements in wireless connectivity, battery life, and cloud integration, handheld ultrasound devices are increasingly being utilized across primary care and specialty practices, positioning them as a transformative force in the ultrasound market.
As per the Ultrasound Devices market research by Future Market Insights - a market research and competitive intelligence provider, historically, from 2020 to 2024, the market value of the Ultrasound Devices market increased at around 6.2% CAGR, wherein, countries such as the USA, China, Japan, the United Kingdom, and South Korea held a significant share in the global market.
Ongoing growth in chronic disorders, such as cancer, gallstones, and fatty liver disease, with increasing healthcare spending, are the driving factors behind the global market growth. In the coming year, a growing number of new medical treatments and early diagnosis procedures involving ultrasound devices will boost market demand.
High costs of ultrasound devices, on the other hand, are likely to limit the penetration of ultrasound imaging devices and prevent sustainable growth in the ultrasound imaging devices market during the evaluation period. Owing to this, the Ultrasound Devices market is projected to grow at a CAGR of 7% over the coming 10 years.
North America stands as the most lucrative region for the ultrasound devices market. The region has a sound healthcare infrastructure, which is being upgraded periodically wherein technologically older devices are replaced with new devices. In 6.206.21, the ultrasound devices market in North America stood at nearly USD 6.2 billion, growing at a CAGR of 6.4% from 6.2020 to 6.206.21.
The market in the region is projected to reach a valuation of USD 17.1 billion by the end of 6.2036.2. The market from 6.206.26.2 to 6.2036.2 is projected to witness an absolute dollar opportunity of USD 6.2.3 billion, growing at a CAGR of 7.6% during the forecast period.
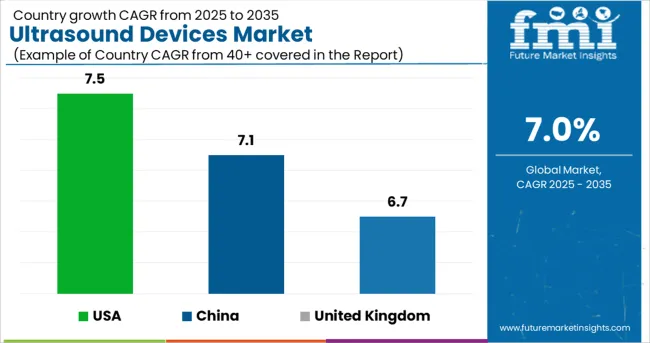
The presence of a large number of market competitors in the region, as well as an increase in cancer cases, are the key factors driving market growth in the country. The market for ultrasound devices in The USA was valued at USD 8.1 billion in 2024. The market in the country is projected to witness a CAGR of 7.5% from 2025 to 2035 and is estimated to reach a valuation of around USD 17.1 billion by 2035.
The market in China is projected to reach a valuation of USD 1.17.1 billion by 2035, growing at a CAGR of 7.1% from 2025 to 2035. Due to an increase in the geriatric population and chronic disease, as well as investments by Chinese governments in the development of healthcare infrastructure and increased demand for better imaging devices, the market in China is expected to grow at a significant pace during the forecast period.
The high market share of this segment can be attributed to a large number of ultrasound-based medical procedures performed in hospitals, as well as the growing number of hospitals in major markets and the rising adoption of minimally invasive diagnostic and surgical procedures in these facilities.
The Ultrasound Devices market in The United Kingdom was valued at USD 281.17.1 million in 2024. The market in the country is expected to reach nearly USD 572.9 million by 2035. From 2025 to 2035, the market is likely to witness an absolute dollar opportunity of USD 273.5 million, growing at a CAGR of 6.7%
The Ultrasound Devices market in Japan is projected to reach a valuation of USD 577.6 million by 2035, growing at a CAGR of 8% from 2025 to 2035. The market is likely to garner an absolute dollar opportunity of USD 8.7 million from 2025 to 2035.
The general imaging segment generated the most revenue based on application. This is due to an increase in the number of abdominal examinations performed and the use of ultrasound devices to diagnose abdominal disorders. Furthermore, due to the preferred diagnostic modality for obstetrics and gynecological problems (pregnancy, reproductive and fertility problems, among others), the Obstetrics/Gynaecology segment is expected to grow at the fastest rate during the forecast period, propelling the industry forward.
The gynecological segment is expected to grow at a faster expansion rate over the coming decade due to stiffening technology and rising recognition of gynecological issues, both of which are spurring demand for efficient diagnostic tools.
In 2024, trolley/cart-based ultrasound devices accounted for the largest share, while compact/handheld ultrasound devices are expected to grow at a faster rate. The portable handheld ultrasound device segment is expected to grow at a high CAGR due to the fact that handheld ultrasound machines are being used more commonly for point-of-care applications. However, these tools will not have as much success in the market as trolley-cart-based ultrasound devices, which can provide better diagnostic capabilities and superior performance.
The growing adoption of these systems across prominent markets is attributed to their increased use in acute care settings and emergency care in hospitals and healthcare institutions, which accounts for a large share of this segment.
In 2024, diagnostic ultrasound is expected to account for the majority of the ultrasound market. A significant aspect of women’s health is the use of 2D ultrasound, the availability of medical reimbursements for imaging procedures measured in mature markets, ongoing technological improvements in the field of diagnostic ultrasound imaging, and the emerging applications of emerging ultrasound techniques that have contributed to this segment's considerable share.
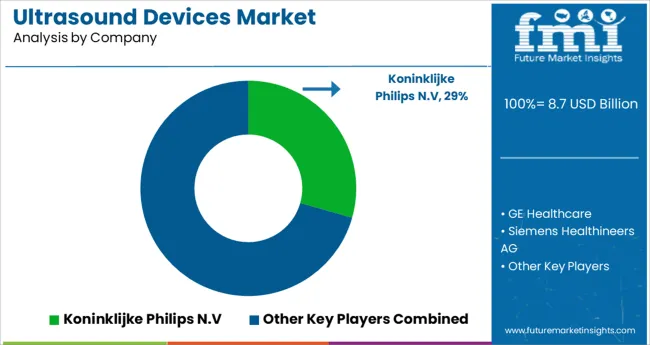
Some of the key players operating in the ultrasound market are GE Healthcare, Koninklijke Philips N.V., Canon Medical Systems, Siemens AG, and Samsung Medison.
Some of the recent developments in the Ultrasound Devices Market are as follows:
The global ultrasound devices market is estimated to be valued at USD 8.7 billion in 2025.
It is projected to reach USD 17.1 billion by 2035.
The market is expected to grow at a 7.0% CAGR between 2025 and 2035.
The key product types are diagnostic ultrasound devices, _2d, _3d/4d, _doppler, therapeutic ultrasound devices, _high-intensity focused ultrasound and _extracorporeal shockwave lithotripsy.
handheld segment is expected to dominate with a 42.3% industry share in 2025.


Our Research Products

The "Full Research Suite" delivers actionable market intel, deep dives on markets or technologies, so clients act faster, cut risk, and unlock growth.

The Leaderboard benchmarks and ranks top vendors, classifying them as Established Leaders, Leading Challengers, or Disruptors & Challengers.

Locates where complements amplify value and substitutes erode it, forecasting net impact by horizon

We deliver granular, decision-grade intel: market sizing, 5-year forecasts, pricing, adoption, usage, revenue, and operational KPIs—plus competitor tracking, regulation, and value chains—across 60 countries broadly.

Spot the shifts before they hit your P&L. We track inflection points, adoption curves, pricing moves, and ecosystem plays to show where demand is heading, why it is changing, and what to do next across high-growth markets and disruptive tech

Real-time reads of user behavior. We track shifting priorities, perceptions of today’s and next-gen services, and provider experience, then pace how fast tech moves from trial to adoption, blending buyer, consumer, and channel inputs with social signals (#WhySwitch, #UX).

Partner with our analyst team to build a custom report designed around your business priorities. From analysing market trends to assessing competitors or crafting bespoke datasets, we tailor insights to your needs.
Supplier Intelligence
Discovery & Profiling
Capacity & Footprint
Performance & Risk
Compliance & Governance
Commercial Readiness
Who Supplies Whom
Scorecards & Shortlists
Playbooks & Docs
Category Intelligence
Definition & Scope
Demand & Use Cases
Cost Drivers
Market Structure
Supply Chain Map
Trade & Policy
Operating Norms
Deliverables
Buyer Intelligence
Account Basics
Spend & Scope
Procurement Model
Vendor Requirements
Terms & Policies
Entry Strategy
Pain Points & Triggers
Outputs
Pricing Analysis
Benchmarks
Trends
Should-Cost
Indexation
Landed Cost
Commercial Terms
Deliverables
Brand Analysis
Positioning & Value Prop
Share & Presence
Customer Evidence
Go-to-Market
Digital & Reputation
Compliance & Trust
KPIs & Gaps
Outputs
Full Research Suite comprises of:
Market outlook & trends analysis
Interviews & case studies
Strategic recommendations
Vendor profiles & capabilities analysis
5-year forecasts
8 regions and 60+ country-level data splits
Market segment data splits
12 months of continuous data updates
DELIVERED AS:
PDF EXCEL ONLINE
Ultrasound Biometry Devices Market Size and Share Forecast Outlook 2025 to 2035
Ultrasound Skin Tightening Devices Market Size and Share Forecast Outlook 2025 to 2035
Ultrasound Conductivity Gels Market Size and Share Forecast Outlook 2025 to 2035
Ultrasound Market Size and Share Forecast Outlook 2025 to 2035
Ultrasound-Guided Breast Biopsy Market Size and Share Forecast Outlook 2025 to 2035
Ultrasound Systems Market Growth – Trends & Forecast 2025-2035
Ultrasound Imaging Solution Market
Teleultrasound Systems Market
Food Ultrasound Market Analysis – Applications & Innovations 2025 to 2035
FBAR Devices Market
Snare devices Market
Micro-Ultrasound Systems Market
C-Arms Devices Market Size and Share Forecast Outlook 2025 to 2035
Timing Devices Market Analysis - Size, Growth, & Forecast Outlook 2025 to 2035
Spinal Devices Market Size and Share Forecast Outlook 2025 to 2035
Hearing Devices 3D Printing Market Size and Share Forecast Outlook 2025 to 2035
Medical Devices Market Size and Share Forecast Outlook 2025 to 2035
Network Devices Market Size and Share Forecast Outlook 2025 to 2035
Medical Devices Secondary Packaging Market Analysis by Material and Application Through 2035
Cardiac Ultrasound Systems Market - Trends & Forecast 2025 to 2035

Thank you!
You will receive an email from our Business Development Manager. Please be sure to check your SPAM/JUNK folder too.
Chat With
MaRIA