Transcranial Doppler Ultrasounds System Market Size and Share Forecast Outlook 2025 to 2035

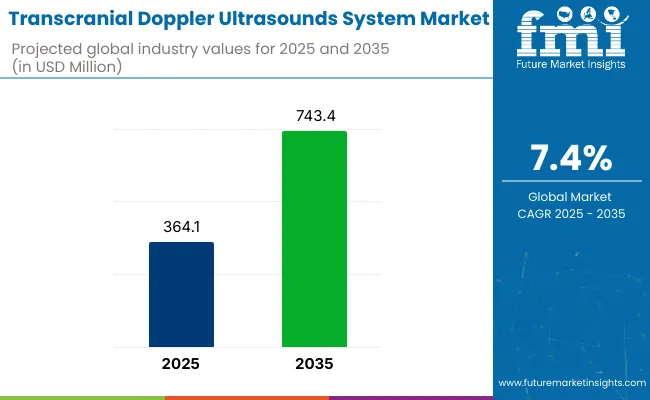
The Transcranial Doppler Ultrasounds System Market is anticipated to be valued at USD 364.1 million in 2025 and is expected to reach USD 743.4 million by 2035, registering a CAGR of 7.4%.
Quick Stats for Transcranial Doppler Ultrasounds System Market

  • Industry Size (2025E): USD 364.1 million
  • Industry Value (2035F): USD 743.4 million
  • Forecast CAGR (2025 to 2035): 7.4%
  • Leading Product Segment (2025): Non-Wearable Systems
  • Key Growth Regions: Asia-Pacific (China, India), North America (United States)
  • Top Key Players: Natus Medical Incorporated, Interacoustics A/S (Demant), GN Otometrics, Neuro Kinetics, Inc., Micromedical Technologies

Transcranial Doppler Ultrasounds System Market

Metric Value
Industry Size (2025E) USD 364.1 million
Industry Value (2035F) USD 742.5 million
CAGR (2025 to 2035) 7.4%

This market is experiencing significant growth, driven by the increasing prevalence of cerebrovascular diseases and the demand for non-invasive diagnostic tools. Technological advancements, such as the integration of artificial intelligence and portable devices, are enhancing diagnostic accuracy and accessibility.

The shift towards outpatient and home-based diagnostic centers further propels market expansion. Future growth opportunities lie in the development of advanced imaging techniques and the expansion of healthcare infrastructure in emerging economies. The market's trajectory is supported by the rising need for precise, quick, and cost-effective diagnostic solutions in neurology.
Analyzing Transcranial Doppler Ultrasounds System Market by Top Investment Segments

Non-Wearable TCD Systems Dominate Due to Institutional Preference and Diagnostic Accuracy

Transcranial Doppler Ultrasounds System Market By Product

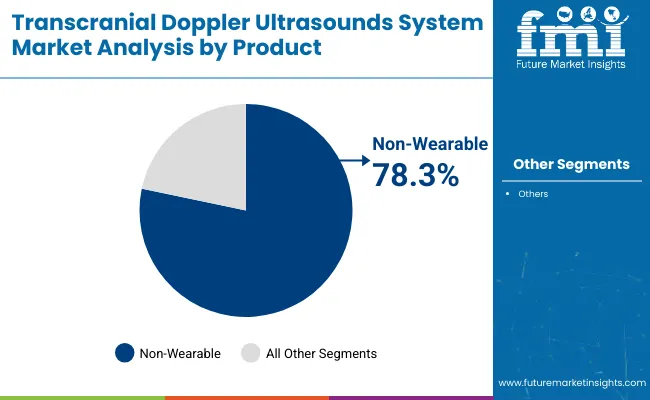
The non-wearable product type has been estimated to account for approximately 78.3% revenue share of the total market in 2025. This dominance has been attributed to the continued preference for fixed, console-based TCD systems in hospitals and imaging centers.

Superior diagnostic precision, along with their integration in high-dependency units such as neurocritical care, has played a crucial role in sustaining segmental leadership. The ability of these systems to deliver detailed cerebral hemodynamic assessments under controlled environments has made them indispensable.

Additionally, their compatibility with multi-channel probes and robotic-assisted scanning technologies has further solidified their usage in high-stakes diagnostic workflows. The reliability of non-wearable systems in acute stroke monitoring, traumatic brain injury evaluation, and intraoperative neuromonitoring has also supported their widespread adoption. While wearable technologies are emerging, regulatory approvals and clinical standardization continue to favor non-wearable devices in most neurology-focused facilities. These factors collectively have reinforced the stronghold of non-wearable TCD systems in the global market landscape.
Systems Segment Leads Due to Integration of Smart Imaging and AI-Based Diagnostics

Transcranial Doppler Ultrasounds System Market By Component

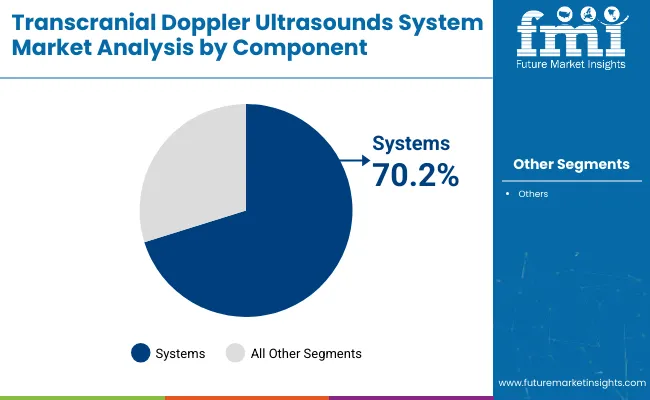
The System segment has been projected to capture around 70.2% of the total revenue share in 2025. This segment has remained dominant due to increasing demand for integrated, full-spectrum diagnostic platforms that combine signal acquisition, visualization, and cerebral hemodynamic analysis.

The expansion of AI-powered TCD systems capable of real-time analysis and pattern recognition has driven their adoption across neurology departments. Furthermore, the rising incidence of stroke, aneurysm, and cerebral vasospasm has mandated the use of high-performance systems capable of continuous monitoring. Hospital procurement trends have consistently favored full-system setups due to their compatibility with multi-probe arrays, robotic accessories, and advanced waveform interpretation modules.

The growth of this segment has also been enabled by strategic R&D investments by leading manufacturers into developing portable systems with integrated data connectivity, suitable for both ICU and OR environments. As such, the systems segment has emerged as the clinical backbone of modern transcranial monitoring workflows.
Standalone Units Lead Market Due to Dedicated Deployment in High-Dependency Settings

Transcranial Doppler Ultrasounds System Market By Modality

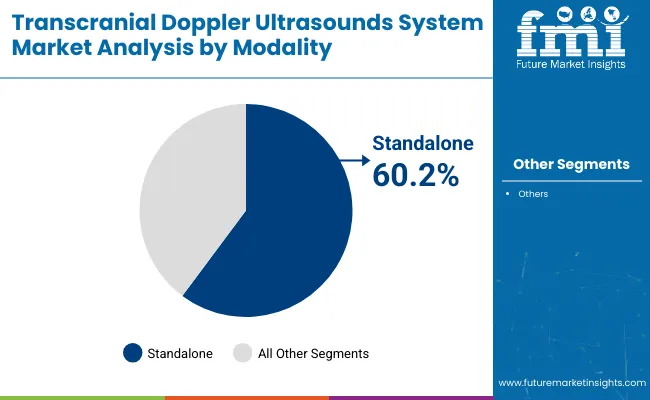
Stand Alone Units holds an estimated 60.2% market share in 2025, driven by its dedicated usage in neuro-intensive care units, stroke centers, and surgical monitoring environments. These devices have been favored for their high-throughput operation and integration with neuromonitoring protocols in institutional care settings.

Standalone systems have been designed to support continuous and precise measurement of cerebral blood velocity and autoregulation indices, which has been critical in acute care workflows. Unlike portable systems, standalone devices have typically offered enhanced signal fidelity, better thermal management, and compatibility with larger displays and data storage.

Their role in critical scenarios such as intraoperative monitoring and ICU-based stroke intervention has ensured consistent procurement by tertiary hospitals and specialty centers. In addition, a higher degree of customization and accessory integration has been facilitated in this modality, further reinforcing its relevance across major clinical applications. These operational advantages have led to the continued dominance of standalone systems.
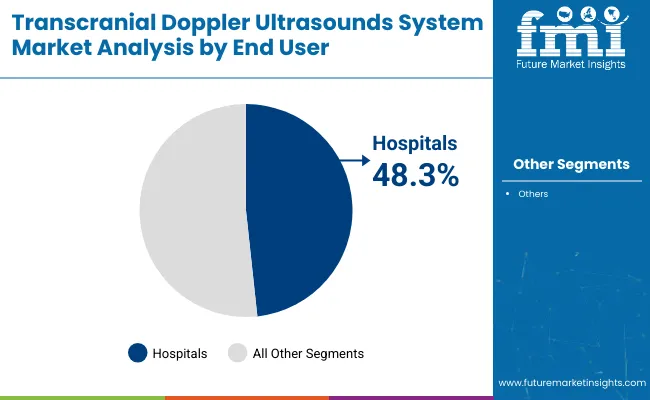
Hospitals Dominate TCD Demand Due to Multi-Disciplinary Neurological Applications

Transcranial Doppler Ultrasounds System Market By End User

Hospital segment dominates with a maximum share of the market at 48.3% in 2025, attributed to its expansive role in both acute and preventive neurovascular diagnostics. Hospitals have remained the primary settings where transcranial Doppler ultrasound systems are deployed due to their ability to perform rapid, bedside assessments of cerebral blood flow in patients with trauma, stroke, or vasospasm. The use of TCD devices in emergency departments, ICUs, and neurosurgical units has been reinforced by institutional protocols emphasizing early diagnosis and intervention.

Furthermore, the availability of trained sonographers and integration with hospital IT infrastructure has made large-scale deployment of TCD systems feasible. Advanced TCD platforms with robotic probes and real-time waveform interpretation have been widely adopted in hospital settings, offering clinicians the ability to monitor hemodynamic fluctuations during surgical procedures or while managing critical neurological cases. The segment’s dominance has been further supported by high purchasing capacity, multidisciplinary utility, and insurance-driven diagnostic pathways.

Challenges and Opportunities

Challenges

Operator Skill Dependency, Limited Acoustic Windows, and Data Fragmentation Slowing Market Expansion

Despite the development of transcranial Doppler ultrasound systems, significant operational challenges remain in the market. One significant limitation is the high reliance on technologists to both accurately place probes as well as interpret real-time velocity waveforms-which allows results to be inconsistent across non-specialized or high-turnover clinical environments.

Significantly, however, due to the poor temporal bone acoustic windows in c. 10% of the adult population (especially in elderly or certain ethnic groups), vestibular testing can lack reliability and, thus, the principle of universality of application. In many countries, TCD data is siloed in proprietary information systems that are not interoperable with either hospital-wide imaging archives or neurovascular registries.

This fragmentation stymies longitudinal patient monitoring and restricts real-world data aggregation for clinical insights.” Moreover, the indeterminacy in reimbursement systems in various locations discourages smaller centers from venturing into TCD, particularly against other much more informative imaging techniques such as MRI or CT angiography.

Opportunities

Integration with Stroke Pathways, Continuous Bedside Monitoring, and Miniaturization of Systems Fueling Future Adoption

Clinical workflow changes align with an emerging transcranial Doppler ultrasound system market opportunity. One of the most exciting areas is the growing incorporation of the system into acute stroke pathways, where timely assessment of large vessel occlusion via TCD provides a time-sensitive, bedside, non-invasive triage tool particularly important in settings without immediate access to CT angiography.

Continuous bedside surveillance of cerebral autoregulation and vasospasm in neurocritical care units is additionally gaining traction, reflecting an evolution of the TCD’s role from single-use imaging to dynamic cerebrovascular management.

For ambulance, field hospitals and even military settings, now manufacturers are targeted on moving towards miniaturized devices which NSERC’s Kent Hillier explains, are lightweight, wireless and battery operated.

Such progression is driving a demand surge in prehospital and remote applications. As health systems evolve to prioritize portability and real-time neuromonitoring, TCD systems have begun positioning themselves in ways that go beyond diagnostics, embedding within the cerebral care pathway.

Country-wise Insights

United States

Market Outlook

The United States market for transcranial Doppler ultrasound equipment is growing strongly, driven by the expanding clinical application of non-invasive cerebral blood flow monitoring in stroke triage, TBI, and intensive care. Large stroke centers are incorporating TCD into formalized stroke protocols, and mobile stroke units with portable Doppler systems are spreading state to state.

Post-concussion surveillance demand is also growing in sports neurology. As AI-driven diagnostic interpretation is becoming of interest to the FDA, local manufacturers and educational institutions are expediting TCD-based innovations in brain perfusion mapping.

Market Growth Factors

  • Widespread Prevalence of Stroke and TBI: High rate of ischemic strokes and traumatic brain injuries in adults drives the adoption of cerebral blood flow monitoring.
  • Aging Population: A growing elderly population is more vulnerable to cerebrovascular complications, increasing demand for non-invasive brain monitoring.
  • Technology: Integration of AI and ML into TCD systems is improving diagnostic speed, accuracy, and accessibility in emergency and outpatient settings.
  • Healthcare Infrastructure: Advanced stroke care units and neurocritical facilities enable widespread adoption of specialized Doppler systems.
  • Mobile Stroke Units: Expansion of pre-hospital stroke care vehicles equipped with TCD supports early triage and intervention.

Market Forecast

Year CAGR (2025 to 2035)
2025 to 2035 3.6%

India

Market Outlook

India's transcranial Doppler ultrasound system market is developing gradually, propelled by the increasing cerebrovascular disease burden and the demand for low-cost, portable neurodiagnostics in urban and rural environments. Public and private tertiary care hospitals are adopting TCD for stroke risk stratification, especially among patients with diabetes and hypertension.

The market is also gaining momentum in pediatric neurology for stroke screening in sickle cell disease. Local production of simplified Doppler units with regional-language user interfaces is improving access in non-metro clinics.

Market Growth Factors

  • Rising Stroke Burden: Increasing incidence of stroke and hypertension in urban and semi-urban areas necessitates scalable diagnostic tools.
  • Cost-Sensitive Innovation: Local manufacturers developing affordable, portable Doppler units tailored for diverse clinical environments.
  • Rural Access Initiatives: Government healthcare outreach and mobile diagnostics programs are enabling TCD usage in under-served regions.
  • Growing Neuro Awareness: Expansion of neurology departments and stroke awareness campaigns drive clinical demand for cerebral blood flow monitoring.
  • Public-Private Partnerships: Collaborations for early stroke screening and diagnostics in high-risk populations are fueling adoption.

Market Forecast

Year CAGR (2025 to 2035)
2025 to 2035 7.6%

Germany

Market Outlook

Germany is a mature and innovation-focused transcranial Doppler ultrasound system market, with extensive integration into neurovascular monitoring protocols. Stroke centers and university hospitals utilize TCD for real-time monitoring of cerebral emboli, vasospasm, and autoregulation as part of routine clinical practice.

The market enjoys organized clinical pathways, favorable reimbursement, and research institution-device manufacturer collaboration to try next-generation Doppler imaging modules. Robust regulatory requirements and early adoption of AI help foster continuous system optimization.

Market Growth Factors

  • Standardized Clinical Protocols: TCD is embedded in neurovascular monitoring protocols, especially in stroke and neurosurgery units.
  • Strong Research Ecosystem: Academic and clinical research trials using TCD for vasospasm, emboli detection, and autoregulation are increasing market usage.
  • Reimbursement Support: Favorable healthcare policies cover TCD assessments as part of neurovascular diagnostic pathways.
  • High-Precision Demand: Preference for advanced Doppler systems with automated waveform analytics in university and teaching hospitals.
  • Technology Partnerships: Integration of TCD with other neuroimaging modalities and AI for multi-parameter brain monitoring.

Market Forecast

Year CAGR (2025 to 2035)
2025 to 2035 3.3%

China

Market Outlook

China's transcranial doppler ultrasound system market is growing at a breakneck pace, driven by intensive investments in stroke prevention infrastructure and early detection initiatives. TCD systems are spread across provincial stroke centers and community health centers, particularly for high-risk groups.

Domestic players are designing miniature, AI-capable Doppler devices for high-volume screening applications, while government healthcare technology policies remain supportive of rural stroke network adoption. Integration with mobile health (mHealth) platforms for cerebral blood flow monitoring is a new trend.

Market Growth Factors

  • National Stroke Strategy: Government-led stroke prevention campaigns have led to widespread demand for fast, non-invasive cerebral assessment tools.
  • Urbanization and Lifestyle Risk: Rising prevalence of hypertension and vascular conditions in cities increases need for TCD-based screening.
  • Domestic Manufacturing Surge: Local companies are producing compact, low-cost systems suited for large-scale deployment.
  • mHealth Integration: Growing use of smartphone-compatible and app-based monitoring platforms boosts interest in mobile Doppler solutions.
  • Tier 2/3 Expansion: Market growth supported by diagnostic investments in provincial hospitals and community health centers.

Market Forecast

Year CAGR (2025 to 2035)
2025 to 2035 7.0%

Brazil

Market Outlook

Brazil's transcranial Doppler ultrasound system market is picking up pace, especially within public hospitals and academic neurology divisions, as non-invasive monitoring takes center stage in stroke care and neurovascular research.

There is increasing recognition of TCD's value in the detection of intracranial stenosis and embolic signals, particularly within risk groups for sickle cell anemia and other inherited diseases. The market is also enhanced through collaborations between international suppliers and local distributors, enabling access to battery- and mobile-powered systems in disadvantaged regions.

Market Growth Factors

  • High-Risk Populations: Increased use of TCD in stroke-prone groups, especially for monitoring sickle cell anemia and embolic events.
  • Academic Demand: Neurology departments in public universities are incorporating TCD into cerebrovascular research protocols.
  • Public Sector Adoption: Growing procurement by state-funded hospitals for use in emergency and ICU environments.
  • Technology Import Partnerships: Collaboration with global TCD manufacturers for access to portable and AI-enabled systems.
  • Healthcare Decentralization: Shift toward regional diagnostic centers is creating demand for cost-effective, mobile-friendly TCD units.

Market Forecast

Year CAGR (2025 to 2035)
2025 to 2035 3.9%

Competitive Outlook

The transcranial Doppler ultrasound systems market is booming at a high rate owing to rising awareness regarding cerebrovascular diseases, increase in geriatric population and continuous developments in diagnostic technology. Such systems are crucial for evaluating cerebral hemodynamics and monitoring diseases, such as stroke, stroke, traumatic brain injury (TBI) and vascular disorders.

Hospitals, (Emergency) departments and specialized neuroclinics are the major end-users of the TCD system and seek for efficient, non-invasive diagnostic systems. The competition in the industry consists of a mixture of well-established diagnostic equipment vendors, that have existed for several decades, as well as those that are newer entrants, that provide novel solutions such as devices for portability, AI-powered analyses, and high-accuracy systems for real-time monitoring.

Key Developments

In 2025, NeuraSignal is excited to announce a new study by Dr. Thomas Devlin's team, featured at ISC 2025. It demonstrates how NeuraSignal’s robot-assisted transcranial Doppler (raTCD) outperforms traditional methods in detecting right-to-left shunts (RLS) and patent foramen ovale (PFO), key contributors to cryptogenic stroke.

In 2024, University of California San Diego have developed a revolutionary wearable ultrasound patch for continuous, non-invasive brain blood flow monitoring. Worn on the temple, this soft, stretchy patch provides 3D cerebral blood flow data, a first for wearable tech. It significantly advances beyond operator-dependent transcranial Doppler ultrasound, offering a consistent, comfortable solution for long-term clinical use.

Companies

  • Rimed
  • Compumedics Germany GmbH
  • Natus Medical Incorporated
  • Viasonix
  • Dawei
  • Recorders & Medicare Systems P Ltd.
  • Shenzhen Delica Medical Equipment Co., Ltd.
  • NeuraSignal, Inc.
  • ATYS Medical
  • Multigon Industries Inc

Key Segments 

By Products:

  • Non-wearable Transcranial Doppler Ultrasound Systems
  • Wearable Transcranial Doppler Ultrasound Systems

By Component:

  • Systems
  • Accessories

By Modality Type:

  • Standalone
  • Portable

By End User:

  • Hospitals
  • Diagnostic Imaging Centers
  • Neurology Clinics
  • Others

By Region:

  • North America
  • Latin America
  • East Asia
  • South Asia and Pacific
  • Western Europe
  • Eastern Europe
  • Middle East and Africa

Table of Content

  1. Executive Summary
  2. Industry Introduction, including Taxonomy and Market Definition
  3. Market Trends and Success Factors, including Macro-economic Factors, Market Dynamics, and Recent Industry Developments
  4. Global Market Demand (Value in USD) and Volume (Units) Analysis 2020 to 2024 and Forecast 2025 to 2035, including Historical Analysis and Future Projections
  5. Global Market - Pricing Analysis
  6. Global Market Analysis 2020 to 2024 and Forecast 2025 to 2035
    • By Product
    • By Component Type
    • By Modality Type
    • By End User
    • By Region
  7. Global Market Analysis 2020 to 2024 and Forecast 2025 to 2035, By Products
    • Non-wearable Transcranial Doppler Ultrasound Systems
    • Wearable Transcranial Doppler Ultrasound Systems
  8. Global Market Analysis 2020 to 2024 and Forecast 2025 to 2035, By Component
    • Systems
    • Accessories
  9. Global Market Analysis 2020 to 2024 and Forecast 2025 to 2035, By Modality Type
    • Standalone
    • Portable
  10. Global Market Analysis 2020 to 2024 and Forecast 2025 to 2035, By End User
    • Hospitals
    • Diagnostic Imaging Centers
    • Neurology Clinics
    • Others
  11. Global Market Analysis 2020 to 2024 and Forecast 2025 to 2035, By Region
    • North America
    • Latin America
    • East Asia
    • South Asia and Pacific
    • Western Europe
    • Eastern Europe
    • Middle East and Africa
  12. North America Sales Analysis 2020 to 2024 and Forecast 2025 to 2035, by Key Segments and Countries
  13. Latin America Sales Analysis 2020 to 2024 and Forecast 2025 to 2035, by Key Segments and Countries
  14. East Asia Sales Analysis 2020 to 2024 and Forecast 2025 to 2035, by Key Segments and Countries
  15. South Asia & Pacific Sales Analysis 2020 to 2024 and Forecast 2025 to 2035, by Key Segments and Countries
  16. Western Europe Sales Analysis 2020 to 2024 and Forecast 2025 to 2035, by Key Segments and Countries
  17. Eastern Europe Sales Analysis 2020 to 2024 and Forecast 2025 to 2035, by Key Segments and Countries
  18. Middle East and Africa Sales Analysis 2020 to 2024 and Forecast 2025 to 2035, by Key Segments and Countries
  19. Sales Forecast 2025 to 2035 by Product, Component Type, Modality Type and End User for 30 Countries
  20. Competition Outlook, including Market Structure Analysis, Company Share Analysis by Key Players, and Competition Dashboard
  21. Company Profile
    • Natus Medical Incorporated
    • Interacoustics A/S (Demant)
    • GN Otometrics
    • Neural Analytics
    • Micromedical Technologies
    • ELCAT
    • Rimed
    • SMT Medical GmbH & Co. KG
    • Recorders & Medicare Systems Pvt. Ltd.
    • DX-Systems
    • Elica
    • Multigon Industries Inc.
    • Atys Medica

List of Tables

  • Table 1: Global Market Value (USD Million) Forecast by Region, 2020 to 2035
  • Table 2: Global Market Volume (Units) Forecast by Region, 2020 to 2035
  • Table 3: Global Market Value (USD Million) Forecast by Product Type, 2020 to 2035
  • Table 4: Global Market Volume (Units) Forecast by Product Type, 2020 to 2035
  • Table 5: Global Market Value (USD Million) Forecast by Component Type, 2020 to 2035
  • Table 6: Global Market Volume (Units) Forecast by Component Type, 2020 to 2035
  • Table 7: Global Market Value (USD Million) Forecast by Modality Type, 2020 to 2035
  • Table 8: Global Market Volume (Units) Forecast by Modality Type, 2020 to 2035
  • Table 9: Global Market Value (USD Million) Forecast by End Use, 2020 to 2035
  • Table 10: Global Market Volume (Units) Forecast by End Use, 2020 to 2035
  • Table 11: North America Market Value (USD Million) Forecast by Country, 2020 to 2035
  • Table 12: North America Market Volume (Units) Forecast by Country, 2020 to 2035
  • Table 13: North America Market Value (USD Million) Forecast by Product Type, 2020 to 2035
  • Table 14: North America Market Volume (Units) Forecast by Product Type, 2020 to 2035
  • Table 15: North America Market Value (USD Million) Forecast by Component Type, 2020 to 2035
  • Table 16: North America Market Volume (Units) Forecast by Component Type, 2020 to 2035
  • Table 17: North America Market Value (USD Million) Forecast by Modality Type, 2020 to 2035
  • Table 18: North America Market Volume (Units) Forecast by Modality Type, 2020 to 2035
  • Table 19: North America Market Value (USD Million) Forecast by End Use, 2020 to 2035
  • Table 20: North America Market Volume (Units) Forecast by End Use, 2020 to 2035
  • Table 21: Latin America Market Value (USD Million) Forecast by Country, 2020 to 2035
  • Table 22: Latin America Market Volume (Units) Forecast by Country, 2020 to 2035
  • Table 23: Latin America Market Value (USD Million) Forecast by Product Type, 2020 to 2035
  • Table 24: Latin America Market Volume (Units) Forecast by Product Type, 2020 to 2035
  • Table 25: Latin America Market Value (USD Million) Forecast by Component Type, 2020 to 2035
  • Table 26: Latin America Market Volume (Units) Forecast by Component Type, 2020 to 2035
  • Table 27: Latin America Market Value (USD Million) Forecast by Modality Type, 2020 to 2035
  • Table 28: Latin America Market Volume (Units) Forecast by Modality Type, 2020 to 2035
  • Table 29: Latin America Market Value (USD Million) Forecast by End Use, 2020 to 2035
  • Table 30: Latin America Market Volume (Units) Forecast by End Use, 2020 to 2035
  • Table 31: Western Europe Market Value (USD Million) Forecast by Country, 2020 to 2035
  • Table 32: Western Europe Market Volume (Units) Forecast by Country, 2020 to 2035
  • Table 33: Western Europe Market Value (USD Million) Forecast by Product Type, 2020 to 2035
  • Table 34: Western Europe Market Volume (Units) Forecast by Product Type, 2020 to 2035
  • Table 35: Western Europe Market Value (USD Million) Forecast by Component Type, 2020 to 2035
  • Table 36: Western Europe Market Volume (Units) Forecast by Component Type, 2020 to 2035
  • Table 37: Western Europe Market Value (USD Million) Forecast by Modality Type, 2020 to 2035
  • Table 38: Western Europe Market Volume (Units) Forecast by Modality Type, 2020 to 2035
  • Table 39: Western Europe Market Value (USD Million) Forecast by End Use, 2020 to 2035
  • Table 40: Western Europe Market Volume (Units) Forecast by End Use, 2020 to 2035
  • Table 41: Eastern Europe Market Value (USD Million) Forecast by Country, 2020 to 2035
  • Table 42: Eastern Europe Market Volume (Units) Forecast by Country, 2020 to 2035
  • Table 43: Eastern Europe Market Value (USD Million) Forecast by Product Type, 2020 to 2035
  • Table 44: Eastern Europe Market Volume (Units) Forecast by Product Type, 2020 to 2035
  • Table 45: Eastern Europe Market Value (USD Million) Forecast by Component Type, 2020 to 2035
  • Table 46: Eastern Europe Market Volume (Units) Forecast by Component Type, 2020 to 2035
  • Table 47: Eastern Europe Market Value (USD Million) Forecast by Modality Type, 2020 to 2035
  • Table 48: Eastern Europe Market Volume (Units) Forecast by Modality Type, 2020 to 2035
  • Table 49: Eastern Europe Market Value (USD Million) Forecast by End Use, 2020 to 2035
  • Table 50: Eastern Europe Market Volume (Units) Forecast by End Use, 2020 to 2035
  • Table 51: South Asia and Pacific Market Value (USD Million) Forecast by Country, 2020 to 2035
  • Table 52: South Asia and Pacific Market Volume (Units) Forecast by Country, 2020 to 2035
  • Table 53: South Asia and Pacific Market Value (USD Million) Forecast by Product Type, 2020 to 2035
  • Table 54: South Asia and Pacific Market Volume (Units) Forecast by Product Type, 2020 to 2035
  • Table 55: South Asia and Pacific Market Value (USD Million) Forecast by Component Type, 2020 to 2035
  • Table 56: South Asia and Pacific Market Volume (Units) Forecast by Component Type, 2020 to 2035
  • Table 57: South Asia and Pacific Market Value (USD Million) Forecast by Modality Type, 2020 to 2035
  • Table 58: South Asia and Pacific Market Volume (Units) Forecast by Modality Type, 2020 to 2035
  • Table 59: South Asia and Pacific Market Value (USD Million) Forecast by End Use, 2020 to 2035
  • Table 60: South Asia and Pacific Market Volume (Units) Forecast by End Use, 2020 to 2035
  • Table 61: East Asia Market Value (USD Million) Forecast by Country, 2020 to 2035
  • Table 62: East Asia Market Volume (Units) Forecast by Country, 2020 to 2035
  • Table 63: East Asia Market Value (USD Million) Forecast by Product Type, 2020 to 2035
  • Table 64: East Asia Market Volume (Units) Forecast by Product Type, 2020 to 2035
  • Table 65: East Asia Market Value (USD Million) Forecast by Component Type, 2020 to 2035
  • Table 66: East Asia Market Volume (Units) Forecast by Component Type, 2020 to 2035
  • Table 67: East Asia Market Value (USD Million) Forecast by Modality Type, 2020 to 2035
  • Table 68: East Asia Market Volume (Units) Forecast by Modality Type, 2020 to 2035
  • Table 69: East Asia Market Value (USD Million) Forecast by End Use, 2020 to 2035
  • Table 70: East Asia Market Volume (Units) Forecast by End Use, 2020 to 2035
  • Table 71: Middle East and Africa Market Value (USD Million) Forecast by Country, 2020 to 2035
  • Table 72: Middle East and Africa Market Volume (Units) Forecast by Country, 2020 to 2035
  • Table 73: Middle East and Africa Market Value (USD Million) Forecast by Product Type, 2020 to 2035
  • Table 74: Middle East and Africa Market Volume (Units) Forecast by Product Type, 2020 to 2035
  • Table 75: Middle East and Africa Market Value (USD Million) Forecast by Component Type, 2020 to 2035
  • Table 76: Middle East and Africa Market Volume (Units) Forecast by Component Type, 2020 to 2035
  • Table 77: Middle East and Africa Market Value (USD Million) Forecast by Modality Type, 2020 to 2035
  • Table 78: Middle East and Africa Market Volume (Units) Forecast by Modality Type, 2020 to 2035
  • Table 79: Middle East and Africa Market Value (USD Million) Forecast by End Use, 2020 to 2035
  • Table 80: Middle East and Africa Market Volume (Units) Forecast by End Use, 2020 to 2035

List of Figures

  • Figure 1: Global Market Value (USD Million) by Product Type, 2025 to 2035
  • Figure 2: Global Market Value (USD Million) by Component Type, 2025 to 2035
  • Figure 3: Global Market Value (USD Million) by Modality Type, 2025 to 2035
  • Figure 4: Global Market Value (USD Million) by End Use, 2025 to 2035
  • Figure 5: Global Market Value (USD Million) by Region, 2025 to 2035
  • Figure 6: Global Market Value (USD Million) Analysis by Region, 2020 to 2035
  • Figure 7: Global Market Volume (Units) Analysis by Region, 2020 to 2035
  • Figure 8: Global Market Value Share (%) and BPS Analysis by Region, 2025 to 2035
  • Figure 9: Global Market Y-o-Y Growth (%) Projections by Region, 2025 to 2035
  • Figure 10: Global Market Value (USD Million) Analysis by Product Type, 2020 to 2035
  • Figure 11: Global Market Volume (Units) Analysis by Product Type, 2020 to 2035
  • Figure 12: Global Market Value Share (%) and BPS Analysis by Product Type, 2025 to 2035
  • Figure 13: Global Market Y-o-Y Growth (%) Projections by Product Type, 2025 to 2035
  • Figure 14: Global Market Value (USD Million) Analysis by Component Type, 2020 to 2035
  • Figure 15: Global Market Volume (Units) Analysis by Component Type, 2020 to 2035
  • Figure 16: Global Market Value Share (%) and BPS Analysis by Component Type, 2025 to 2035
  • Figure 17: Global Market Y-o-Y Growth (%) Projections by Component Type, 2025 to 2035
  • Figure 18: Global Market Value (USD Million) Analysis by Modality Type, 2020 to 2035
  • Figure 19: Global Market Volume (Units) Analysis by Modality Type, 2020 to 2035
  • Figure 20: Global Market Value Share (%) and BPS Analysis by Modality Type, 2025 to 2035
  • Figure 21: Global Market Y-o-Y Growth (%) Projections by Modality Type, 2025 to 2035
  • Figure 22: Global Market Value (USD Million) Analysis by End Use, 2020 to 2035
  • Figure 23: Global Market Volume (Units) Analysis by End Use, 2020 to 2035
  • Figure 24: Global Market Value Share (%) and BPS Analysis by End Use, 2025 to 2035
  • Figure 25: Global Market Y-o-Y Growth (%) Projections by End Use, 2025 to 2035
  • Figure 26: Global Market Attractiveness by Product Type, 2025 to 2035
  • Figure 27: Global Market Attractiveness by Component Type, 2025 to 2035
  • Figure 28: Global Market Attractiveness by Modality Type, 2025 to 2035
  • Figure 29: Global Market Attractiveness by End Use, 2025 to 2035
  • Figure 30: Global Market Attractiveness by Region, 2025 to 2035
  • Figure 31: North America Market Value (USD Million) by Product Type, 2025 to 2035
  • Figure 32: North America Market Value (USD Million) by Component Type, 2025 to 2035
  • Figure 33: North America Market Value (USD Million) by Modality Type, 2025 to 2035
  • Figure 34: North America Market Value (USD Million) by End Use, 2025 to 2035
  • Figure 35: North America Market Value (USD Million) by Country, 2025 to 2035
  • Figure 36: North America Market Value (USD Million) Analysis by Country, 2020 to 2035
  • Figure 37: North America Market Volume (Units) Analysis by Country, 2020 to 2035
  • Figure 38: North America Market Value Share (%) and BPS Analysis by Country, 2025 to 2035
  • Figure 39: North America Market Y-o-Y Growth (%) Projections by Country, 2025 to 2035
  • Figure 40: North America Market Value (USD Million) Analysis by Product Type, 2020 to 2035
  • Figure 41: North America Market Volume (Units) Analysis by Product Type, 2020 to 2035
  • Figure 42: North America Market Value Share (%) and BPS Analysis by Product Type, 2025 to 2035
  • Figure 43: North America Market Y-o-Y Growth (%) Projections by Product Type, 2025 to 2035
  • Figure 44: North America Market Value (USD Million) Analysis by Component Type, 2020 to 2035
  • Figure 45: North America Market Volume (Units) Analysis by Component Type, 2020 to 2035
  • Figure 46: North America Market Value Share (%) and BPS Analysis by Component Type, 2025 to 2035
  • Figure 47: North America Market Y-o-Y Growth (%) Projections by Component Type, 2025 to 2035
  • Figure 48: North America Market Value (USD Million) Analysis by Modality Type, 2020 to 2035
  • Figure 49: North America Market Volume (Units) Analysis by Modality Type, 2020 to 2035
  • Figure 50: North America Market Value Share (%) and BPS Analysis by Modality Type, 2025 to 2035
  • Figure 51: North America Market Y-o-Y Growth (%) Projections by Modality Type, 2025 to 2035
  • Figure 52: North America Market Value (USD Million) Analysis by End Use, 2020 to 2035
  • Figure 53: North America Market Volume (Units) Analysis by End Use, 2020 to 2035
  • Figure 54: North America Market Value Share (%) and BPS Analysis by End Use, 2025 to 2035
  • Figure 55: North America Market Y-o-Y Growth (%) Projections by End Use, 2025 to 2035
  • Figure 56: North America Market Attractiveness by Product Type, 2025 to 2035
  • Figure 57: North America Market Attractiveness by Component Type, 2025 to 2035
  • Figure 58: North America Market Attractiveness by Modality Type, 2025 to 2035
  • Figure 59: North America Market Attractiveness by End Use, 2025 to 2035
  • Figure 60: North America Market Attractiveness by Country, 2025 to 2035
  • Figure 61: Latin America Market Value (USD Million) by Product Type, 2025 to 2035
  • Figure 62: Latin America Market Value (USD Million) by Component Type, 2025 to 2035
  • Figure 63: Latin America Market Value (USD Million) by Modality Type, 2025 to 2035
  • Figure 64: Latin America Market Value (USD Million) by End Use, 2025 to 2035
  • Figure 65: Latin America Market Value (USD Million) by Country, 2025 to 2035
  • Figure 66: Latin America Market Value (USD Million) Analysis by Country, 2020 to 2035
  • Figure 67: Latin America Market Volume (Units) Analysis by Country, 2020 to 2035
  • Figure 68: Latin America Market Value Share (%) and BPS Analysis by Country, 2025 to 2035
  • Figure 69: Latin America Market Y-o-Y Growth (%) Projections by Country, 2025 to 2035
  • Figure 70: Latin America Market Value (USD Million) Analysis by Product Type, 2020 to 2035
  • Figure 71: Latin America Market Volume (Units) Analysis by Product Type, 2020 to 2035
  • Figure 72: Latin America Market Value Share (%) and BPS Analysis by Product Type, 2025 to 2035
  • Figure 73: Latin America Market Y-o-Y Growth (%) Projections by Product Type, 2025 to 2035
  • Figure 74: Latin America Market Value (USD Million) Analysis by Component Type, 2020 to 2035
  • Figure 75: Latin America Market Volume (Units) Analysis by Component Type, 2020 to 2035
  • Figure 76: Latin America Market Value Share (%) and BPS Analysis by Component Type, 2025 to 2035
  • Figure 77: Latin America Market Y-o-Y Growth (%) Projections by Component Type, 2025 to 2035
  • Figure 78: Latin America Market Value (USD Million) Analysis by Modality Type, 2020 to 2035
  • Figure 79: Latin America Market Volume (Units) Analysis by Modality Type, 2020 to 2035
  • Figure 80: Latin America Market Value Share (%) and BPS Analysis by Modality Type, 2025 to 2035
  • Figure 81: Latin America Market Y-o-Y Growth (%) Projections by Modality Type, 2025 to 2035
  • Figure 82: Latin America Market Value (USD Million) Analysis by End Use, 2020 to 2035
  • Figure 83: Latin America Market Volume (Units) Analysis by End Use, 2020 to 2035
  • Figure 84: Latin America Market Value Share (%) and BPS Analysis by End Use, 2025 to 2035
  • Figure 85: Latin America Market Y-o-Y Growth (%) Projections by End Use, 2025 to 2035
  • Figure 86: Latin America Market Attractiveness by Product Type, 2025 to 2035
  • Figure 87: Latin America Market Attractiveness by Component Type, 2025 to 2035
  • Figure 88: Latin America Market Attractiveness by Modality Type, 2025 to 2035
  • Figure 89: Latin America Market Attractiveness by End Use, 2025 to 2035
  • Figure 90: Latin America Market Attractiveness by Country, 2025 to 2035
  • Figure 91: Western Europe Market Value (USD Million) by Product Type, 2025 to 2035
  • Figure 92: Western Europe Market Value (USD Million) by Component Type, 2025 to 2035
  • Figure 93: Western Europe Market Value (USD Million) by Modality Type, 2025 to 2035
  • Figure 94: Western Europe Market Value (USD Million) by End Use, 2025 to 2035
  • Figure 95: Western Europe Market Value (USD Million) by Country, 2025 to 2035
  • Figure 96: Western Europe Market Value (USD Million) Analysis by Country, 2020 to 2035
  • Figure 97: Western Europe Market Volume (Units) Analysis by Country, 2020 to 2035
  • Figure 98: Western Europe Market Value Share (%) and BPS Analysis by Country, 2025 to 2035
  • Figure 99: Western Europe Market Y-o-Y Growth (%) Projections by Country, 2025 to 2035
  • Figure 100: Western Europe Market Value (USD Million) Analysis by Product Type, 2020 to 2035
  • Figure 101: Western Europe Market Volume (Units) Analysis by Product Type, 2020 to 2035
  • Figure 102: Western Europe Market Value Share (%) and BPS Analysis by Product Type, 2025 to 2035
  • Figure 103: Western Europe Market Y-o-Y Growth (%) Projections by Product Type, 2025 to 2035
  • Figure 104: Western Europe Market Value (USD Million) Analysis by Component Type, 2020 to 2035
  • Figure 105: Western Europe Market Volume (Units) Analysis by Component Type, 2020 to 2035
  • Figure 106: Western Europe Market Value Share (%) and BPS Analysis by Component Type, 2025 to 2035
  • Figure 107: Western Europe Market Y-o-Y Growth (%) Projections by Component Type, 2025 to 2035
  • Figure 108: Western Europe Market Value (USD Million) Analysis by Modality Type, 2020 to 2035
  • Figure 109: Western Europe Market Volume (Units) Analysis by Modality Type, 2020 to 2035
  • Figure 110: Western Europe Market Value Share (%) and BPS Analysis by Modality Type, 2025 to 2035
  • Figure 111: Western Europe Market Y-o-Y Growth (%) Projections by Modality Type, 2025 to 2035
  • Figure 112: Western Europe Market Value (USD Million) Analysis by End Use, 2020 to 2035
  • Figure 113: Western Europe Market Volume (Units) Analysis by End Use, 2020 to 2035
  • Figure 114: Western Europe Market Value Share (%) and BPS Analysis by End Use, 2025 to 2035
  • Figure 115: Western Europe Market Y-o-Y Growth (%) Projections by End Use, 2025 to 2035
  • Figure 116: Western Europe Market Attractiveness by Product Type, 2025 to 2035
  • Figure 117: Western Europe Market Attractiveness by Component Type, 2025 to 2035
  • Figure 118: Western Europe Market Attractiveness by Modality Type, 2025 to 2035
  • Figure 119: Western Europe Market Attractiveness by End Use, 2025 to 2035
  • Figure 120: Western Europe Market Attractiveness by Country, 2025 to 2035
  • Figure 121: Eastern Europe Market Value (USD Million) by Product Type, 2025 to 2035
  • Figure 122: Eastern Europe Market Value (USD Million) by Component Type, 2025 to 2035
  • Figure 123: Eastern Europe Market Value (USD Million) by Modality Type, 2025 to 2035
  • Figure 124: Eastern Europe Market Value (USD Million) by End Use, 2025 to 2035
  • Figure 125: Eastern Europe Market Value (USD Million) by Country, 2025 to 2035
  • Figure 126: Eastern Europe Market Value (USD Million) Analysis by Country, 2020 to 2035
  • Figure 127: Eastern Europe Market Volume (Units) Analysis by Country, 2020 to 2035
  • Figure 128: Eastern Europe Market Value Share (%) and BPS Analysis by Country, 2025 to 2035
  • Figure 129: Eastern Europe Market Y-o-Y Growth (%) Projections by Country, 2025 to 2035
  • Figure 130: Eastern Europe Market Value (USD Million) Analysis by Product Type, 2020 to 2035
  • Figure 131: Eastern Europe Market Volume (Units) Analysis by Product Type, 2020 to 2035
  • Figure 132: Eastern Europe Market Value Share (%) and BPS Analysis by Product Type, 2025 to 2035
  • Figure 133: Eastern Europe Market Y-o-Y Growth (%) Projections by Product Type, 2025 to 2035
  • Figure 134: Eastern Europe Market Value (USD Million) Analysis by Component Type, 2020 to 2035
  • Figure 135: Eastern Europe Market Volume (Units) Analysis by Component Type, 2020 to 2035
  • Figure 136: Eastern Europe Market Value Share (%) and BPS Analysis by Component Type, 2025 to 2035
  • Figure 137: Eastern Europe Market Y-o-Y Growth (%) Projections by Component Type, 2025 to 2035
  • Figure 138: Eastern Europe Market Value (USD Million) Analysis by Modality Type, 2020 to 2035
  • Figure 139: Eastern Europe Market Volume (Units) Analysis by Modality Type, 2020 to 2035
  • Figure 140: Eastern Europe Market Value Share (%) and BPS Analysis by Modality Type, 2025 to 2035
  • Figure 141: Eastern Europe Market Y-o-Y Growth (%) Projections by Modality Type, 2025 to 2035
  • Figure 142: Eastern Europe Market Value (USD Million) Analysis by End Use, 2020 to 2035
  • Figure 143: Eastern Europe Market Volume (Units) Analysis by End Use, 2020 to 2035
  • Figure 144: Eastern Europe Market Value Share (%) and BPS Analysis by End Use, 2025 to 2035
  • Figure 145: Eastern Europe Market Y-o-Y Growth (%) Projections by End Use, 2025 to 2035
  • Figure 146: Eastern Europe Market Attractiveness by Product Type, 2025 to 2035
  • Figure 147: Eastern Europe Market Attractiveness by Component Type, 2025 to 2035
  • Figure 148: Eastern Europe Market Attractiveness by Modality Type, 2025 to 2035
  • Figure 149: Eastern Europe Market Attractiveness by End Use, 2025 to 2035
  • Figure 150: Eastern Europe Market Attractiveness by Country, 2025 to 2035
  • Figure 151: South Asia and Pacific Market Value (USD Million) by Product Type, 2025 to 2035
  • Figure 152: South Asia and Pacific Market Value (USD Million) by Component Type, 2025 to 2035
  • Figure 153: South Asia and Pacific Market Value (USD Million) by Modality Type, 2025 to 2035
  • Figure 154: South Asia and Pacific Market Value (USD Million) by End Use, 2025 to 2035
  • Figure 155: South Asia and Pacific Market Value (USD Million) by Country, 2025 to 2035
  • Figure 156: South Asia and Pacific Market Value (USD Million) Analysis by Country, 2020 to 2035
  • Figure 157: South Asia and Pacific Market Volume (Units) Analysis by Country, 2020 to 2035
  • Figure 158: South Asia and Pacific Market Value Share (%) and BPS Analysis by Country, 2025 to 2035
  • Figure 159: South Asia and Pacific Market Y-o-Y Growth (%) Projections by Country, 2025 to 2035
  • Figure 160: South Asia and Pacific Market Value (USD Million) Analysis by Product Type, 2020 to 2035
  • Figure 161: South Asia and Pacific Market Volume (Units) Analysis by Product Type, 2020 to 2035
  • Figure 162: South Asia and Pacific Market Value Share (%) and BPS Analysis by Product Type, 2025 to 2035
  • Figure 163: South Asia and Pacific Market Y-o-Y Growth (%) Projections by Product Type, 2025 to 2035
  • Figure 164: South Asia and Pacific Market Value (USD Million) Analysis by Component Type, 2020 to 2035
  • Figure 165: South Asia and Pacific Market Volume (Units) Analysis by Component Type, 2020 to 2035
  • Figure 166: South Asia and Pacific Market Value Share (%) and BPS Analysis by Component Type, 2025 to 2035
  • Figure 167: South Asia and Pacific Market Y-o-Y Growth (%) Projections by Component Type, 2025 to 2035
  • Figure 168: South Asia and Pacific Market Value (USD Million) Analysis by Modality Type, 2020 to 2035
  • Figure 169: South Asia and Pacific Market Volume (Units) Analysis by Modality Type, 2020 to 2035
  • Figure 170: South Asia and Pacific Market Value Share (%) and BPS Analysis by Modality Type, 2025 to 2035
  • Figure 171: South Asia and Pacific Market Y-o-Y Growth (%) Projections by Modality Type, 2025 to 2035
  • Figure 172: South Asia and Pacific Market Value (USD Million) Analysis by End Use, 2020 to 2035
  • Figure 173: South Asia and Pacific Market Volume (Units) Analysis by End Use, 2020 to 2035
  • Figure 174: South Asia and Pacific Market Value Share (%) and BPS Analysis by End Use, 2025 to 2035
  • Figure 175: South Asia and Pacific Market Y-o-Y Growth (%) Projections by End Use, 2025 to 2035
  • Figure 176: South Asia and Pacific Market Attractiveness by Product Type, 2025 to 2035
  • Figure 177: South Asia and Pacific Market Attractiveness by Component Type, 2025 to 2035
  • Figure 178: South Asia and Pacific Market Attractiveness by Modality Type, 2025 to 2035
  • Figure 179: South Asia and Pacific Market Attractiveness by End Use, 2025 to 2035
  • Figure 180: South Asia and Pacific Market Attractiveness by Country, 2025 to 2035
  • Figure 181: East Asia Market Value (USD Million) by Product Type, 2025 to 2035
  • Figure 182: East Asia Market Value (USD Million) by Component Type, 2025 to 2035
  • Figure 183: East Asia Market Value (USD Million) by Modality Type, 2025 to 2035
  • Figure 184: East Asia Market Value (USD Million) by End Use, 2025 to 2035
  • Figure 185: East Asia Market Value (USD Million) by Country, 2025 to 2035
  • Figure 186: East Asia Market Value (USD Million) Analysis by Country, 2020 to 2035
  • Figure 187: East Asia Market Volume (Units) Analysis by Country, 2020 to 2035
  • Figure 188: East Asia Market Value Share (%) and BPS Analysis by Country, 2025 to 2035
  • Figure 189: East Asia Market Y-o-Y Growth (%) Projections by Country, 2025 to 2035
  • Figure 190: East Asia Market Value (USD Million) Analysis by Product Type, 2020 to 2035
  • Figure 191: East Asia Market Volume (Units) Analysis by Product Type, 2020 to 2035
  • Figure 192: East Asia Market Value Share (%) and BPS Analysis by Product Type, 2025 to 2035
  • Figure 193: East Asia Market Y-o-Y Growth (%) Projections by Product Type, 2025 to 2035
  • Figure 194: East Asia Market Value (USD Million) Analysis by Component Type, 2020 to 2035
  • Figure 195: East Asia Market Volume (Units) Analysis by Component Type, 2020 to 2035
  • Figure 196: East Asia Market Value Share (%) and BPS Analysis by Component Type, 2025 to 2035
  • Figure 197: East Asia Market Y-o-Y Growth (%) Projections by Component Type, 2025 to 2035
  • Figure 198: East Asia Market Value (USD Million) Analysis by Modality Type, 2020 to 2035
  • Figure 199: East Asia Market Volume (Units) Analysis by Modality Type, 2020 to 2035
  • Figure 200: East Asia Market Value Share (%) and BPS Analysis by Modality Type, 2025 to 2035
  • Figure 201: East Asia Market Y-o-Y Growth (%) Projections by Modality Type, 2025 to 2035
  • Figure 202: East Asia Market Value (USD Million) Analysis by End Use, 2020 to 2035
  • Figure 203: East Asia Market Volume (Units) Analysis by End Use, 2020 to 2035
  • Figure 204: East Asia Market Value Share (%) and BPS Analysis by End Use, 2025 to 2035
  • Figure 205: East Asia Market Y-o-Y Growth (%) Projections by End Use, 2025 to 2035
  • Figure 206: East Asia Market Attractiveness by Product Type, 2025 to 2035
  • Figure 207: East Asia Market Attractiveness by Component Type, 2025 to 2035
  • Figure 208: East Asia Market Attractiveness by Modality Type, 2025 to 2035
  • Figure 209: East Asia Market Attractiveness by End Use, 2025 to 2035
  • Figure 210: East Asia Market Attractiveness by Country, 2025 to 2035
  • Figure 211: Middle East and Africa Market Value (USD Million) by Product Type, 2025 to 2035
  • Figure 212: Middle East and Africa Market Value (USD Million) by Component Type, 2025 to 2035
  • Figure 213: Middle East and Africa Market Value (USD Million) by Modality Type, 2025 to 2035
  • Figure 214: Middle East and Africa Market Value (USD Million) by End Use, 2025 to 2035
  • Figure 215: Middle East and Africa Market Value (USD Million) by Country, 2025 to 2035
  • Figure 216: Middle East and Africa Market Value (USD Million) Analysis by Country, 2020 to 2035
  • Figure 217: Middle East and Africa Market Volume (Units) Analysis by Country, 2020 to 2035
  • Figure 218: Middle East and Africa Market Value Share (%) and BPS Analysis by Country, 2025 to 2035
  • Figure 219: Middle East and Africa Market Y-o-Y Growth (%) Projections by Country, 2025 to 2035
  • Figure 220: Middle East and Africa Market Value (USD Million) Analysis by Product Type, 2020 to 2035
  • Figure 221: Middle East and Africa Market Volume (Units) Analysis by Product Type, 2020 to 2035
  • Figure 222: Middle East and Africa Market Value Share (%) and BPS Analysis by Product Type, 2025 to 2035
  • Figure 223: Middle East and Africa Market Y-o-Y Growth (%) Projections by Product Type, 2025 to 2035
  • Figure 224: Middle East and Africa Market Value (USD Million) Analysis by Component Type, 2020 to 2035
  • Figure 225: Middle East and Africa Market Volume (Units) Analysis by Component Type, 2020 to 2035
  • Figure 226: Middle East and Africa Market Value Share (%) and BPS Analysis by Component Type, 2025 to 2035
  • Figure 227: Middle East and Africa Market Y-o-Y Growth (%) Projections by Component Type, 2025 to 2035
  • Figure 228: Middle East and Africa Market Value (USD Million) Analysis by Modality Type, 2020 to 2035
  • Figure 229: Middle East and Africa Market Volume (Units) Analysis by Modality Type, 2020 to 2035
  • Figure 230: Middle East and Africa Market Value Share (%) and BPS Analysis by Modality Type, 2025 to 2035
  • Figure 231: Middle East and Africa Market Y-o-Y Growth (%) Projections by Modality Type, 2025 to 2035
  • Figure 232: Middle East and Africa Market Value (USD Million) Analysis by End Use, 2020 to 2035
  • Figure 233: Middle East and Africa Market Volume (Units) Analysis by End Use, 2020 to 2035
  • Figure 234: Middle East and Africa Market Value Share (%) and BPS Analysis by End Use, 2025 to 2035
  • Figure 235: Middle East and Africa Market Y-o-Y Growth (%) Projections by End Use, 2025 to 2035
  • Figure 236: Middle East and Africa Market Attractiveness by Product Type, 2025 to 2035
  • Figure 237: Middle East and Africa Market Attractiveness by Component Type, 2025 to 2035
  • Figure 238: Middle East and Africa Market Attractiveness by Modality Type, 2025 to 2035
  • Figure 239: Middle East and Africa Market Attractiveness by End Use, 2025 to 2035
  • Figure 240: Middle East and Africa Market Attractiveness by Country, 2025 to 2035

Frequently Asked Questions

What was the overall size of the Transcranial Doppler Ultrasounds System Market in 2025?

The overall market size for transcranial doppler ultrasounds system market was USD 364.1 million in 2025.

How big is the Transcranial Doppler Ultrasounds System Market expected in 2035?

The transcranial doppler ultrasounds system market is expected to reach USD 742.5 million in 2035.

What will drive the demand for Transcranial Doppler Ultrasounds System Market during the forecast period?

AI integration in transcranial Doppler systems is enhancing diagnostic accuracy for stroke and vascular conditions.

List the top 5 Key players of the Transcranial Doppler Ultrasounds System Market?

The top key players that drives the development of transcranial doppler ultrasounds system market are Natus Medical Incorporated, Interacoustics A/S (Demant), GN Otometrics, Neural Analytics and Micromedical Technologies

Which segment in product type is expected to lead in Transcranial Doppler Ultrasounds System Market?

Non-wearable is expected to command significant share over the assessment period.

Explore Similar Insights

Future Market Insights

Transcranial Doppler Ultrasounds System Market