The Ultrasound Conductivity Gels market is experiencing steady growth driven by increasing adoption of ultrasound diagnostics across healthcare facilities and the rising prevalence of chronic and acute medical conditions. The future outlook for this market is shaped by technological advancements in ultrasound imaging, which demand high-quality conductivity gels to ensure accurate signal transmission and improved image clarity. Growing investments in healthcare infrastructure, particularly in hospitals and diagnostic centers, are further supporting the market expansion.
Increasing awareness among medical professionals regarding the importance of gel quality in enhancing imaging efficiency and patient safety is also driving adoption. Additionally, the expansion of outpatient services and preventive healthcare programs has increased routine diagnostic procedures, leading to higher consumption of ultrasound gels.
The market benefits from rising healthcare spending, the proliferation of portable and point-of-care ultrasound devices, and the shift towards patient-centric care, which requires reliable and consistent diagnostic materials As the global healthcare sector continues to modernize, the demand for high-performance ultrasound conductivity gels is anticipated to sustain growth in both developed and emerging markets.

| Metric | Value |
|---|---|
| Ultrasound Conductivity Gels Market Estimated Value in (2025 E) | USD 351.3 million |
| Ultrasound Conductivity Gels Market Forecast Value in (2035 F) | USD 744.5 million |
| Forecast CAGR (2025 to 2035) | 7.8% |
The market is segmented by Product Type and End User and region. By Product Type, the market is divided into Non-Sterile Gels and Sterile Gels. In terms of End User, the market is classified into Hospitals, Clinics, Diagnostic Centres, and Ambulatory Surgical Centres. Regionally, the market is classified into North America, Latin America, Western Europe, Eastern Europe, Balkan & Baltic Countries, Russia & Belarus, Central Asia, East Asia, South Asia & Pacific, and the Middle East & Africa.

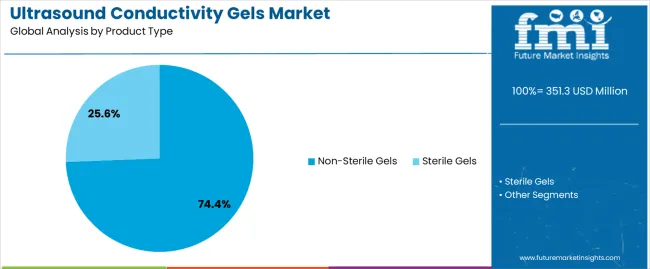
The non-sterile gels segment is projected to hold 74.40% of the Ultrasound Conductivity Gels market revenue share in 2025, making it the leading product type. This segment has been driven by the wide applicability of non-sterile gels in general diagnostic procedures where sterility is not a critical requirement. Non-sterile gels offer cost-effectiveness, ease of use, and reliable conductivity for high-quality ultrasound imaging, making them a preferred choice for many healthcare providers.
The segment benefits from strong compatibility with various ultrasound devices and their ability to maintain consistent acoustic coupling during procedures. The growing number of outpatient diagnostic centers and hospitals with high patient throughput has further increased the adoption of non-sterile gels.
Additionally, the operational efficiency provided by ready-to-use formulations supports large-volume usage in clinical settings Continuous demand for affordable yet effective diagnostic gels, coupled with the expansion of healthcare facilities, reinforces the dominance of the non-sterile gels segment in the market.

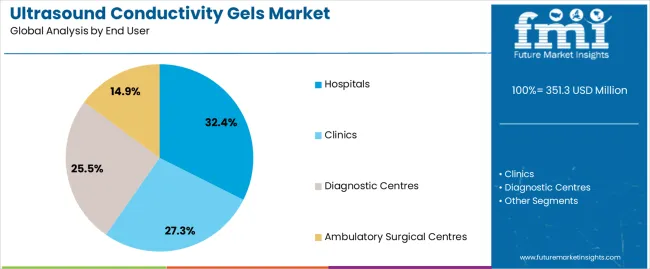
The hospitals segment is expected to account for 32.40% of the Ultrasound Conductivity Gels market revenue in 2025, establishing it as the leading end-use industry. This growth is driven by the high volume of diagnostic imaging procedures conducted in hospital settings, which require reliable and consistent ultrasound gels to ensure accuracy and efficiency. Hospitals increasingly prioritize high-quality imaging materials to enhance patient outcomes and streamline clinical workflows.
The segment benefits from the integration of advanced ultrasound technologies and rising patient demand for diagnostic services. Additionally, hospitals often serve as central hubs for outpatient and inpatient diagnostic services, creating sustained and predictable consumption of conductivity gels.
Investment in modern diagnostic infrastructure, coupled with emphasis on operational efficiency and patient safety, has accelerated the adoption of ultrasound gels in hospital environments The growing number of healthcare facilities and expanding imaging services globally continue to reinforce hospitals as the dominant end-use segment for ultrasound conductivity gels.
The below table presents the expected CAGR for the global Ultrasound conductivity gels market over several semi-annual periods spanning from 2025 to 2035. In the first half (H1) of the decade from 2025 to 2035, the business is predicted to surge at a CAGR of 8.7%, followed by a slightly higher growth rate of 8.2% in the second half (H2) of the same decade.
| Particular | Value CAGR |
|---|---|
| H1 | 8.7% (2025 to 2035) |
| H2 | 8.2% (2025 to 2035) |
| H1 | 7.8% (2025 to 2035) |
| H2 | 7.5% (2025 to 2035) |
The above table presents the expected CAGR for the global ultrasound conductivity gels market over several semi-annual periods spanning from 2025 to 2035. In the first half (H1) of the decade from 2025 to 2035, the business is predicted to surge at a CAGR of 8.7%, followed by a slightly decline in growth rate of 8.2% in the second half (H2) of the same decade.
Moving into the subsequent period, from H1 2025 to H2 2035, the CAGR is projected to decrease slightly to 7.8% in the first half and increase moderately at 7.5% in the second half. In the first half (H1) the market witnessed a decrease of -90.00 BPS while in the second half (H2), the market witnessed a decrease of -70.00 BPS.
Advance Imaging Technologies in Early Disease Detection is Propelling the Demand for Ultrasound Conductivity Gels
Chronic diseases-cardiovascular disorders, cancers, diabetes, and respiratory conditions-continue to surge in the world. Most of these diseases present with repeated requirements for diagnostic imaging to monitor disease progression, check on the response to treatment, and track complications. In this regard, ultrasound imaging is safer, more cost-effective, and has broader applications in diagnosing various medical conditions in a wide range of patients.
Ultrasound gels rid interfaces of possible trapped air and optimize the contact of the transducer to the skin. This helps in proper and efficient ultrasound wave transmission, as a result enhancing the clarity of the image and its resolution, therefore allowing the healthcare professional to visualize more vividly anatomic structures and detect any possible abnormalities.
Hence, this clear image generation is noise-free and interference-free in a wide area of medical fields such as organ disorders in the abdomen and pelvis, diseases in the cardiovascular system, and musculoskeletal diseases. Ultrasound-conductive gels do achieve a higher signal-to-noise ratio, minimize artifacts, and help the penetration of ultrasound waves through tissues; that is, making sure good diagnostic imaging of high detail and quality.
With a rise in the adoption of diagnostic ultrasound imaging fueled by advancements in ultrasound technologies and ultrasound conductivity gels, huge market opportunities remain open.
Demographic growth and an increase in the prevalence of different diseases have boosted the demand for diagnostic imaging procedures, which has driven the ultrasound conductivity gels market. Obviously, these gels enhance acoustic coupling, ensure maximum quality of imaging, and provide comfort to patients undergoing any ultrasound examination.
Ultrasound conductivity gels serve critical functions in medical settings, enhancing the effectiveness and safety of ultrasound procedures
Ultrasound gels improve acoustic coupling between an ultrasound transducer and the skin surface of the patient. Due to this, there has been enough transmission of ultrasound waves with reduced reflections and refractions at the interface, giving sharper images and high resolution for diagnosis.
They are mainly used for diagnostic ultrasound processes in the non-invasive visualization of internal organs, tissues, and structures. It is applied in many fields of medicine, among them obstetrics, cardiology, urology, and musculoskeletal imaging, just to mention some, where proper diagnosis for the patient and planning of the course of treatment require these.
Principally, it is due to the non-invasive diagnostic and therapeutic procedures that have come more cephalad in preference by people, dictated by comfort, safety concerns, and technological evolution. In contrast, ultrasound modality continues irreplaceable due to its real-time imaging capabilities and versatility across medical specialties, thereby raising demand for ultrasound conductivity gels.
These ultrasound conductivity gels are essential for the delivery of ultrasound technology in diagnostic imaging and treatment applications. Increasingly, a market demand for such gels is created as the demand for non-invasive medical procedures rises.
The rise in Point-of-Care Ultrasound (POCUS) is poised to significantly fuel the prospects of the market
Point-of-care ultrasound presents a paradigm shift in medical imaging, providing fast diagnostic insight at bedside itself and enhancing clinical decision making, patient management, and healthcare efficiency. With the ever-growing demand for point-of-care ultrasound, demand directly related to it has been higher for ultrasound gels optimized for POCUS applications.
The extensive diffusion of POCUS across medical specialties-from emergency and critical care to obstetric and musculoskeletal imaging-is underpinned by a raft of compelling advantages. Conventional ultrasound devices generally require the transportation of a patient to some dedicated imaging facility. In contrast, POCUS devices are available as portable, handheld, user-friendly apparatuses that assist the examination in real time at the point of care and facilitate immediate treatment decisions to better the outcome of a given patient.
In adopting the working principles of POCUS, appropriate ultrasound conductivity gels ensure perfect acoustic coupling between the ultrasound transducer and the skin of an individual. Gels facilitate the transmission of ultrasound waves by closing air gaps and enhancing acoustic impedance matching, thus improving the quality of images and diagnostic reliability.
The struggle between the key market players in medical device companies and specialty gel manufacturers can help formulate innovative ultrasound gels. Strategic collaboration and partnership make it possible to formulate next-generation gels that can enhance imaging performance, thus increasing market opportunities by improving usability and comfort to the patient.
Regulatory compliance is a critical consideration for manufacturers in the Ultrasound Conductivity Gels Market.
Medical devices, including ultrasound conductivity gels, are regulated quite differently across regions. There are the FDA-the Food and Drug Administration-in the United States, CE marking within the European Union, and local competent authorities elsewhere in the world. To that end, the application of every jurisdiction shall be peculiar to its requirement for product classification, quality management system, labeling, clinical data, and post-market surveillance.
Most conductivity gels used with ultrasound will be either a Class I or Class II medical device, depending on the intended use and risk profile. The class I devices generally represent low-risk applications, while class II represents those with moderate risks and are, therefore, placed under more stringent regulatory controls. Companies should ensure that an appropriate risk assessment has been conducted and that standards are followed regarding a QMS to be implemented during the manufacturing process, the quality management system ISO 13485, and biocompatibility testing under ISO 10993.
Biocompatibility testing thus becomes an absolute requirement in the development of ultrasound conductivity gels, as these products are in direct contact with patients' skin during ultrasound examinations. Manufacturers should, therefore, accomplish thorough biocompatibility testing to determine the risks related to skin irritation, sensitization, and systemic toxicity. Testing protocols for cytotoxicity, skin sensitization, and irritation testing shall be included to cover all aspects of regulatory compliance and issues related to patients' safety.
In this respect, control and vigilance are components of the post-marketing surveillance that help extend the tenets of regulatory compliance beyond the initial product approval. This shall include monitoring the performance and safety of products once they hit the market, adverse event reporting, field safety corrective actions, and continuous quality improvement measures through feedback and data analysis.
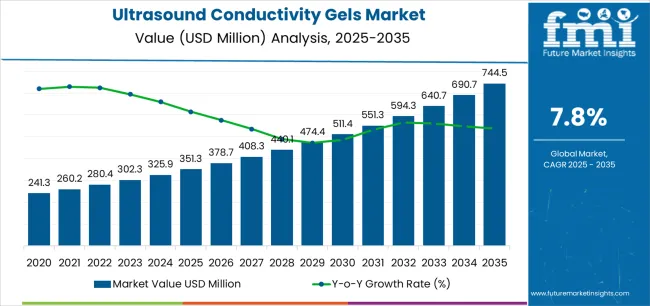
The global ultrasound conductivity gels industry recorded a CAGR of 6.3% during the historical period between 2020 and 2025. The growth of ultrasound conductivity gels industry was positive as it reached a value of USD 351.3 million in 2025 from USD 241.3 billion in 2020.
There have been contineous innovations in ultrasound imaging systems, with higher resolution transducers, 3-D/4-D imaging capabilities, and portable devices, continuously raising demand for advanced ultrasound conductivity gels. These are prime components for delivering optimal acoustic coupling between the ultrasound transducer and the skin of the patient so that better images are obtained for examination.
Some of the major factors driving the market, from the point of view of sales outlook, include the boosting healthcare expenditure, aging population, and increasing focus on early disease detection. Geographically, North America and Europe generated considerable demand due to advanced healthcare infrastructure. On the other hand, emerging markets such as Asia-Pacific and Latin America have boosted the market growth as the access to healthcare improved and diagnostic services became pervasive.
In this background, across the globe, there is an increase in healthcare expenditure due to aging populations, increasing incidence of chronic diseases, and improvement in technology in healthcare delivery. It implies more investments in medical imaging equipment and associates consumables like ultrasound gels, better diagnostics facilities, and treatment of patients.
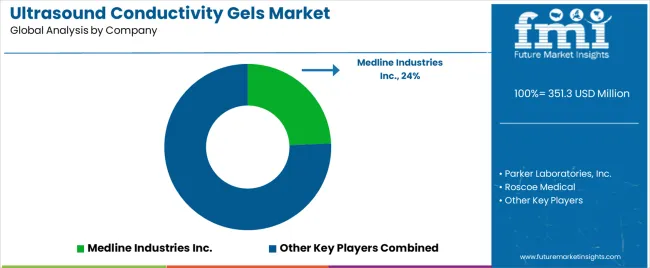
Tier 1 companies comprise market leaders with a market revenue of above USD 100 million capturing significant market share of 45.5% in global market. Companies focus on innovation in products, developing sophisticated formulations that ensure acoustic coupling happens in the best possible manner for the high imaging quality. Very often, innovation can embrace advanced ultrasound technologies, and improved usability featuring performance enhancements.
This would also include collaboration with healthcare institutions, research organizations, and technology providers at a very high level. Partnerships at this level drive innovation in products, expansion in markets, and access to new technologies or market segments, thus improving competitive advantage in that industry. Prominent companies within tier 1 include Medline Industries Inc., Parker Laboratories, Inc., Roscoe Medical and Cardinal Health, Inc.
Tier 2 companies include mid-size players with revenue of USD 50 to 100 million having presence in specific regions and highly influencing the local market and holds around 26.7% market share. These are characterized by a strong presence overseas and strong market knowledge. These market players have good technology and ensure regulatory compliance but may not have advanced technology and wide global reach. Prominent companies in tier 2 include ECO-MED Diagnostic Imaging, National Therapy Products Inc., National Therapy Products Inc.
Finally, Tier 3 companies, such as DJO Global, Inc., Pharmaceutical Innovation Inc. and Ceracarta Spa, while smaller, are essential for the market. They specialize in specific products and cater to niche markets, adding diversity to the industry.
Overall, while Tier 1 companies are the primary drivers of the market, Tier 2 and 3 companies also make significant contributions, ensuring the ultrasound conductivity gels sales remains dynamic and competitive.
The section below covers the industry analysis for the ultrasound conductivity gels market for different countries. Market demand analysis on key countries in several regions of the globe, including North America, Asia Pacific, Europe, and others, is provided. The United States is anticipated to remain at the forefront in North America, with higher market share through 2035. In Asia Pacific, India is projected to witness a CAGR of 8.4% by 2035.
| Countries | Value CAGR (2025 to 2035) |
|---|---|
| USA | 8.0% |
| Germany | 9.7% |
| China | 8.5% |
| France | 7.7% |
| India | 8.4% |
| Spain | 6.7% |
| Australia | 8.1% |
| South Korea | 7.9% |
USA ultrasound conductivity gels market is poised to exhibit a CAGR of 8.0% between 2025 and 2035. Currently, it holds the highest share in the North American market, and the trend is expected to continue during the forecast period.
The country with the largest market share in the ultrasound conductivity gels market is the United States due to advanced and well-maintained healthcare infrastructure that exists within, its viability for innovative medical technologies, and high investment in research and development. Other reasons underpinning the domination include leading manufacturers and a heightened incidence of various chronic diseases whose diagnosis was tied to diagnostic imaging directly.
Besides, stringent regulatory frameworks and policies for its favorable reimbursement foster market growth and ensure the availability and access of high-quality ultrasound conductivity gels to medical professionals and patients spread across the country.
Germany has an established medical device industry with major companies that specialize in ultrasound equipment and accessories. These players add to this market through the development of high-performance, effective conductive gels, which come with very high standards of quality and performance.
The rigid regulatory standards in Germany for medical devices and consumables ensure that ultrasound conductive gels meet the strict standards of safety and efficacy. This is a very conducive regulatory environment that instills confidence in the quality of products available in the German market.
Due to advanced research & development strategies there is peak growth medical imaging and correspondingly specialized ultrasound conductive gels. Such centers would, in turn, work in conjunction with industry leaders to tweak and improve gel formulations.
India’s ultrasound conductivity gels market is poised to exhibit a CAGR of 8.4% between 2025 and 2035. Currently, it holds the highest share in the Asia Pacific market, and the trend is expected to continue during the forecast period.
With the increasing number of diagnostic imaging devices, including ultrasound gels in this country, rapid development of healthcare infrastructure, high investment in medical technology, and doubled rising incidences of some of the chronic diseases, among them cardiovascular disorders, liver disease, as well as cancer, have hence increased frequency in diagnostic imaging thus driving the market.
Furthermore, with the advent of advanced ultrasound devices and the emerging new technologies making the diagnostic process much simpler, it is only leading to demand for much better quality conductive gels. A burgeoning middle-class population with increased disposable income, a rise in healthcare spending, and product innovation with more immediate delivery options are cementing the ultrasound gels market in India.
The section contains information about the leading segments in the industry. By product type, the non-sterile gels segment holds the highest market share of 74.4% in 2025.
| By Product Type | Non-Sterile Gels |
|---|---|
| Value Share (2025) | 74.4% |
Non-sterile ultrasound gels are used in most conductivity applications because they are relatively inexpensive and support everyday diagnostic techniques. This is good enough for external ultrasound applications where there's little risk of infection, such as abdominal, obstetric, and musculoskeletal imaging. Non-sterilized gels conduct the ultrasound wave due to the reduction of air gaps and by maintaining the incident signal, which is very important for cleaner and clearer ultrasound imaging. They are widely applied in many clinical conditions for everyday diagnostic processes when sterility can be excluded.
They are easy to apply and remove, and their formulation is optimized to prevent the formation of air bubbles, which may interfere with ultrasound transmission. Since they are of broad availability and practical utility, the nonsterile gels are preferred by many for most standard procedures in ultrasound, and thus their applications are large-scale in the market.
| End User | Hospitals |
|---|---|
| Value Share (2035) | 32.4% |
Diagnostic imaging procedures are done in many hospitals, which include a long list of ultrasound exams, like abdomen, obstetric, cardiac, and vascular imaging. With the many different and complex cases handled by any hospital, the frequency of the usage of ultrasound technology raises significant demand for ultrasound conductivity gels.
Hospitals use ultrasound gels across various departments, including radiology, obstetrics, cardiology, and emergency medicine. This broad usage across multiple departments increases the overall demand for these gels.
Hospitals generally have bigger budgets for the procurement of medical supplies, including quality ultrasound gels, than smaller clinics and outpatient centers. Integration in hospitals from departments like radiology, cardiology, and emergency medicine guarantees a constant and strong demand for ultrasound conductivity gels. This wide use through the different departments cements the leading status of hospitals in the ultrasound conductivity gels market.

The market players are using strategies to stay competitive, such as product differentiation through innovative formulations, strategic partnerships with healthcare providers for distribution. Another key strategic focus of these companies is to actively look for strategic partners to bolster their product portfolios and expand their global market presence.
Recent Industry Developments in Ultrasound Conductivity Gels Market
In terms of product type, the industry is divided into sterile gels and non-sterile gels.
In terms of end users, the industry is segregated into hospitals, clinics, diagnostic centres and ambulatory surgical centres.
Key countries of North America, Latin America, Western Europe, Eastern, South Asia, East Asia and Middle East and Africa (MEA) have been covered in the report.
The global ultrasound conductivity gels market is estimated to be valued at USD 351.3 million in 2025.
The market size for the ultrasound conductivity gels market is projected to reach USD 744.5 million by 2035.
The ultrasound conductivity gels market is expected to grow at a 7.8% CAGR between 2025 and 2035.
The key product types in ultrasound conductivity gels market are non-sterile gels and sterile gels.
In terms of end user, hospitals segment to command 32.4% share in the ultrasound conductivity gels market in 2025.


Full Research Suite comprises of:
Market outlook & trends analysis
Interviews & case studies
Strategic recommendations
Vendor profiles & capabilities analysis
5-year forecasts
8 regions and 60+ country-level data splits
Market segment data splits
12 months of continuous data updates
DELIVERED AS:
PDF EXCEL ONLINE
Ultrasound Market Size and Share Forecast Outlook 2025 to 2035
Ultrasound Skin Tightening Devices Market Size and Share Forecast Outlook 2025 to 2035
Ultrasound Biometry Devices Market Size and Share Forecast Outlook 2025 to 2035
Ultrasound Devices Market Size and Share Forecast Outlook 2025 to 2035
Ultrasound-Guided Breast Biopsy Market Size and Share Forecast Outlook 2025 to 2035
Ultrasound Systems Market Growth – Trends & Forecast 2025-2035
Ultrasound Imaging Solution Market
Teleultrasound Systems Market
Food Ultrasound Market Analysis – Applications & Innovations 2025 to 2035
Micro-Ultrasound Systems Market
Cardiac Ultrasound Systems Market - Trends & Forecast 2025 to 2035
Focused Ultrasound System Market Trends and Forecast 2025 to 2035
Handheld Ultrasound Scanner Market Size and Share Forecast Outlook 2025 to 2035
Portable Ultrasound Bladder Scanner Market Analysis - Size, Share, and Forecast Outlook 2025 to 2035
Wireless Ultrasound Scanner Market
Autonomous Ultrasound Guidance Market Analysis - Size, Share, and Forecast Outlook 2025 to 2035
Endoscopic Ultrasound Needles Market Size and Share Forecast Outlook 2025 to 2035
Veterinary Ultrasound Scanner Market Growth - Trends & Forecast 2025 to 2035
Anesthesia Ultrasound Systems Market Analysis – Trends & Forecast 2025 to 2035
Preclinical Ultrasound Systems Market Size and Share Forecast Outlook 2025 to 2035

Thank you!
You will receive an email from our Business Development Manager. Please be sure to check your SPAM/JUNK folder too.
Chat With
MaRIA