Reports

- Global Locations -

Headquarters

Future Market Insights, Inc.

Christiana Corporate, 200
Continental Drive, Suite 401,
Newark, Delaware - 19713,
United States

T: +1-845-579-5705

Americas

Future Market Insights, Inc.

616 Corporate Way, Suite 2-9018,
Valley Cottage, NY 10989, United States

T: +1-347-918-3531

MEA

Future Market Insights

1602-6 Jumeirah Bay X2 Tower, Plot No: JLT-PH2-X2A,
Jumeirah Lakes Towers, Dubai,
United Arab Emirates

Europe

Future Market Insights

3rd Floor, 207 Regent Street,
W1B 3HH London
United Kingdom

T: + 44 (0) 20 8123 9659
D: +44 (0) 20 3287 4268

Asia Pacific

Future Market Insights

IndiaLand Global Tech Park, Unit UG-1, Behind Grand HighStreet, Phase 1, Hinjawadi, MH, Pune – 411057, India

Sound Level Meter Market Snapshot (2022-2032)

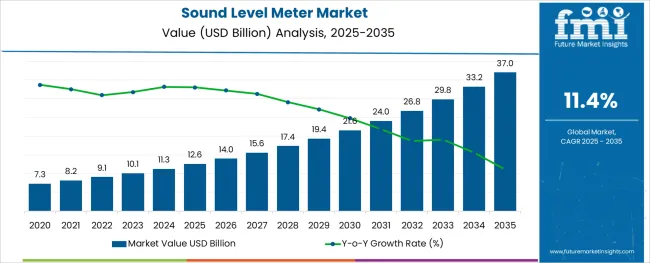
[250 Pages Report] The global sound level meter market size is anticipated to exhibit growth at a CAGR of 11.4% in the forecast period from 2022 to 2032. Increasing need to control auditory and non-auditory effects of noise pollution in both developed and developing countries is set to drive growth.

As per FMI, sales of sound level meters are expected to reach US$ 9.1 Bn in 2022 and be valued at US$ 16.3 Bn in 2032. Surging investments by regulatory bodies in new programs to maintain the quality of the environment are projected to augur well for the global market.

Report Attribute Details
Sound Level Meter Market Estimated Base Year Value (2021) US$ 8.7 Billion
Sound Level Meter Market Expected Market Value (2022) US$ 9.1 Billion
Sound Level Meter Market Anticipated Forecast Value (2032) US$ 16.3 Billion
Sound Level Meter Market Projected Growth Rate (2022-2032) 11.4% CAGR

Sound level meter is referred to as a unique measuring instrument that is extensively used to evaluate sound or noise levels by measuring the sound pressure. It has a microphone and is commonly a hand-held instrument.

Demand for sound level meters is anticipated to grow at an exponential rate in the forthcoming years on the back of increasing noise pollution levels in urban areas. Sound level meters are equipped with a directional microphone that needs the device to be pointed in the direction of the source of noise unless ambient noise levels are being examined.

Further, sound level meters are capable of responding to fluctuations in air pressure, which is mainly caused by sound waves. These are sometimes called Sound Pressure Level (SPL) meters.

The need for sound level meters is expected to grow among workplace safety and industrial hygiene professionals as they utilize these instruments to ensure environmental conditions come under the recommended exposure limits in various locations. Companies are nowadays permanently installing sound level meters at job or work sites for consistent monitoring of sound levels.

Don't pay for what you don't need

Customize your report by selecting specific countries or regions and save 30%!

Increasing Usage of Jet Planes and Automotive to Drive the Sound Level Meter Market

Increasing usage of sound level meters to monitor the acoustical performance of multiple structural elements of an office, a building, or air-conditioning and heat-ventilating systems in residential areas is expected to bolster the market. Governments of various countries are making the measurement of sound level a must to control the auditory and non-auditory effects of noise pollution in cities.

Moreover, ongoing development of new instruments by renowned companies featuring high precision is likely to accelerate the global sound level meter market growth in the upcoming decade. Surging usage of high-power speakers and woofers, as well as increasing number of jet planes and automotive is also projected to bode well for the global market.

Generation of Inaccurate Results with External Noises May Hinder the Sound Level Meter Market

Sound level meters are complex instruments that require skilled resources for conducting a thorough noise assessment. These are difficult to utilize in controlled environments, such as working at confined spaces and at heights.

Other sounds nearby, such as conversation with people, working operators, public announcement systems, and forklift rumbling can lead to the generation of inaccurate results. Apart from that, when sound meters are used in a particular area, there are chances of a minimum disruption in terms of operational activities. Driven by the aforementioned limitations, demand for sound level meters may decline in the assessment period.
Nikhil Kaitwade
Nikhil Kaitwade

Principal Consultant

Talk to Analyst

Find your sweet spots for generating winning opportunities in this market.

Government Initiatives to Lower Noise Pollution to Propel the North America Sound Level Meter Market

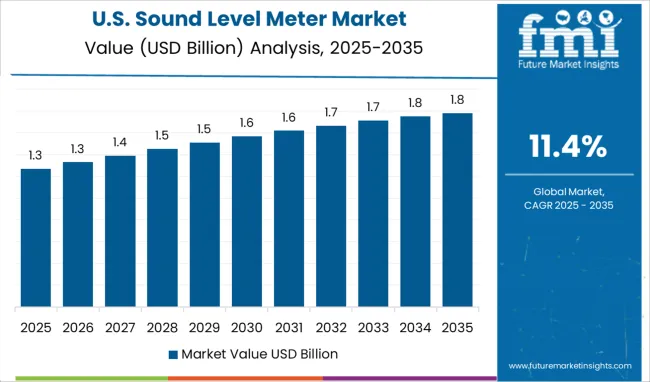
Presence of well-established power generation and aerospace & defense industries in the U.S. and Canada is anticipated to expand the North America sound level meter market share in the evaluation period. The U.S. government is also expected to take certain initiatives to continuously monitor sound levels at workplaces in the country.

In addition to that, sound level meters are gaining impetus in North America stoked by their ability to provide elaborate information about the source of noise. Rapid development of state-of-the-art instruments with features, such as LAeq & LCpeak results, noise map development, OHS claims management, and compliance with state OHS regulations is also estimated to propel the regional market.
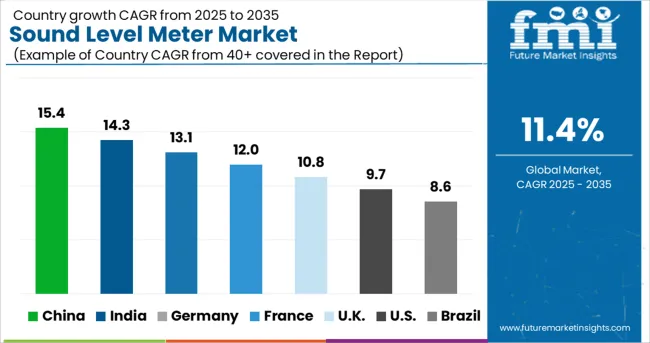
Growing Insurgency against Harmful Sound Devices to Push the Asia Pacific Sound Level Meter Market

Rising insurgency against non-eco-friendly sound devices backed by the negative influence of high decibel noise on the environment is expected to push the Asia Pacific sound level meter market size in the forecast period. As per a report published by the National Library of Medicine, during 2001-2011, growth of the urban population surged to 31.8% in India.

It further mentions that the Central Pollution Control Board put forward phase I of the Real Time National Ambient Noise Monitoring Network covering 35 areas in seven metro cities. It has included ambient noise under the environmental quality parameter. Nearly 160 areas spread over 25 cities will be established in phase II and phase III in 18 states. Thus, similar initiatives taken by the government are anticipated to positively impact the Asia Pacific market.
Get the data you need at a Fraction of the cost

Personalize your report by choosing insights you need
and save 40%!

Market Competition

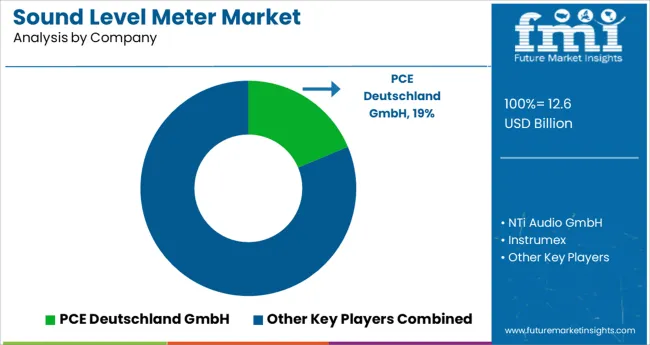
Some of the renowned companies present in the global sound level meter market include 3M, PCE Deutschland GmbH, HIOKI, NTi Audio GmbH, Testo, Instrumex, RION, Casella Inc., and SVANTEK among others.

The global market is highly fragmented with the presence of a large number of international and regional companies. The majority of the key players are increasingly focusing on mergers and acquisitions with start-up companies to broaden their product portfolios and distribution networks across the globe. Meanwhile, a few other key players are investing huge sums in research and development activities to come up with novel products for their customers.

Report Scope

Report Attribute Details
Growth Rate CAGR of 11.4% from 2022 to 2032
Base Year for Estimation 2021
Historical Data 2015-2020
Forecast Period 2022-2032
Quantitative Units Revenue in USD Million, Volume in Kilotons and CAGR from 2022-2032
Report Coverage Revenue Forecast, Volume Forecast, Company Ranking, Competitive Landscape, Growth Factors, Trends and Pricing Analysis
Segments Covered
  • Technology Type
  • End Use
  • Region
Regions Covered
  • North America
  • Latin America
  • Western Europe
  • Eastern Europe
  • APEJ
  • Japan
  • Middle East and Africa
Key Countries Profiled
  • USA
  • Canada
  • Brazil
  • Argentina
  • Germany
  • UK
  • France
  • Spain
  • Italy
  • Nordics
  • BENELUX
  • Australia & New Zealand
  • China
  • India
  • ASEAN
  • GCC
  • South Africa
Key Companies Profiled
Customization Available Upon Request

Key Segments Profiled in the Sound Level Meter Industry Survey

Technology Type:

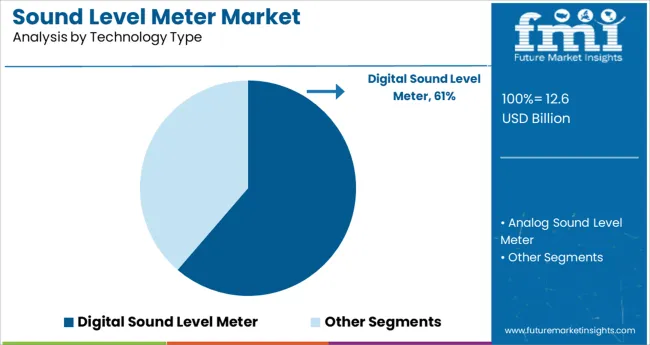
  • Analog Sound Level Meter
  • Digital Sound Level Meter

By End Use:

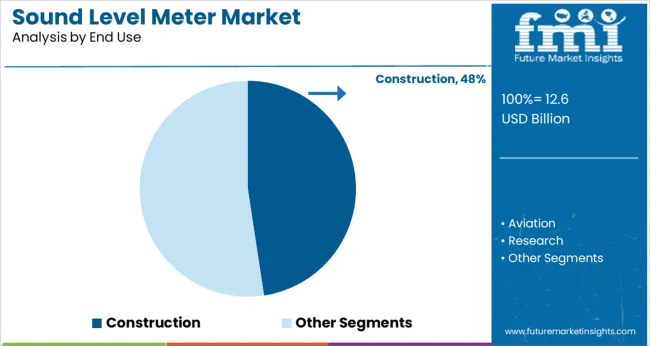
  • Construction
  • Aviation
  • Research
  • Defense
  • Others

By Region:

  • North America
  • Latin America
  • Western Europe
  • Eastern Europe
  • APEJ
  • Japan
  • Middle East and Africa

Frequently Asked Questions

What is the projected size of the global sound level meter market by 2032?

The global sound level meter market is set to exceed US$ 16.3 Bn in 2032.

Which region is set to lead the sound level meter market?

North America is set to lead the sound level meter market in the forecast period.

Which are some of the renowned companies in the sound level meter market?

3M, PCE Deutschland GmbH, HIOKI, NTi Audio GmbH, Testo, Instrumex, RION, Casella Inc., and SVANTEK are some of the renowned companies in the sound level meter market.

Table of Content

1. Executive Summary

    1.1. Global Market Outlook

    1.2. Demand-side Trends

    1.3. Supply-side Trends

    1.4. Technology Roadmap Analysis

    1.5. Analysis and Recommendations

2. Market Overview

    2.1. Market Coverage / Taxonomy

    2.2. Market Definition / Scope / Limitations

3. Market Background

    3.1. Market Dynamics

        3.1.1. Drivers

        3.1.2. Restraints

        3.1.3. Opportunity 

        3.1.4. Trends

    3.2. Scenario Forecast

        3.2.1. Demand in Optimistic Scenario

        3.2.2. Demand in Likely Scenario

        3.2.3. Demand in Conservative Scenario

    3.3. Opportunity Map Analysis

    3.4. Product Life Cycle Analysis

    3.5. Supply Chain Analysis

        3.5.1. Supply Side Participants and their Roles

            3.5.1.1. Producers

            3.5.1.2. Mid-Level Participants (Traders/ Agents/ Brokers)

            3.5.1.3. Wholesalers and Distributors

        3.5.2. Value Added and Value Created at Node in the Supply Chain

        3.5.3. List of Raw Material Suppliers

        3.5.4. List of Existing and Potential Buyer’s

    3.6. Investment Feasibility Matrix

    3.7. Value Chain Analysis

        3.7.1. Profit Margin Analysis

        3.7.2. Wholesalers and Distributors

        3.7.3. Retailers

    3.8. PESTLE and Porter’s Analysis

    3.9. Regulatory Landscape

        3.9.1. By Key Regions

        3.9.2. By Key Countries

    3.10. Regional Parent Market Outlook

    3.11. Production and Consumption Statistics

    3.12. Import and Export Statistics

4. Global Market Analysis 2017-2021 and Forecast, 2022-2032

    4.1. Historical Market Size Value (US$ Mn) & Volume (Units) Analysis, 2017-2021

    4.2. Current and Future Market Size Value (US$ Mn) & Volume (Units) Projections, 2022-2032

        4.2.1. Y-o-Y Growth Trend Analysis

        4.2.2. Absolute $ Opportunity Analysis

5. Global Market Analysis 2017-2021 and Forecast 2022-2032, By Technology Type

    5.1. Introduction / Key Findings

    5.2. Historical Market Size Value (US$ Mn) & Volume (Units) Analysis By Technology Type, 2017-2021

    5.3. Current and Future Market Size Value (US$ Mn) & Volume (Units) Analysis and Forecast By Technology Type, 2022-2032

        5.3.1. Analog Sound Level Meter

        5.3.2. Digital Sound Level Meter

    5.4. Y-o-Y Growth Trend Analysis By Technology Type, 2017-2021

    5.5. Absolute $ Opportunity Analysis By Technology Type, 2022-2032

6. Global Market Analysis 2017-2021 and Forecast 2022-2032, By End Use

    6.1. Introduction / Key Findings

    6.2. Historical Market Size Value (US$ Mn) & Volume (Units) Analysis By End Use, 2017-2021

    6.3. Current and Future Market Size Value (US$ Mn) & Volume (Units) Analysis and Forecast By End Use, 2022-2032

        6.3.1. Construction

        6.3.2. Aviation

        6.3.3. Research

        6.3.4. Defense

        6.3.5. Others

    6.4. Y-o-Y Growth Trend Analysis By End Use, 2017-2021

    6.5. Absolute $ Opportunity Analysis By End Use, 2022-2032

7. Global Market Analysis 2017-2021 and Forecast 2022-2032, By Region

    7.1. Introduction

    7.2. Historical Market Size Value (US$ Mn) & Volume (Units) Analysis By Region, 2017-2021

    7.3. Current Market Size Value (US$ Mn) & Volume (Units) Analysis and Forecast By Region, 2022-2032

        7.3.1. North America

        7.3.2. Latin America

        7.3.3. Europe

        7.3.4. Asia Pacific

        7.3.5. MEA

    7.4. Market Attractiveness Analysis By Region

8. North America Market Analysis 2017-2021 and Forecast 2022-2032, By Country

    8.1. Historical Market Size Value (US$ Mn) & Volume (Units) Trend Analysis By Market Taxonomy, 2017-2021

    8.2. Market Size Value (US$ Mn) & Volume (Units) Forecast By Market Taxonomy, 2022-2032

        8.2.1. By Country

            8.2.1.1. U.S.

            8.2.1.2. Canada

        8.2.2. By Technology Type

        8.2.3. By End Use

    8.3. Market Attractiveness Analysis

        8.3.1. By Country

        8.3.2. By Technology Type

        8.3.3. By End Use

    8.4. Key Takeaways

9. Latin America Market Analysis 2017-2021 and Forecast 2022-2032, By Country

    9.1. Historical Market Size Value (US$ Mn) & Volume (Units) Trend Analysis By Market Taxonomy, 2017-2021

    9.2. Market Size Value (US$ Mn) & Volume (Units) Forecast By Market Taxonomy, 2022-2032

        9.2.1. By Country

            9.2.1.1. Brazil

            9.2.1.2. Mexico

            9.2.1.3. Rest of Latin America

        9.2.2. By Technology Type

        9.2.3. By End Use

    9.3. Market Attractiveness Analysis

        9.3.1. By Country

        9.3.2. By Technology Type

        9.3.3. By End Use

    9.4. Key Takeaways

10. Europe Market Analysis 2017-2021 and Forecast 2022-2032, By Country

    10.1. Historical Market Size Value (US$ Mn) & Volume (Units) Trend Analysis By Market Taxonomy, 2017-2021

    10.2. Market Size Value (US$ Mn) & Volume (Units) Forecast By Market Taxonomy, 2022-2032

        10.2.1. By Country

            10.2.1.1. Germany

            10.2.1.2. U.K.

            10.2.1.3. France

            10.2.1.4. Spain

            10.2.1.5. Italy

            10.2.1.6. Rest of Europe

        10.2.2. By Technology Type

        10.2.3. By End Use

    10.3. Market Attractiveness Analysis

        10.3.1. By Country

        10.3.2. By Technology Type

        10.3.3. By End Use

    10.4. Key Takeaways

11. Asia Pacific Market Analysis 2017-2021 and Forecast 2022-2032, By Country

    11.1. Historical Market Size Value (US$ Mn) & Volume (Units) Trend Analysis By Market Taxonomy, 2017-2021

    11.2. Market Size Value (US$ Mn) & Volume (Units) Forecast By Market Taxonomy, 2022-2032

        11.2.1. By Country

            11.2.1.1. China

            11.2.1.2. Japan

            11.2.1.3. South Korea

            11.2.1.4. Malaysia

            11.2.1.5. Singapore

            11.2.1.6. Australia

            11.2.1.7. New Zealand

            11.2.1.8. Rest of APAC

        11.2.2. By Technology Type

        11.2.3. By End Use

    11.3. Market Attractiveness Analysis

        11.3.1. By Country

        11.3.2. By Technology Type

        11.3.3. By End Use

    11.4. Key Takeaways

12. MEA Market Analysis 2017-2021 and Forecast 2022-2032, By Country

    12.1. Historical Market Size Value (US$ Mn) & Volume (Units) Trend Analysis By Market Taxonomy, 2017-2021

    12.2. Market Size Value (US$ Mn) & Volume (Units) Forecast By Market Taxonomy, 2022-2032

        12.2.1. By Country

            12.2.1.1. GCC Countries

            12.2.1.2. South Africa

            12.2.1.3. Israel

            12.2.1.4. Rest of MEA

        12.2.2. By Technology Type

        12.2.3. By End Use

    12.3. Market Attractiveness Analysis

        12.3.1. By Country

        12.3.2. By Technology Type

        12.3.3. By End Use

    12.4. Key Takeaways

13. Key Countries Market Analysis

    13.1. U.S.

        13.1.1. Pricing Analysis

        13.1.2. Market Share Analysis, 2021

            13.1.2.1. By Technology Type

            13.1.2.2. By End Use

    13.2. Canada

        13.2.1. Pricing Analysis

        13.2.2. Market Share Analysis, 2021

            13.2.2.1. By Technology Type

            13.2.2.2. By End Use

    13.3. Brazil

        13.3.1. Pricing Analysis

        13.3.2. Market Share Analysis, 2021

            13.3.2.1. By Technology Type

            13.3.2.2. By End Use

    13.4. Mexico

        13.4.1. Pricing Analysis

        13.4.2. Market Share Analysis, 2021

            13.4.2.1. By Technology Type

            13.4.2.2. By End Use

    13.5. Germany

        13.5.1. Pricing Analysis

        13.5.2. Market Share Analysis, 2021

            13.5.2.1. By Technology Type

            13.5.2.2. By End Use

    13.6. U.K.

        13.6.1. Pricing Analysis

        13.6.2. Market Share Analysis, 2021

            13.6.2.1. By Technology Type

            13.6.2.2. By End Use

    13.7. France

        13.7.1. Pricing Analysis

        13.7.2. Market Share Analysis, 2021

            13.7.2.1. By Technology Type

            13.7.2.2. By End Use

    13.8. Spain

        13.8.1. Pricing Analysis

        13.8.2. Market Share Analysis, 2021

            13.8.2.1. By Technology Type

            13.8.2.2. By End Use

    13.9. Italy

        13.9.1. Pricing Analysis

        13.9.2. Market Share Analysis, 2021

            13.9.2.1. By Technology Type

            13.9.2.2. By End Use

    13.10. China

        13.10.1. Pricing Analysis

        13.10.2. Market Share Analysis, 2021

            13.10.2.1. By Technology Type

            13.10.2.2. By End Use

    13.11. Japan

        13.11.1. Pricing Analysis

        13.11.2. Market Share Analysis, 2021

            13.11.2.1. By Technology Type

            13.11.2.2. By End Use

    13.12. South Korea

        13.12.1. Pricing Analysis

        13.12.2. Market Share Analysis, 2021

            13.12.2.1. By Technology Type

            13.12.2.2. By End Use

    13.13. Malaysia

        13.13.1. Pricing Analysis

        13.13.2. Market Share Analysis, 2021

            13.13.2.1. By Technology Type

            13.13.2.2. By End Use

    13.14. Singapore

        13.14.1. Pricing Analysis

        13.14.2. Market Share Analysis, 2021

            13.14.2.1. By Technology Type

            13.14.2.2. By End Use

    13.15. Australia

        13.15.1. Pricing Analysis

        13.15.2. Market Share Analysis, 2021

            13.15.2.1. By Technology Type

            13.15.2.2. By End Use

    13.16. New Zealand

        13.16.1. Pricing Analysis

        13.16.2. Market Share Analysis, 2021

            13.16.2.1. By Technology Type

            13.16.2.2. By End Use

    13.17. GCC Countries

        13.17.1. Pricing Analysis

        13.17.2. Market Share Analysis, 2021

            13.17.2.1. By Technology Type

            13.17.2.2. By End Use

    13.18. South Africa

        13.18.1. Pricing Analysis

        13.18.2. Market Share Analysis, 2021

            13.18.2.1. By Technology Type

            13.18.2.2. By End Use

    13.19. Israel

        13.19.1. Pricing Analysis

        13.19.2. Market Share Analysis, 2021

            13.19.2.1. By Technology Type

            13.19.2.2. By End Use

14. Market Structure Analysis

    14.1. Competition Dashboard

    14.2. Competition Benchmarking

    14.3. Market Share Analysis of Top Players

        14.3.1. By Regional

        14.3.2. By Technology Type

        14.3.3. By End Use

15. Competition Analysis

    15.1. Competition Deep Dive

        15.1.1. PCE Deutschland GmbH

            15.1.1.1. Overview

            15.1.1.2. Product Portfolio

            15.1.1.3. Profitability by Market Segments

            15.1.1.4. Sales Footprint

            15.1.1.5. Strategy Overview

                15.1.1.5.1. Marketing Strategy

                15.1.1.5.2. Product Strategy

                15.1.1.5.3. Channel Strategy

        15.1.2. NTi Audio GmbH

            15.1.2.1. Overview

            15.1.2.2. Product Portfolio

            15.1.2.3. Profitability by Market Segments

            15.1.2.4. Sales Footprint

            15.1.2.5. Strategy Overview

                15.1.2.5.1. Marketing Strategy

                15.1.2.5.2. Product Strategy

                15.1.2.5.3. Channel Strategy

        15.1.3. Instrumex

            15.1.3.1. Overview

            15.1.3.2. Product Portfolio

            15.1.3.3. Profitability by Market Segments

            15.1.3.4. Sales Footprint

            15.1.3.5. Strategy Overview

                15.1.3.5.1. Marketing Strategy

                15.1.3.5.2. Product Strategy

                15.1.3.5.3. Channel Strategy

        15.1.4. Casella Inc.

            15.1.4.1. Overview

            15.1.4.2. Product Portfolio

            15.1.4.3. Profitability by Market Segments

            15.1.4.4. Sales Footprint

            15.1.4.5. Strategy Overview

                15.1.4.5.1. Marketing Strategy

                15.1.4.5.2. Product Strategy

                15.1.4.5.3. Channel Strategy

        15.1.5. 3M

            15.1.5.1. Overview

            15.1.5.2. Product Portfolio

            15.1.5.3. Profitability by Market Segments

            15.1.5.4. Sales Footprint

            15.1.5.5. Strategy Overview

                15.1.5.5.1. Marketing Strategy

                15.1.5.5.2. Product Strategy

                15.1.5.5.3. Channel Strategy

        15.1.6. SVANTEK

            15.1.6.1. Overview

            15.1.6.2. Product Portfolio

            15.1.6.3. Profitability by Market Segments

            15.1.6.4. Sales Footprint

            15.1.6.5. Strategy Overview

                15.1.6.5.1. Marketing Strategy

                15.1.6.5.2. Product Strategy

                15.1.6.5.3. Channel Strategy

        15.1.7. RION

            15.1.7.1. Overview

            15.1.7.2. Product Portfolio

            15.1.7.3. Profitability by Market Segments

            15.1.7.4. Sales Footprint

            15.1.7.5. Strategy Overview

                15.1.7.5.1. Marketing Strategy

                15.1.7.5.2. Product Strategy

                15.1.7.5.3. Channel Strategy

        15.1.8. Testo

            15.1.8.1. Overview

            15.1.8.2. Product Portfolio

            15.1.8.3. Profitability by Market Segments

            15.1.8.4. Sales Footprint

            15.1.8.5. Strategy Overview

                15.1.8.5.1. Marketing Strategy

                15.1.8.5.2. Product Strategy

                15.1.8.5.3. Channel Strategy

        15.1.9. HIOKI

            15.1.9.1. Overview

            15.1.9.2. Product Portfolio

            15.1.9.3. Profitability by Market Segments

            15.1.9.4. Sales Footprint

            15.1.9.5. Strategy Overview

                15.1.9.5.1. Marketing Strategy

                15.1.9.5.2. Product Strategy

                15.1.9.5.3. Channel Strategy

16. Assumptions & Acronyms Used

17. Research Methodology

Don't pay for what you don't need

Customize your report by selecting specific countries or regions and save 30%!

List of Tables

Table 1: Global Market Value (US$ Mn) Forecast by Region, 2017-2032

Table 2: Global Market Volume (Units) Forecast by Region, 2017-2032

Table 3: Global Market Value (US$ Mn) Forecast by Technology Type, 2017-2032

Table 4: Global Market Volume (Units) Forecast by Technology Type, 2017-2032

Table 5: Global Market Value (US$ Mn) Forecast by End Use, 2017-2032

Table 6: Global Market Volume (Units) Forecast by End Use, 2017-2032

Table 7: North America Market Value (US$ Mn) Forecast by Country, 2017-2032

Table 8: North America Market Volume (Units) Forecast by Country, 2017-2032

Table 9: North America Market Value (US$ Mn) Forecast by Technology Type, 2017-2032

Table 10: North America Market Volume (Units) Forecast by Technology Type, 2017-2032

Table 11: North America Market Value (US$ Mn) Forecast by End Use, 2017-2032

Table 12: North America Market Volume (Units) Forecast by End Use, 2017-2032

Table 13: Latin America Market Value (US$ Mn) Forecast by Country, 2017-2032

Table 14: Latin America Market Volume (Units) Forecast by Country, 2017-2032

Table 15: Latin America Market Value (US$ Mn) Forecast by Technology Type, 2017-2032

Table 16: Latin America Market Volume (Units) Forecast by Technology Type, 2017-2032

Table 17: Latin America Market Value (US$ Mn) Forecast by End Use, 2017-2032

Table 18: Latin America Market Volume (Units) Forecast by End Use, 2017-2032

Table 19: Europe Market Value (US$ Mn) Forecast by Country, 2017-2032

Table 20: Europe Market Volume (Units) Forecast by Country, 2017-2032

Table 21: Europe Market Value (US$ Mn) Forecast by Technology Type, 2017-2032

Table 22: Europe Market Volume (Units) Forecast by Technology Type, 2017-2032

Table 23: Europe Market Value (US$ Mn) Forecast by End Use, 2017-2032

Table 24: Europe Market Volume (Units) Forecast by End Use, 2017-2032

Table 25: Asia Pacific Market Value (US$ Mn) Forecast by Country, 2017-2032

Table 26: Asia Pacific Market Volume (Units) Forecast by Country, 2017-2032

Table 27: Asia Pacific Market Value (US$ Mn) Forecast by Technology Type, 2017-2032

Table 28: Asia Pacific Market Volume (Units) Forecast by Technology Type, 2017-2032

Table 29: Asia Pacific Market Value (US$ Mn) Forecast by End Use, 2017-2032

Table 30: Asia Pacific Market Volume (Units) Forecast by End Use, 2017-2032

Table 31: MEA Market Value (US$ Mn) Forecast by Country, 2017-2032

Table 32: MEA Market Volume (Units) Forecast by Country, 2017-2032

Table 33: MEA Market Value (US$ Mn) Forecast by Technology Type, 2017-2032

Table 34: MEA Market Volume (Units) Forecast by Technology Type, 2017-2032

Table 35: MEA Market Value (US$ Mn) Forecast by End Use, 2017-2032

Table 36: MEA Market Volume (Units) Forecast by End Use, 2017-2032
Nikhil Kaitwade
Nikhil Kaitwade

Principal Consultant

Talk to Analyst

Find your sweet spots for generating winning opportunities in this market.

List of Charts

Figure 1: Global Market Value (US$ Mn) by Technology Type, 2022-2032

Figure 2: Global Market Value (US$ Mn) by End Use, 2022-2032

Figure 3: Global Market Value (US$ Mn) by Region, 2022-2032

Figure 4: Global Market Value (US$ Mn) Analysis by Region, 2017-2032

Figure 5: Global Market Volume (Units) Analysis by Region, 2017-2032

Figure 6: Global Market Value Share (%) and BPS Analysis by Region, 2022-2032

Figure 7: Global Market Y-o-Y Growth (%) Projections by Region, 2022-2032

Figure 8: Global Market Value (US$ Mn) Analysis by Technology Type, 2017-2032

Figure 9: Global Market Volume (Units) Analysis by Technology Type, 2017-2032

Figure 10: Global Market Value Share (%) and BPS Analysis by Technology Type, 2022-2032

Figure 11: Global Market Y-o-Y Growth (%) Projections by Technology Type, 2022-2032

Figure 12: Global Market Value (US$ Mn) Analysis by End Use, 2017-2032

Figure 13: Global Market Volume (Units) Analysis by End Use, 2017-2032

Figure 14: Global Market Value Share (%) and BPS Analysis by End Use, 2022-2032

Figure 15: Global Market Y-o-Y Growth (%) Projections by End Use, 2022-2032

Figure 16: Global Market Attractiveness by Technology Type, 2022-2032

Figure 17: Global Market Attractiveness by End Use, 2022-2032

Figure 18: Global Market Attractiveness by Region, 2022-2032

Figure 19: North America Market Value (US$ Mn) by Technology Type, 2022-2032

Figure 20: North America Market Value (US$ Mn) by End Use, 2022-2032

Figure 21: North America Market Value (US$ Mn) by Country, 2022-2032

Figure 22: North America Market Value (US$ Mn) Analysis by Country, 2017-2032

Figure 23: North America Market Volume (Units) Analysis by Country, 2017-2032

Figure 24: North America Market Value Share (%) and BPS Analysis by Country, 2022-2032

Figure 25: North America Market Y-o-Y Growth (%) Projections by Country, 2022-2032

Figure 26: North America Market Value (US$ Mn) Analysis by Technology Type, 2017-2032

Figure 27: North America Market Volume (Units) Analysis by Technology Type, 2017-2032

Figure 28: North America Market Value Share (%) and BPS Analysis by Technology Type, 2022-2032

Figure 29: North America Market Y-o-Y Growth (%) Projections by Technology Type, 2022-2032

Figure 30: North America Market Value (US$ Mn) Analysis by End Use, 2017-2032

Figure 31: North America Market Volume (Units) Analysis by End Use, 2017-2032

Figure 32: North America Market Value Share (%) and BPS Analysis by End Use, 2022-2032

Figure 33: North America Market Y-o-Y Growth (%) Projections by End Use, 2022-2032

Figure 34: North America Market Attractiveness by Technology Type, 2022-2032

Figure 35: North America Market Attractiveness by End Use, 2022-2032

Figure 36: North America Market Attractiveness by Country, 2022-2032

Figure 37: Latin America Market Value (US$ Mn) by Technology Type, 2022-2032

Figure 38: Latin America Market Value (US$ Mn) by End Use, 2022-2032

Figure 39: Latin America Market Value (US$ Mn) by Country, 2022-2032

Figure 40: Latin America Market Value (US$ Mn) Analysis by Country, 2017-2032

Figure 41: Latin America Market Volume (Units) Analysis by Country, 2017-2032

Figure 42: Latin America Market Value Share (%) and BPS Analysis by Country, 2022-2032

Figure 43: Latin America Market Y-o-Y Growth (%) Projections by Country, 2022-2032

Figure 44: Latin America Market Value (US$ Mn) Analysis by Technology Type, 2017-2032

Figure 45: Latin America Market Volume (Units) Analysis by Technology Type, 2017-2032

Figure 46: Latin America Market Value Share (%) and BPS Analysis by Technology Type, 2022-2032

Figure 47: Latin America Market Y-o-Y Growth (%) Projections by Technology Type, 2022-2032

Figure 48: Latin America Market Value (US$ Mn) Analysis by End Use, 2017-2032

Figure 49: Latin America Market Volume (Units) Analysis by End Use, 2017-2032

Figure 50: Latin America Market Value Share (%) and BPS Analysis by End Use, 2022-2032

Figure 51: Latin America Market Y-o-Y Growth (%) Projections by End Use, 2022-2032

Figure 52: Latin America Market Attractiveness by Technology Type, 2022-2032

Figure 53: Latin America Market Attractiveness by End Use, 2022-2032

Figure 54: Latin America Market Attractiveness by Country, 2022-2032

Figure 55: Europe Market Value (US$ Mn) by Technology Type, 2022-2032

Figure 56: Europe Market Value (US$ Mn) by End Use, 2022-2032

Figure 57: Europe Market Value (US$ Mn) by Country, 2022-2032

Figure 58: Europe Market Value (US$ Mn) Analysis by Country, 2017-2032

Figure 59: Europe Market Volume (Units) Analysis by Country, 2017-2032

Figure 60: Europe Market Value Share (%) and BPS Analysis by Country, 2022-2032

Figure 61: Europe Market Y-o-Y Growth (%) Projections by Country, 2022-2032

Figure 62: Europe Market Value (US$ Mn) Analysis by Technology Type, 2017-2032

Figure 63: Europe Market Volume (Units) Analysis by Technology Type, 2017-2032

Figure 64: Europe Market Value Share (%) and BPS Analysis by Technology Type, 2022-2032

Figure 65: Europe Market Y-o-Y Growth (%) Projections by Technology Type, 2022-2032

Figure 66: Europe Market Value (US$ Mn) Analysis by End Use, 2017-2032

Figure 67: Europe Market Volume (Units) Analysis by End Use, 2017-2032

Figure 68: Europe Market Value Share (%) and BPS Analysis by End Use, 2022-2032

Figure 69: Europe Market Y-o-Y Growth (%) Projections by End Use, 2022-2032

Figure 70: Europe Market Attractiveness by Technology Type, 2022-2032

Figure 71: Europe Market Attractiveness by End Use, 2022-2032

Figure 72: Europe Market Attractiveness by Country, 2022-2032

Figure 73: Asia Pacific Market Value (US$ Mn) by Technology Type, 2022-2032

Figure 74: Asia Pacific Market Value (US$ Mn) by End Use, 2022-2032

Figure 75: Asia Pacific Market Value (US$ Mn) by Country, 2022-2032

Figure 76: Asia Pacific Market Value (US$ Mn) Analysis by Country, 2017-2032

Figure 77: Asia Pacific Market Volume (Units) Analysis by Country, 2017-2032

Figure 78: Asia Pacific Market Value Share (%) and BPS Analysis by Country, 2022-2032

Figure 79: Asia Pacific Market Y-o-Y Growth (%) Projections by Country, 2022-2032

Figure 80: Asia Pacific Market Value (US$ Mn) Analysis by Technology Type, 2017-2032

Figure 81: Asia Pacific Market Volume (Units) Analysis by Technology Type, 2017-2032

Figure 82: Asia Pacific Market Value Share (%) and BPS Analysis by Technology Type, 2022-2032

Figure 83: Asia Pacific Market Y-o-Y Growth (%) Projections by Technology Type, 2022-2032

Figure 84: Asia Pacific Market Value (US$ Mn) Analysis by End Use, 2017-2032

Figure 85: Asia Pacific Market Volume (Units) Analysis by End Use, 2017-2032

Figure 86: Asia Pacific Market Value Share (%) and BPS Analysis by End Use, 2022-2032

Figure 87: Asia Pacific Market Y-o-Y Growth (%) Projections by End Use, 2022-2032

Figure 88: Asia Pacific Market Attractiveness by Technology Type, 2022-2032

Figure 89: Asia Pacific Market Attractiveness by End Use, 2022-2032

Figure 90: Asia Pacific Market Attractiveness by Country, 2022-2032

Figure 91: MEA Market Value (US$ Mn) by Technology Type, 2022-2032

Figure 92: MEA Market Value (US$ Mn) by End Use, 2022-2032

Figure 93: MEA Market Value (US$ Mn) by Country, 2022-2032

Figure 94: MEA Market Value (US$ Mn) Analysis by Country, 2017-2032

Figure 95: MEA Market Volume (Units) Analysis by Country, 2017-2032

Figure 96: MEA Market Value Share (%) and BPS Analysis by Country, 2022-2032

Figure 97: MEA Market Y-o-Y Growth (%) Projections by Country, 2022-2032

Figure 98: MEA Market Value (US$ Mn) Analysis by Technology Type, 2017-2032

Figure 99: MEA Market Volume (Units) Analysis by Technology Type, 2017-2032

Figure 100: MEA Market Value Share (%) and BPS Analysis by Technology Type, 2022-2032

Figure 101: MEA Market Y-o-Y Growth (%) Projections by Technology Type, 2022-2032

Figure 102: MEA Market Value (US$ Mn) Analysis by End Use, 2017-2032

Figure 103: MEA Market Volume (Units) Analysis by End Use, 2017-2032

Figure 104: MEA Market Value Share (%) and BPS Analysis by End Use, 2022-2032

Figure 105: MEA Market Y-o-Y Growth (%) Projections by End Use, 2022-2032

Figure 106: MEA Market Attractiveness by Technology Type, 2022-2032

Figure 107: MEA Market Attractiveness by End Use, 2022-2032

Figure 108: MEA Market Attractiveness by Country, 2022-2032

Explore Testing Equipment Insights

View Reports