Ammeters Market
Market Insights on Ammeters covering sales outlook, demand forecast & up-to-date key trends
Ammeters Market by Measurement Type, Product Type, End Use & Region - Forecast 2022 – 2032
Ammeters Market Outlook (2022-2032)
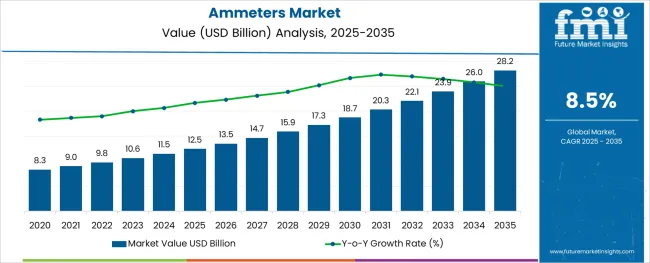
[342 Pages Report] The ammeters market is expected to continue its stronghold on global market as it thrives on a promising CAGR of 8.5%, while market is valued at US$ 9.76 Bn in 2022 and is projected to reach the market value of US$ 20.34 Bn through 2032.
The market is anticipated to show promising growth prospects during the forecast period, expanding the ammeters market size.
Attributes |
Details |
CAGR (2022-2032) |
8.5% |
Value (2022) |
US$ 9.76 Bn |
Value (2032) |
US$ 20.34 Bn |
Generally used in measuring the current in the circuit, ammeters analyze the readings of the flowing currents in the circuit. These measures the flow of current through the electric wiring that is also commonly used in manufacturing units that produce electrical devices that deal with proper functioning of electrical instruments, pushing the sales of ammeters in new market spaces.
Global study on ammeters market shows an upward trend in the market as developing countries build their infrastructure and consume a large number of electrical devices that further increases the demand for ammeters. Increasing safety compliance coupled with new advanced and upgraded digital ammeters with innovative features are driving the sales of ammeters.
Let us know your requirement to get
100% FREE customization
What are the Key Drivers and Restraints to the Ammeters Market?
Frequent use of ammeters in Construction and electrical industry favoring revenue growth of market, expanding the ammeters market size. Construction industry is one of the rapidly growing industries all across the globe. Installation of electrical wiring and instruments in newly constructed buildings is mandatory. Ammeters are used to measure the level of current in the electrical wirings of newly constructed buildings to ensure that the current is not too high or not too low. Electricians often use it to detect and correct the circuit faults in the building, adding new layers to the market and pushing the demand for ammeters globally.
Rapid adoption of advanced ammeters in the construction industry to maintain the safety of electrical wiring and instruments is driving the market significantly, increasing the sales of ammeters. Safety norms and regulations associated with the installation of electrical instruments are also affecting the demand for the ammeters considerably. Electrical instrument manufacturers are more focused on providing quality and reliable electrical instruments to the customers.
Manufacturers also frequently use ammeters to ensure the proper functioning of electrical devices before launching them onto the market. Changing the approach of the manufacturers towards providing quality electrical devices is boosting the ammeters market globally.
Which Region performs better in the Ammeters Market?
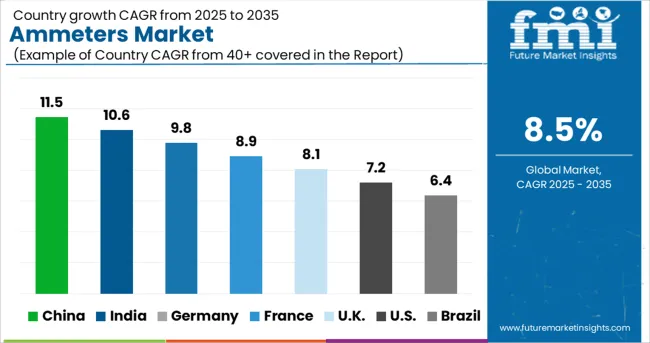
Technological advancement in electrical industry, especially in testing equipment domain in North America region is driving the ammeters market in terms of revenue. Growing Construction industry in this region is ultimately promoting the demand considerably. High adoption of these advanced devices in countries such as UK and Germany propel the growth in the demand for ammeters.
Enlarging automobile and construction industry in APEJ region is also contributing to the growth of ammeters market. Owing to increasing automobile manufacturing plants in the MEA region in recent years is one of the factors that accelerating the demand of ammeters in the market.
Find your sweet spots for generating winning opportunities in this market.
Talk to AnalystWhich are the Key Competitors of Ammeters Market?
The key players of the ammeters market focus on making the product more reliable for longer run, accurate and sensitive around the fluctuating voltages. Companies also focus on recreating their brand with new mergers and collaborations, fueling the sales of ammeters ultimately.
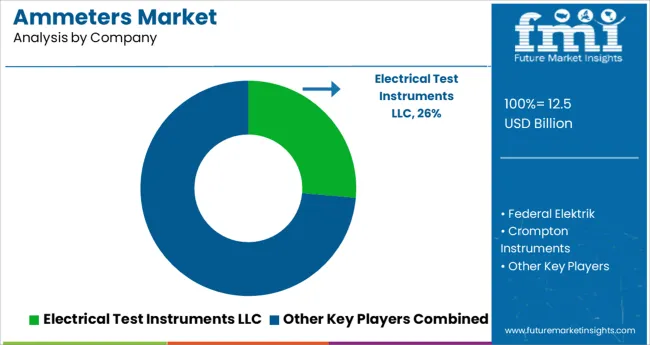
The major competitors are Electrical Test Instruments, LLC, Federal Elektrik, Crompton Instruments, HT Italia, Celsa Messgeräte GmbH, CIRCUTOR, and Autonics.
Recent Market Development
- Recently, Autonics, one of the electronic instrument manufacturers has launched ammeter with upgraded features in the market which includes 7 segments LED Display, auto zero function, selectable RMS/AVG value (AC current), and space size by DIN specification. This adds competitive value to the market and leads to high demand for ammeters globally.
- Federal Elektrik has introduced its technically upgraded version of FA72 Ammeter Direkt, that has a dimension of 72x72. This has made the the ammeters more reliable and dynamic to multiple applications, thriving the sales of ammeter in the global market.
- Crompton Instruments has launched its high-quality analogue ammeters that comes with electrical and electronic parameters, pushing the sales of ammeters globally.
Scope Of Report
Report Attribute |
Details |
Growth Rate |
CAGR of 8.5% from 2022 to 2032 |
Base year for estimation |
2021 |
Historical data |
2015 – 2021 |
Forecast period |
2022 – 2032 |
Quantitative units |
Revenue in USD Million and CAGR from 2022 to 2032 |
Report coverage |
Revenue forecast, volume forecast, company ranking, competitive landscape, growth factors, and trends, Pricing Analysis |
Segments covered |
Measurement Type, Product Type, Region, and End Use |
Regional scope |
North America; Western Europe, Eastern Europe, Middle East, Africa, ASEAN, South Asia, Rest of Asia, Australia and New Zealand |
Country scope |
U.S.; Canada; Mexico; Germany; U.K.; France; Italy; Spain; Russia; Belgium; Poland; Czech Republic; China; India; Japan; Australia; Brazil; Argentina; Colombia; Saudi Arabia; UAE; Iran; South Africa |
Key companies profiled |
Electrical Test Instruments, LLC, Federal Elektrik, Crompton Instruments, HT Italia, Celsa Messgeräte GmbH, CIRCUTOR, and Autonics. |
Customization scope |
Free report customization (equivalent to up to 8 analysts working days) with purchase. Addition or alteration to country, regional & segment scope. |
Pricing and purchase options |
Avail customized purchase options to meet your exact research needs. |

An unified Market Research Subscription Platform, built for today’s disparate research needs.
Frequently Asked Questions
The ammeters market is set to thrive at a CAGR of 8.5% through 2032.
North America holds the biggest revenue value in the ammeters market, attributed to its application in electrical circuits and devices to measure the current along with high consumption through construction and wiring projects. This leads to the high demand for Ammeters in developed countries like US and Canada.
Ammeters market size has expanded owing to their common use in a type of circuit along with electrical devices.
1. Executive Summary
1.1. Global Market Outlook
1.2. Demand-side Trends
1.3. Supply-side Trends
1.4. Technology Roadmap Analysis
1.5. Analysis and Recommendations
2. Market Overview
2.1. Market Coverage / Taxonomy
2.2. Market Definition / Scope / Limitations
3. Market Background
3.1. Market Dynamics
3.1.1. Drivers
3.1.2. Restraints
3.1.3. Opportunity
3.1.4. Trends
3.2. Scenario Forecast
3.2.1. Demand in Optimistic Scenario
3.2.2. Demand in Likely Scenario
3.2.3. Demand in Conservative Scenario
3.3. Opportunity Map Analysis
3.4. Product Life Cycle Analysis
3.5. Supply Chain Analysis
3.5.1. Supply Side Participants and their Roles
3.5.1.1. Producers
3.5.1.2. Mid-Level Participants (Traders/ Agents/ Brokers)
3.5.1.3. Wholesalers and Distributors
3.5.2. Value Added and Value Created at Node in the Supply Chain
3.5.3. List of Raw Material Suppliers
3.5.4. List of Existing and Potential Buyer’s
3.6. Investment Feasibility Matrix
3.7. Value Chain Analysis
3.7.1. Profit Margin Analysis
3.7.2. Wholesalers and Distributors
3.7.3. Retailers
3.8. PESTLE and Porter’s Analysis
3.9. Regulatory Landscape
3.9.1. By Key Regions
3.9.2. By Key Countries
3.10. Regional Parent Market Outlook
3.11. Production and Consumption Statistics
3.12. Import and Export Statistics
4. Global Ammeters Market Analysis 2017-2021 and Forecast, 2022-2032
4.1. Historical Market Size Value (US$ Mn) & Volume (Units) Analysis, 2017-2021
4.2. Current and Future Market Size Value (US$ Mn) & Volume (Units) Projections, 2022-2032
4.2.1. Y-o-Y Growth Trend Analysis
4.2.2. Absolute $ Opportunity Analysis
5. Global Ammeters Market Analysis 2017-2021 and Forecast 2022-2032, By Measurement Type
5.1. Introduction / Key Findings
5.2. Historical Market Size Value (US$ Mn) & Volume (Units) Analysis By Measurement Type, 2017-2021
5.3. Current and Future Market Size Value (US$ Mn) & Volume (Units) Analysis and Forecast By Measurement Type, 2022-2032
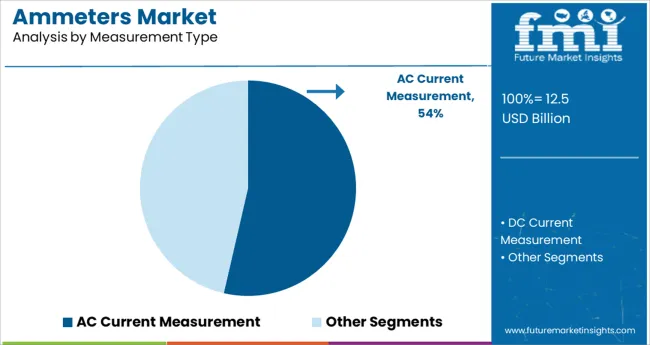
5.3.1. AC Current Measurement
5.3.2. DC Current Measurement
5.4. Y-o-Y Growth Trend Analysis By Measurement Type, 2017-2021
5.5. Absolute $ Opportunity Analysis By Measurement Type, 2022-2032
6. Global Ammeters Market Analysis 2017-2021 and Forecast 2022-2032, By Product Type
6.1. Introduction / Key Findings
6.2. Historical Market Size Value (US$ Mn) & Volume (Units) Analysis By Product Type, 2017-2021
6.3. Current and Future Market Size Value (US$ Mn) & Volume (Units) Analysis and Forecast By Product Type, 2022-2032
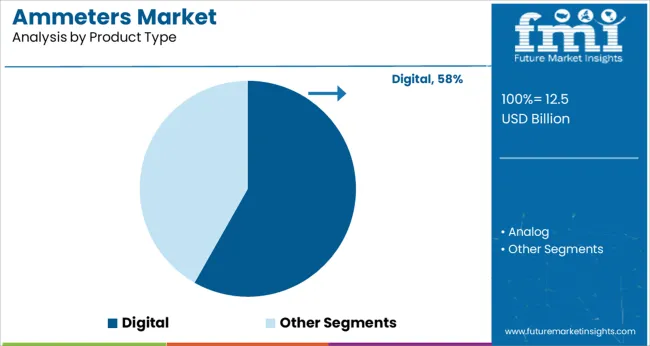
6.3.1. Analog
6.3.2. Digital
6.4. Y-o-Y Growth Trend Analysis By Product Type, 2017-2021
6.5. Absolute $ Opportunity Analysis By Product Type, 2022-2032
7. Global Ammeters Market Analysis 2017-2021 and Forecast 2022-2032, By End Use
7.1. Introduction / Key Findings
7.2. Historical Market Size Value (US$ Mn) & Volume (Units) Analysis By End Use, 2017-2021
7.3. Current and Future Market Size Value (US$ Mn) & Volume (Units) Analysis and Forecast By End Use, 2022-2032
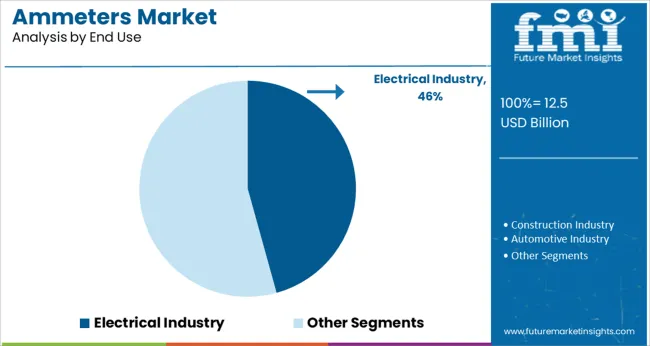
7.3.1. Electrical Industry
7.3.2. Construction Industry
7.3.3. Automotive Industry
7.3.4. Others
7.4. Y-o-Y Growth Trend Analysis By End Use, 2017-2021
7.5. Absolute $ Opportunity Analysis By End Use, 2022-2032
8. Global Ammeters Market Analysis 2017-2021 and Forecast 2022-2032, By Region
8.1. Introduction
8.2. Historical Market Size Value (US$ Mn) & Volume (Units) Analysis By Region, 2017-2021
8.3. Current Market Size Value (US$ Mn) & Volume (Units) Analysis and Forecast By Region, 2022-2032
8.3.1. North America
8.3.2. Latin America
8.3.3. Europe
8.3.4. Asia Pacific
8.3.5. Middle East and Africa
8.4. Market Attractiveness Analysis By Region
9. North America Ammeters Market Analysis 2017-2021 and Forecast 2022-2032, By Country
9.1. Historical Market Size Value (US$ Mn) & Volume (Units) Trend Analysis By Market Taxonomy, 2017-2021
9.2. Market Size Value (US$ Mn) & Volume (Units) Forecast By Market Taxonomy, 2022-2032
9.2.1. By Country
9.2.1.1. U.S.
9.2.1.2. Canada
9.2.2. By Measurement Type
9.2.3. By Product Type
9.2.4. By End Use
9.3. Market Attractiveness Analysis
9.3.1. By Country
9.3.2. By Measurement Type
9.3.3. By Product Type
9.3.4. By End Use
9.4. Key Takeaways
10. Latin America Ammeters Market Analysis 2017-2021 and Forecast 2022-2032, By Country
10.1. Historical Market Size Value (US$ Mn) & Volume (Units) Trend Analysis By Market Taxonomy, 2017-2021
10.2. Market Size Value (US$ Mn) & Volume (Units) Forecast By Market Taxonomy, 2022-2032
10.2.1. By Country
10.2.1.1. Brazil
10.2.1.2. Mexico
10.2.1.3. Argentina
10.2.1.4. Chile
10.2.1.5. Peru
10.2.1.6. Rest of Latin America
10.2.2. By Measurement Type
10.2.3. By Product Type
10.2.4. By End Use
10.3. Market Attractiveness Analysis
10.3.1. By Country
10.3.2. By Measurement Type
10.3.3. By Product Type
10.3.4. By End Use
10.4. Key Takeaways
11. Europe Ammeters Market Analysis 2017-2021 and Forecast 2022-2032, By Country
11.1. Historical Market Size Value (US$ Mn) & Volume (Units) Trend Analysis By Market Taxonomy, 2017-2021
11.2. Market Size Value (US$ Mn) & Volume (Units) Forecast By Market Taxonomy, 2022-2032
11.2.1. By Country
11.2.1.1. Germany
11.2.1.2. Italy
11.2.1.3. France
11.2.1.4. U.K.
11.2.1.5. Spain
11.2.1.6. Russia
11.2.1.7. BENELUX
11.2.1.8. Rest of Europe
11.2.2. By Measurement Type
11.2.3. By Product Type
11.2.4. By End Use
11.3. Market Attractiveness Analysis
11.3.1. By Country
11.3.2. By Measurement Type
11.3.3. By Product Type
11.3.4. By End Use
11.4. Key Takeaways
12. Asia Pacific Ammeters Market Analysis 2017-2021 and Forecast 2022-2032, By Country
12.1. Historical Market Size Value (US$ Mn) & Volume (Units) Trend Analysis By Market Taxonomy, 2017-2021
12.2. Market Size Value (US$ Mn) & Volume (Units) Forecast By Market Taxonomy, 2022-2032
12.2.1. By Country
12.2.1.1. China
12.2.1.2. Japan
12.2.1.3. South Korea
12.2.1.4. Rest of Asia Pacific
12.2.2. By Measurement Type
12.2.3. By Product Type
12.2.4. By End Use
12.3. Market Attractiveness Analysis
12.3.1. By Country
12.3.2. By Measurement Type
12.3.3. By Product Type
12.3.4. By End Use
12.4. Key Takeaways
13. Middle East and Africa Ammeters Market Analysis 2017-2021 and Forecast 2022-2032, By Country
13.1. Historical Market Size Value (US$ Mn) & Volume (Units) Trend Analysis By Market Taxonomy, 2017-2021
13.2. Market Size Value (US$ Mn) & Volume (Units) Forecast By Market Taxonomy, 2022-2032
13.2.1. By Country
13.2.1.1. GCC Countries
13.2.1.2. South Africa
13.2.1.3. Turkey
13.2.1.4. Rest of Middle East and Africa
13.2.2. By Measurement Type
13.2.3. By Product Type
13.2.4. By End Use
13.3. Market Attractiveness Analysis
13.3.1. By Country
13.3.2. By Measurement Type
13.3.3. By Product Type
13.3.4. By End Use
13.4. Key Takeaways
14. Key Countries Ammeters Market Analysis
14.1. U.S.
14.1.1. Pricing Analysis
14.1.2. Market Share Analysis, 2021
14.1.2.1. By Measurement Type
14.1.2.2. By Product Type
14.1.2.3. By End Use
14.2. Canada
14.2.1. Pricing Analysis
14.2.2. Market Share Analysis, 2021
14.2.2.1. By Measurement Type
14.2.2.2. By Product Type
14.2.2.3. By End Use
14.3. Brazil
14.3.1. Pricing Analysis
14.3.2. Market Share Analysis, 2021
14.3.2.1. By Measurement Type
14.3.2.2. By Product Type
14.3.2.3. By End Use
14.4. Mexico
14.4.1. Pricing Analysis
14.4.2. Market Share Analysis, 2021
14.4.2.1. By Measurement Type
14.4.2.2. By Product Type
14.4.2.3. By End Use
14.5. Argentina
14.5.1. Pricing Analysis
14.5.2. Market Share Analysis, 2021
14.5.2.1. By Measurement Type
14.5.2.2. By Product Type
14.5.2.3. By End Use
14.6. Chile
14.6.1. Pricing Analysis
14.6.2. Market Share Analysis, 2021
14.6.2.1. By Measurement Type
14.6.2.2. By Product Type
14.6.2.3. By End Use
14.7. Peru
14.7.1. Pricing Analysis
14.7.2. Market Share Analysis, 2021
14.7.2.1. By Measurement Type
14.7.2.2. By Product Type
14.7.2.3. By End Use
14.8. Germany
14.8.1. Pricing Analysis
14.8.2. Market Share Analysis, 2021
14.8.2.1. By Measurement Type
14.8.2.2. By Product Type
14.8.2.3. By End Use
14.9. Italy
14.9.1. Pricing Analysis
14.9.2. Market Share Analysis, 2021
14.9.2.1. By Measurement Type
14.9.2.2. By Product Type
14.9.2.3. By End Use
14.10. France
14.10.1. Pricing Analysis
14.10.2. Market Share Analysis, 2021
14.10.2.1. By Measurement Type
14.10.2.2. By Product Type
14.10.2.3. By End Use
14.11. U.K.
14.11.1. Pricing Analysis
14.11.2. Market Share Analysis, 2021
14.11.2.1. By Measurement Type
14.11.2.2. By Product Type
14.11.2.3. By End Use
14.12. Spain
14.12.1. Pricing Analysis
14.12.2. Market Share Analysis, 2021
14.12.2.1. By Measurement Type
14.12.2.2. By Product Type
14.12.2.3. By End Use
14.13. Russia
14.13.1. Pricing Analysis
14.13.2. Market Share Analysis, 2021
14.13.2.1. By Measurement Type
14.13.2.2. By Product Type
14.13.2.3. By End Use
14.14. BENELUX
14.14.1. Pricing Analysis
14.14.2. Market Share Analysis, 2021
14.14.2.1. By Measurement Type
14.14.2.2. By Product Type
14.14.2.3. By End Use
14.15. China
14.15.1. Pricing Analysis
14.15.2. Market Share Analysis, 2021
14.15.2.1. By Measurement Type
14.15.2.2. By Product Type
14.15.2.3. By End Use
14.16. Japan
14.16.1. Pricing Analysis
14.16.2. Market Share Analysis, 2021
14.16.2.1. By Measurement Type
14.16.2.2. By Product Type
14.16.2.3. By End Use
14.17. South Korea
14.17.1. Pricing Analysis
14.17.2. Market Share Analysis, 2021
14.17.2.1. By Measurement Type
14.17.2.2. By Product Type
14.17.2.3. By End Use
14.18. GCC Countries
14.18.1. Pricing Analysis
14.18.2. Market Share Analysis, 2021
14.18.2.1. By Measurement Type
14.18.2.2. By Product Type
14.18.2.3. By End Use
14.19. South Africa
14.19.1. Pricing Analysis
14.19.2. Market Share Analysis, 2021
14.19.2.1. By Measurement Type
14.19.2.2. By Product Type
14.19.2.3. By End Use
14.20. Turkey
14.20.1. Pricing Analysis
14.20.2. Market Share Analysis, 2021
14.20.2.1. By Measurement Type
14.20.2.2. By Product Type
14.20.2.3. By End Use
15. Market Structure Analysis
15.1. Competition Dashboard
15.2. Competition Benchmarking
15.3. Market Share Analysis of Top Players
15.3.1. By Regional
15.3.2. By Measurement Type
15.3.3. By Product Type
15.3.4. By End Use
16. Competition Analysis
16.1. Competition Deep Dive
16.1.1. Electrical Test Instruments LLC
16.1.1.1. Overview
16.1.1.2. Product Portfolio
16.1.1.3. Profitability by Market Segments
16.1.1.4. Sales Footprint
16.1.1.5. Strategy Overview
16.1.1.5.1. Marketing Strategy
16.1.1.5.2. Product Strategy
16.1.1.5.3. Channel Strategy
16.1.2. Federal Elektrik
16.1.2.1. Overview
16.1.2.2. Product Portfolio
16.1.2.3. Profitability by Market Segments
16.1.2.4. Sales Footprint
16.1.2.5. Strategy Overview
16.1.2.5.1. Marketing Strategy
16.1.2.5.2. Product Strategy
16.1.2.5.3. Channel Strategy
16.1.3. Crompton Instruments
16.1.3.1. Overview
16.1.3.2. Product Portfolio
16.1.3.3. Profitability by Market Segments
16.1.3.4. Sales Footprint
16.1.3.5. Strategy Overview
16.1.3.5.1. Marketing Strategy
16.1.3.5.2. Product Strategy
16.1.3.5.3. Channel Strategy
16.1.4. Celsa Messgeräte GmbH
16.1.4.1. Overview
16.1.4.2. Product Portfolio
16.1.4.3. Profitability by Market Segments
16.1.4.4. Sales Footprint
16.1.4.5. Strategy Overview
16.1.4.5.1. Marketing Strategy
16.1.4.5.2. Product Strategy
16.1.4.5.3. Channel Strategy
16.1.5. CIRCUTOR
16.1.5.1. Overview
16.1.5.2. Product Portfolio
16.1.5.3. Profitability by Market Segments
16.1.5.4. Sales Footprint
16.1.5.5. Strategy Overview
16.1.5.5.1. Marketing Strategy
16.1.5.5.2. Product Strategy
16.1.5.5.3. Channel Strategy
16.1.6. Autonics
16.1.6.1. Overview
16.1.6.2. Product Portfolio
16.1.6.3. Profitability by Market Segments
16.1.6.4. Sales Footprint
16.1.6.5. Strategy Overview
16.1.6.5.1. Marketing Strategy
16.1.6.5.2. Product Strategy
16.1.6.5.3. Channel Strategy
17. Assumptions & Acronyms Used
18. Research Methodology
Let us know your requirement to get
100% FREE customization
Table 1: Global Ammeters Market Value (US$ Mn) Forecast by Region, 2017-2032
Table 2: Global Ammeters Market Volume (Units) Forecast by Region, 2017-2032
Table 3: Global Ammeters Market Value (US$ Mn) Forecast by Measurement Type, 2017-2032
Table 4: Global Ammeters Market Volume (Units) Forecast by Measurement Type, 2017-2032
Table 5: Global Ammeters Market Value (US$ Mn) Forecast by Product Type, 2017-2032
Table 6: Global Ammeters Market Volume (Units) Forecast by Product Type, 2017-2032
Table 7: Global Ammeters Market Value (US$ Mn) Forecast by End Use, 2017-2032
Table 8: Global Ammeters Market Volume (Units) Forecast by End Use, 2017-2032
Table 9: North America Ammeters Market Value (US$ Mn) Forecast by Country, 2017-2032
Table 10: North America Ammeters Market Volume (Units) Forecast by Country, 2017-2032
Table 11: North America Ammeters Market Value (US$ Mn) Forecast by Measurement Type, 2017-2032
Table 12: North America Ammeters Market Volume (Units) Forecast by Measurement Type, 2017-2032
Table 13: North America Ammeters Market Value (US$ Mn) Forecast by Product Type, 2017-2032
Table 14: North America Ammeters Market Volume (Units) Forecast by Product Type, 2017-2032
Table 15: North America Ammeters Market Value (US$ Mn) Forecast by End Use, 2017-2032
Table 16: North America Ammeters Market Volume (Units) Forecast by End Use, 2017-2032
Table 17: Latin America Ammeters Market Value (US$ Mn) Forecast by Country, 2017-2032
Table 18: Latin America Ammeters Market Volume (Units) Forecast by Country, 2017-2032
Table 19: Latin America Ammeters Market Value (US$ Mn) Forecast by Measurement Type, 2017-2032
Table 20: Latin America Ammeters Market Volume (Units) Forecast by Measurement Type, 2017-2032
Table 21: Latin America Ammeters Market Value (US$ Mn) Forecast by Product Type, 2017-2032
Table 22: Latin America Ammeters Market Volume (Units) Forecast by Product Type, 2017-2032
Table 23: Latin America Ammeters Market Value (US$ Mn) Forecast by End Use, 2017-2032
Table 24: Latin America Ammeters Market Volume (Units) Forecast by End Use, 2017-2032
Table 25: Europe Ammeters Market Value (US$ Mn) Forecast by Country, 2017-2032
Table 26: Europe Ammeters Market Volume (Units) Forecast by Country, 2017-2032
Table 27: Europe Ammeters Market Value (US$ Mn) Forecast by Measurement Type, 2017-2032
Table 28: Europe Ammeters Market Volume (Units) Forecast by Measurement Type, 2017-2032
Table 29: Europe Ammeters Market Value (US$ Mn) Forecast by Product Type, 2017-2032
Table 30: Europe Ammeters Market Volume (Units) Forecast by Product Type, 2017-2032
Table 31: Europe Ammeters Market Value (US$ Mn) Forecast by End Use, 2017-2032
Table 32: Europe Ammeters Market Volume (Units) Forecast by End Use, 2017-2032
Table 33: Asia Pacific Ammeters Market Value (US$ Mn) Forecast by Country, 2017-2032
Table 34: Asia Pacific Ammeters Market Volume (Units) Forecast by Country, 2017-2032
Table 35: Asia Pacific Ammeters Market Value (US$ Mn) Forecast by Measurement Type, 2017-2032
Table 36: Asia Pacific Ammeters Market Volume (Units) Forecast by Measurement Type, 2017-2032
Table 37: Asia Pacific Ammeters Market Value (US$ Mn) Forecast by Product Type, 2017-2032
Table 38: Asia Pacific Ammeters Market Volume (Units) Forecast by Product Type, 2017-2032
Table 39: Asia Pacific Ammeters Market Value (US$ Mn) Forecast by End Use, 2017-2032
Table 40: Asia Pacific Ammeters Market Volume (Units) Forecast by End Use, 2017-2032
Table 41: Middle East and Africa Ammeters Market Value (US$ Mn) Forecast by Country, 2017-2032
Table 42: Middle East and Africa Ammeters Market Volume (Units) Forecast by Country, 2017-2032
Table 43: Middle East and Africa Ammeters Market Value (US$ Mn) Forecast by Measurement Type, 2017-2032
Table 44: Middle East and Africa Ammeters Market Volume (Units) Forecast by Measurement Type, 2017-2032
Table 45: Middle East and Africa Ammeters Market Value (US$ Mn) Forecast by Product Type, 2017-2032
Table 46: Middle East and Africa Ammeters Market Volume (Units) Forecast by Product Type, 2017-2032
Table 47: Middle East and Africa Ammeters Market Value (US$ Mn) Forecast by End Use, 2017-2032
Table 48: Middle East and Africa Ammeters Market Volume (Units) Forecast by End Use, 2017-2032
Find your sweet spots for generating winning opportunities in this market.
Talk to AnalystFigure 1: Global Ammeters Market Value (US$ Mn) by Measurement Type, 2022-2032
Figure 2: Global Ammeters Market Value (US$ Mn) by Product Type, 2022-2032
Figure 3: Global Ammeters Market Value (US$ Mn) by End Use, 2022-2032
Figure 4: Global Ammeters Market Value (US$ Mn) by Region, 2022-2032
Figure 5: Global Ammeters Market Value (US$ Mn) Analysis by Region, 2017-2032
Figure 6: Global Ammeters Market Volume (Units) Analysis by Region, 2017-2032
Figure 7: Global Ammeters Market Value Share (%) and BPS Analysis by Region, 2022-2032
Figure 8: Global Ammeters Market Y-o-Y Growth (%) Projections by Region, 2022-2032
Figure 9: Global Ammeters Market Value (US$ Mn) Analysis by Measurement Type, 2017-2032
Figure 10: Global Ammeters Market Volume (Units) Analysis by Measurement Type, 2017-2032
Figure 11: Global Ammeters Market Value Share (%) and BPS Analysis by Measurement Type, 2022-2032
Figure 12: Global Ammeters Market Y-o-Y Growth (%) Projections by Measurement Type, 2022-2032
Figure 13: Global Ammeters Market Value (US$ Mn) Analysis by Product Type, 2017-2032
Figure 14: Global Ammeters Market Volume (Units) Analysis by Product Type, 2017-2032
Figure 15: Global Ammeters Market Value Share (%) and BPS Analysis by Product Type, 2022-2032
Figure 16: Global Ammeters Market Y-o-Y Growth (%) Projections by Product Type, 2022-2032
Figure 17: Global Ammeters Market Value (US$ Mn) Analysis by End Use, 2017-2032
Figure 18: Global Ammeters Market Volume (Units) Analysis by End Use, 2017-2032
Figure 19: Global Ammeters Market Value Share (%) and BPS Analysis by End Use, 2022-2032
Figure 20: Global Ammeters Market Y-o-Y Growth (%) Projections by End Use, 2022-2032
Figure 21: Global Ammeters Market Attractiveness by Measurement Type, 2022-2032
Figure 22: Global Ammeters Market Attractiveness by Product Type, 2022-2032
Figure 23: Global Ammeters Market Attractiveness by End Use, 2022-2032
Figure 24: Global Ammeters Market Attractiveness by Region, 2022-2032
Figure 25: North America Ammeters Market Value (US$ Mn) by Measurement Type, 2022-2032
Figure 26: North America Ammeters Market Value (US$ Mn) by Product Type, 2022-2032
Figure 27: North America Ammeters Market Value (US$ Mn) by End Use, 2022-2032
Figure 28: North America Ammeters Market Value (US$ Mn) by Country, 2022-2032
Figure 29: North America Ammeters Market Value (US$ Mn) Analysis by Country, 2017-2032
Figure 30: North America Ammeters Market Volume (Units) Analysis by Country, 2017-2032
Figure 31: North America Ammeters Market Value Share (%) and BPS Analysis by Country, 2022-2032
Figure 32: North America Ammeters Market Y-o-Y Growth (%) Projections by Country, 2022-2032
Figure 33: North America Ammeters Market Value (US$ Mn) Analysis by Measurement Type, 2017-2032
Figure 34: North America Ammeters Market Volume (Units) Analysis by Measurement Type, 2017-2032
Figure 35: North America Ammeters Market Value Share (%) and BPS Analysis by Measurement Type, 2022-2032
Figure 36: North America Ammeters Market Y-o-Y Growth (%) Projections by Measurement Type, 2022-2032
Figure 37: North America Ammeters Market Value (US$ Mn) Analysis by Product Type, 2017-2032
Figure 38: North America Ammeters Market Volume (Units) Analysis by Product Type, 2017-2032
Figure 39: North America Ammeters Market Value Share (%) and BPS Analysis by Product Type, 2022-2032
Figure 40: North America Ammeters Market Y-o-Y Growth (%) Projections by Product Type, 2022-2032
Figure 41: North America Ammeters Market Value (US$ Mn) Analysis by End Use, 2017-2032
Figure 42: North America Ammeters Market Volume (Units) Analysis by End Use, 2017-2032
Figure 43: North America Ammeters Market Value Share (%) and BPS Analysis by End Use, 2022-2032
Figure 44: North America Ammeters Market Y-o-Y Growth (%) Projections by End Use, 2022-2032
Figure 45: North America Ammeters Market Attractiveness by Measurement Type, 2022-2032
Figure 46: North America Ammeters Market Attractiveness by Product Type, 2022-2032
Figure 47: North America Ammeters Market Attractiveness by End Use, 2022-2032
Figure 48: North America Ammeters Market Attractiveness by Country, 2022-2032
Figure 49: Latin America Ammeters Market Value (US$ Mn) by Measurement Type, 2022-2032
Figure 50: Latin America Ammeters Market Value (US$ Mn) by Product Type, 2022-2032
Figure 51: Latin America Ammeters Market Value (US$ Mn) by End Use, 2022-2032
Figure 52: Latin America Ammeters Market Value (US$ Mn) by Country, 2022-2032
Figure 53: Latin America Ammeters Market Value (US$ Mn) Analysis by Country, 2017-2032
Figure 54: Latin America Ammeters Market Volume (Units) Analysis by Country, 2017-2032
Figure 55: Latin America Ammeters Market Value Share (%) and BPS Analysis by Country, 2022-2032
Figure 56: Latin America Ammeters Market Y-o-Y Growth (%) Projections by Country, 2022-2032
Figure 57: Latin America Ammeters Market Value (US$ Mn) Analysis by Measurement Type, 2017-2032
Figure 58: Latin America Ammeters Market Volume (Units) Analysis by Measurement Type, 2017-2032
Figure 59: Latin America Ammeters Market Value Share (%) and BPS Analysis by Measurement Type, 2022-2032
Figure 60: Latin America Ammeters Market Y-o-Y Growth (%) Projections by Measurement Type, 2022-2032
Figure 61: Latin America Ammeters Market Value (US$ Mn) Analysis by Product Type, 2017-2032
Figure 62: Latin America Ammeters Market Volume (Units) Analysis by Product Type, 2017-2032
Figure 63: Latin America Ammeters Market Value Share (%) and BPS Analysis by Product Type, 2022-2032
Figure 64: Latin America Ammeters Market Y-o-Y Growth (%) Projections by Product Type, 2022-2032
Figure 65: Latin America Ammeters Market Value (US$ Mn) Analysis by End Use, 2017-2032
Figure 66: Latin America Ammeters Market Volume (Units) Analysis by End Use, 2017-2032
Figure 67: Latin America Ammeters Market Value Share (%) and BPS Analysis by End Use, 2022-2032
Figure 68: Latin America Ammeters Market Y-o-Y Growth (%) Projections by End Use, 2022-2032
Figure 69: Latin America Ammeters Market Attractiveness by Measurement Type, 2022-2032
Figure 70: Latin America Ammeters Market Attractiveness by Product Type, 2022-2032
Figure 71: Latin America Ammeters Market Attractiveness by End Use, 2022-2032
Figure 72: Latin America Ammeters Market Attractiveness by Country, 2022-2032
Figure 73: Europe Ammeters Market Value (US$ Mn) by Measurement Type, 2022-2032
Figure 74: Europe Ammeters Market Value (US$ Mn) by Product Type, 2022-2032
Figure 75: Europe Ammeters Market Value (US$ Mn) by End Use, 2022-2032
Figure 76: Europe Ammeters Market Value (US$ Mn) by Country, 2022-2032
Figure 77: Europe Ammeters Market Value (US$ Mn) Analysis by Country, 2017-2032
Figure 78: Europe Ammeters Market Volume (Units) Analysis by Country, 2017-2032
Figure 79: Europe Ammeters Market Value Share (%) and BPS Analysis by Country, 2022-2032
Figure 80: Europe Ammeters Market Y-o-Y Growth (%) Projections by Country, 2022-2032
Figure 81: Europe Ammeters Market Value (US$ Mn) Analysis by Measurement Type, 2017-2032
Figure 82: Europe Ammeters Market Volume (Units) Analysis by Measurement Type, 2017-2032
Figure 83: Europe Ammeters Market Value Share (%) and BPS Analysis by Measurement Type, 2022-2032
Figure 84: Europe Ammeters Market Y-o-Y Growth (%) Projections by Measurement Type, 2022-2032
Figure 85: Europe Ammeters Market Value (US$ Mn) Analysis by Product Type, 2017-2032
Figure 86: Europe Ammeters Market Volume (Units) Analysis by Product Type, 2017-2032
Figure 87: Europe Ammeters Market Value Share (%) and BPS Analysis by Product Type, 2022-2032
Figure 88: Europe Ammeters Market Y-o-Y Growth (%) Projections by Product Type, 2022-2032
Figure 89: Europe Ammeters Market Value (US$ Mn) Analysis by End Use, 2017-2032
Figure 90: Europe Ammeters Market Volume (Units) Analysis by End Use, 2017-2032
Figure 91: Europe Ammeters Market Value Share (%) and BPS Analysis by End Use, 2022-2032
Figure 92: Europe Ammeters Market Y-o-Y Growth (%) Projections by End Use, 2022-2032
Figure 93: Europe Ammeters Market Attractiveness by Measurement Type, 2022-2032
Figure 94: Europe Ammeters Market Attractiveness by Product Type, 2022-2032
Figure 95: Europe Ammeters Market Attractiveness by End Use, 2022-2032
Figure 96: Europe Ammeters Market Attractiveness by Country, 2022-2032
Figure 97: Asia Pacific Ammeters Market Value (US$ Mn) by Measurement Type, 2022-2032
Figure 98: Asia Pacific Ammeters Market Value (US$ Mn) by Product Type, 2022-2032
Figure 99: Asia Pacific Ammeters Market Value (US$ Mn) by End Use, 2022-2032
Figure 100: Asia Pacific Ammeters Market Value (US$ Mn) by Country, 2022-2032
Figure 101: Asia Pacific Ammeters Market Value (US$ Mn) Analysis by Country, 2017-2032
Figure 102: Asia Pacific Ammeters Market Volume (Units) Analysis by Country, 2017-2032
Figure 103: Asia Pacific Ammeters Market Value Share (%) and BPS Analysis by Country, 2022-2032
Figure 104: Asia Pacific Ammeters Market Y-o-Y Growth (%) Projections by Country, 2022-2032
Figure 105: Asia Pacific Ammeters Market Value (US$ Mn) Analysis by Measurement Type, 2017-2032
Figure 106: Asia Pacific Ammeters Market Volume (Units) Analysis by Measurement Type, 2017-2032
Figure 107: Asia Pacific Ammeters Market Value Share (%) and BPS Analysis by Measurement Type, 2022-2032
Figure 108: Asia Pacific Ammeters Market Y-o-Y Growth (%) Projections by Measurement Type, 2022-2032
Figure 109: Asia Pacific Ammeters Market Value (US$ Mn) Analysis by Product Type, 2017-2032
Figure 110: Asia Pacific Ammeters Market Volume (Units) Analysis by Product Type, 2017-2032
Figure 111: Asia Pacific Ammeters Market Value Share (%) and BPS Analysis by Product Type, 2022-2032
Figure 112: Asia Pacific Ammeters Market Y-o-Y Growth (%) Projections by Product Type, 2022-2032
Figure 113: Asia Pacific Ammeters Market Value (US$ Mn) Analysis by End Use, 2017-2032
Figure 114: Asia Pacific Ammeters Market Volume (Units) Analysis by End Use, 2017-2032
Figure 115: Asia Pacific Ammeters Market Value Share (%) and BPS Analysis by End Use, 2022-2032
Figure 116: Asia Pacific Ammeters Market Y-o-Y Growth (%) Projections by End Use, 2022-2032
Figure 117: Asia Pacific Ammeters Market Attractiveness by Measurement Type, 2022-2032
Figure 118: Asia Pacific Ammeters Market Attractiveness by Product Type, 2022-2032
Figure 119: Asia Pacific Ammeters Market Attractiveness by End Use, 2022-2032
Figure 120: Asia Pacific Ammeters Market Attractiveness by Country, 2022-2032
Figure 121: Middle East and Africa Ammeters Market Value (US$ Mn) by Measurement Type, 2022-2032
Figure 122: Middle East and Africa Ammeters Market Value (US$ Mn) by Product Type, 2022-2032
Figure 123: Middle East and Africa Ammeters Market Value (US$ Mn) by End Use, 2022-2032
Figure 124: Middle East and Africa Ammeters Market Value (US$ Mn) by Country, 2022-2032
Figure 125: Middle East and Africa Ammeters Market Value (US$ Mn) Analysis by Country, 2017-2032
Figure 126: Middle East and Africa Ammeters Market Volume (Units) Analysis by Country, 2017-2032
Figure 127: Middle East and Africa Ammeters Market Value Share (%) and BPS Analysis by Country, 2022-2032
Figure 128: Middle East and Africa Ammeters Market Y-o-Y Growth (%) Projections by Country, 2022-2032
Figure 129: Middle East and Africa Ammeters Market Value (US$ Mn) Analysis by Measurement Type, 2017-2032
Figure 130: Middle East and Africa Ammeters Market Volume (Units) Analysis by Measurement Type, 2017-2032
Figure 131: Middle East and Africa Ammeters Market Value Share (%) and BPS Analysis by Measurement Type, 2022-2032
Figure 132: Middle East and Africa Ammeters Market Y-o-Y Growth (%) Projections by Measurement Type, 2022-2032
Figure 133: Middle East and Africa Ammeters Market Value (US$ Mn) Analysis by Product Type, 2017-2032
Figure 134: Middle East and Africa Ammeters Market Volume (Units) Analysis by Product Type, 2017-2032
Figure 135: Middle East and Africa Ammeters Market Value Share (%) and BPS Analysis by Product Type, 2022-2032
Figure 136: Middle East and Africa Ammeters Market Y-o-Y Growth (%) Projections by Product Type, 2022-2032
Figure 137: Middle East and Africa Ammeters Market Value (US$ Mn) Analysis by End Use, 2017-2032
Figure 138: Middle East and Africa Ammeters Market Volume (Units) Analysis by End Use, 2017-2032
Figure 139: Middle East and Africa Ammeters Market Value Share (%) and BPS Analysis by End Use, 2022-2032
Figure 140: Middle East and Africa Ammeters Market Y-o-Y Growth (%) Projections by End Use, 2022-2032
Figure 141: Middle East and Africa Ammeters Market Attractiveness by Measurement Type, 2022-2032
Figure 142: Middle East and Africa Ammeters Market Attractiveness by Product Type, 2022-2032
Figure 143: Middle East and Africa Ammeters Market Attractiveness by End Use, 2022-2032
Figure 144: Middle East and Africa Ammeters Market Attractiveness by Country, 2022-2032
Need specific information?
Request CustomizationExplore Testing Equipment Insights
View Reports