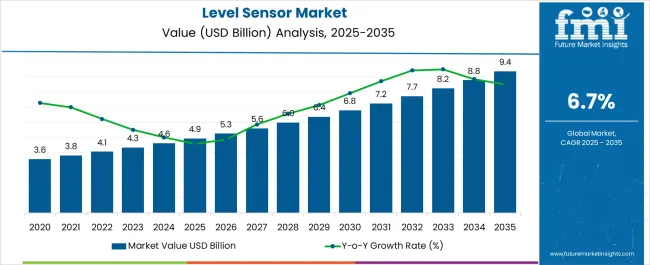
The level sensor market is expected to reach USD 4.3 billion in 2023 to USD 8.6 billion by 2033. The global level sensor market is anticipated to grow at a CAGR of 7% from 2023 to 2033.
Report Attribute | Details |
---|---|
2023 Market Value | USD 4.3 billion |
2033 Market Value | USD 8.6 billion |
CAGR (2023 to 2033) | 7% |
Share of Top 5 Market Players | 30% |
The level sensor accounted for almost 5.0% market share of the global sensor market. The global market for the level sensor is anticipated to be fueled by factors such as the rapid adoption of industrial automation, and the integration of IoT sensors in level measurement applications.
The reduction in size and the growing penetration of micro-electromechanical systems (MEMS) technology in the level sensors industry have created a wide horizon of applications. The fast-track adoption of the Industrial Internet of Things (IIoT) in various industries, referred to as industrial revolution 4.0, has proved to be a catalyst for the level sensor market.
The global level sensor market was valued at USD 4.1 billion in 2022. The demand for level sensors rose at a CAGR of 6% during the period from 2018 to 2022. Level sensors are becoming a major choice for automation in industries with large-scale manufacturing and storage of liquids or powdered materials.
Collectively, Western Europe and the Asia Pacific Excluding Japan regions are likely to account for the majority of revenue shares in the level sensor market by 2033. The oil & gas segment is set to register the highest market share of around 19.7% in the global level sensor market in 2022.
Sensor technology advancements create new growth opportunities for the level sensor market. Continuous developments and implementation of new technologies such as laser and ultrasonic technologies in level sensor devices are creating opportunities for growth for the level sensor market.
The rising adoption of smart sensors capable of self-diagnosis and two-way communication is projected to drive market growth. For instance, applications such as water conservation make use of digital technology and can be connected to microcontrollers to monitor water capacity and usage.
Moreover, growing industrial wireless technology helps to implement various features in level sensors for wastewater treatment and water tank applications. For instance, Vega Grieshaber KG introduced a process sensor ‘PLICSCOM’ with wireless operations.
Plicscom has Bluetooth functionality, which provides diagnostics and facilities operations. This process sensor is used for level measurement in wastewater treatment and pump station applications, as well as stormwater overflow tanks.
The ability to offer higher efficiency, accuracy, maintenance, and easy installation is estimated to augment the level sensor market growth across the globe. Additionally, vendors have been resorting to significant developments in terms of new product launches, which have been suggestive of the same.
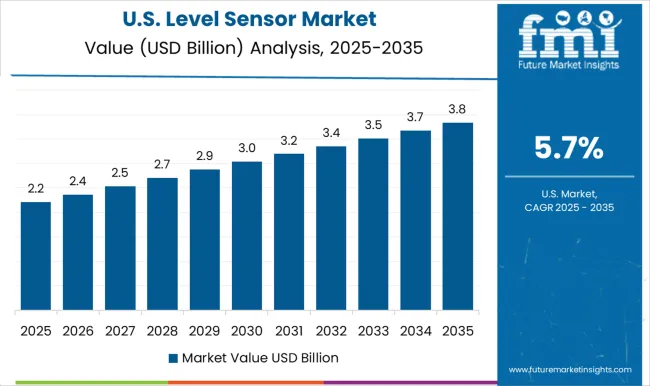
Currently, the United States market anticipates the largest consumption of level sensors in the North American region, and is expected to account for a market share of around 88% in 2023. The United States market for the level sensor is expected to expand 1.4X by 2033.
The United States market witnessed significant growth in level sensor sales, driven by the increased investments in automation and focus on the efficiency of processes across the pharmaceutical, oil, and gas, and food processing industries. Vendors in the region are investing in expanding their level sensor product portfolio to cater to the growing demands.
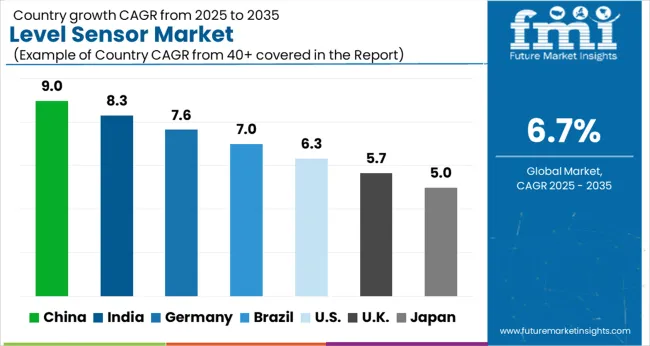
China is set to register exponential growth of level sensors in the global level sensor market with a CAGR of 10.5% from 2023 to 2033. The Chinese market is anticipated to create an absolute dollar opportunity of USD 400 million between 2023 & 2033.
This growth is attributed to the combination of advanced signal conditioning together with packaging techniques and a high-technology sensor that provides an ideal extensive solution for accurate, reliable, and economical level measurements.
Increasing demand in new and existing manufacturing industries in China is expected to boost the performance of the market during the forecast period. The need to detect the presence and absence of bulk solid material over a wide range of material densities is driving the level sensor market growth.
Brazil's market is set to report significant adoption of the level sensor in the Latin America region, and the market size is expected to grow by 1.2X between 2023 & 2033. Brazil's level sensor market is anticipated to create an absolute dollar opportunity of USD 23 million from 2023 to 2033.
Increasing investment in research activities and government initiatives to implement optical fiber technology in level sensing applications is driving the demand in the country. The presence of various small and medium-sized players in the Brazil and rising adoption of industrial wireless technologies in the country is driving the growth of the market.
The rising automatic liquid level sensing technologies trend is estimated to propel the growth of the market in Brazil.
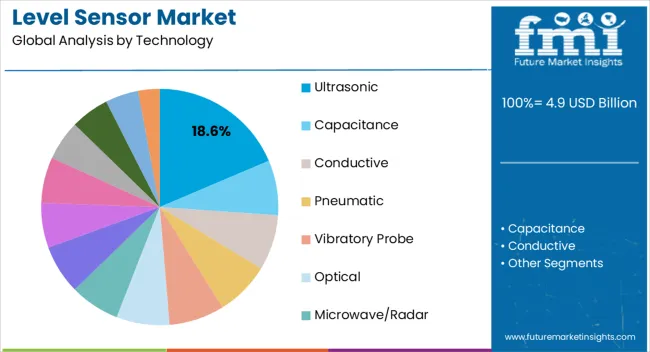
The ultrasonic level sensor segment by technology is projected to dominate the level sensor demand and hold the highest market share of nearly 17% in 2023. The ultrasonic technology segment is expected to register an incremental $ opportunity of USD 475 million between 2023 & 2033.
Ultrasonic level sensors measure substance levels based on the travel time of ultrasonic pulses to the surface of the medium and back. When installing the sensor, the typical block distance between the surface of the medium and the source of the ultrasonic pulse has to be considered. Thus, the ultrasonic technology segment is projected to maintain its dominance over the forecast period.
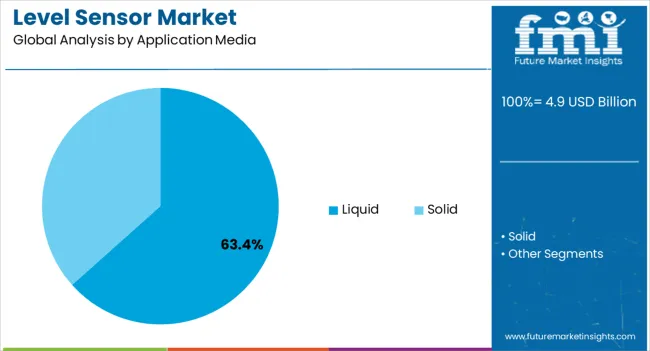
The liquid application media segment accounted for more than half of the overall demand for the level sensor in 2022. The increasing demand for liquid level measurement for chemical and petrochemical industries has been recently driving the growth of the level sensor market.
These are also used to detect the level of water in cooling circuits for nuclear power plants. The need for accurate level sensors and high precision, in industrial as well as commercial applications, is a significant factor driving the growth of the global level sensor market.
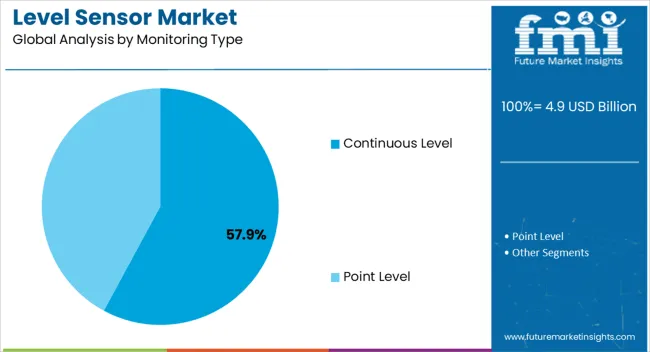
The point-level monitoring type segment is likely to witness high CAGR growth of around 6.7% during the forecast period. Increasing usage point level sensor to detect the presence and absence of bulk solid material over a very wide range of material densities is driving the demand.
Point level monitoring type increases the demand for leak detection or preventing run-dry or overspill situations, which is in turn driving the growth of the level sensor market.
In terms of value, the non-contact level sensors by device type are expected to create an incremental opportunity of around USD 863.6 million during the forecast period. Increasing usage of non-contact type level sensor for continuous non-contact level measurements is driving the demand, as compared to contact level sensors.
These sensors possess long lifespans and require less maintenance to make them work properly, along with being corrosion-resistant. These characteristics make users highly prefer the non-contact device type, thereby comprising a key segment of the global level sensor market.
The market size of the oil & gas sector by industry is set to expand by 1.6X by 2033. The oil & gas segment is set to register an absolute dollar opportunity of USD 500 million between 2023 & 2033.
The oil and gas sector is one of the most significant end users of level sensors, globally. With the growing crude oil production in some geographies, such as the United States of America & GCC countries, the need for level sensors is expected to surge. The extensive use of these sensors for downstream processing plants and monitoring storage units has maintained a constant demand for level sensors from the sector.
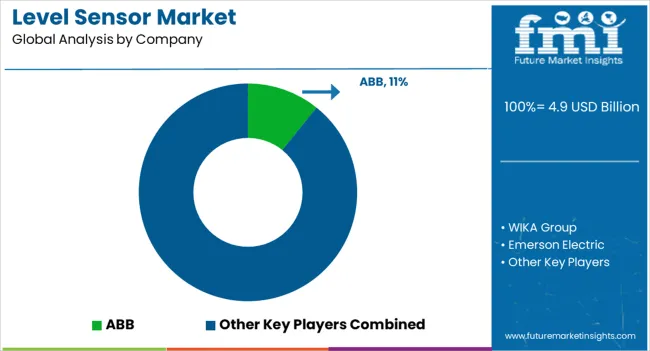
The global level sensor industry serves a highly fragmented competitive landscape. The market is witnessing a trend of acquisition of small sensor technology vendors by the major players, along with intense competition due to the demand for highly efficient products among the players. Product developments continue to be the key focal point of manufacturers in line with their key strategy to boost their market shareholdings.
Attributes | Details |
---|---|
Market value in 2022 | USD 4.1 billion |
2023 Market Value | USD 4.3 billion |
2033 Market Value | USD 8.6 billion |
CAGR% (2023 to 2033) | 7% |
Share of top 5 players | Around 30% |
Forecast Period | 2023 to 2033 |
Historical Data Available for | 2018 to 2022 |
Market Analysis | USD million for Value |
Key regions covered |
North America; Latin America; Western Europe; Eastern Europe; South Asia & Pacific; East Asia; Middle East & Africa |
Key countries covered |
United States, Canada, Brazil, Mexico, Germany, United Kingdom, France, Spain, Italy, Poland, Russia, Czech Republic, Romania, India, Bangladesh, Australia, New Zealand, China, Japan, South Korea, GCC Countries, South Africa, Israel |
Key market segments covered |
Technology, Application Media, Monitoring Type, Device Type, Industry, Region |
Key companies profiled |
ABB; WIKA Group; Emerson Electric; Endress+Hauser AG; Anderson-Negele; SICK AG; Aplus Finetek Sensor, Inc.; Pepperl+Fuchs; AMETEK, Inc.; Honeywell International Inc.; Vega Grieshaber Kg; FAFNIR GmbH; Senix Corporation; First Sensor; BinMaster (Garner Industries); Waterline Controls; Ifm Electronic GmbH; PIC GmbH; Nohken, Inc. |
Customization & pricing | Available upon request |
Table 1: Global Market Value (US$ Million) Forecast by Region, 2018 to 2033
Table 2: Global Market Volume (Units) Forecast by Region, 2018 to 2033
Table 3: Global Market Value (US$ Million) Forecast by Technology, 2018 to 2033
Table 4: Global Market Volume (Units) Forecast by Technology, 2018 to 2033
Table 5: Global Market Value (US$ Million) Forecast by Application Media, 2018 to 2033
Table 6: Global Market Volume (Units) Forecast by Application Media, 2018 to 2033
Table 7: Global Market Value (US$ Million) Forecast by Monitoring Type, 2018 to 2033
Table 8: Global Market Volume (Units) Forecast by Monitoring Type, 2018 to 2033
Table 9: Global Market Value (US$ Million) Forecast by Device Type, 2018 to 2033
Table 10: Global Market Volume (Units) Forecast by Device Type, 2018 to 2033
Table 11: Global Market Value (US$ Million) Forecast by Industry, 2018 to 2033
Table 12: Global Market Volume (Units) Forecast by Industry, 2018 to 2033
Table 13: North America Market Value (US$ Million) Forecast by Country, 2018 to 2033
Table 14: North America Market Volume (Units) Forecast by Country, 2018 to 2033
Table 15: North America Market Value (US$ Million) Forecast by Technology, 2018 to 2033
Table 16: North America Market Volume (Units) Forecast by Technology, 2018 to 2033
Table 17: North America Market Value (US$ Million) Forecast by Application Media, 2018 to 2033
Table 18: North America Market Volume (Units) Forecast by Application Media, 2018 to 2033
Table 19: North America Market Value (US$ Million) Forecast by Monitoring Type, 2018 to 2033
Table 20: North America Market Volume (Units) Forecast by Monitoring Type, 2018 to 2033
Table 21: North America Market Value (US$ Million) Forecast by Device Type, 2018 to 2033
Table 22: North America Market Volume (Units) Forecast by Device Type, 2018 to 2033
Table 23: North America Market Value (US$ Million) Forecast by Industry, 2018 to 2033
Table 24: North America Market Volume (Units) Forecast by Industry, 2018 to 2033
Table 25: Latin America Market Value (US$ Million) Forecast by Country, 2018 to 2033
Table 26: Latin America Market Volume (Units) Forecast by Country, 2018 to 2033
Table 27: Latin America Market Value (US$ Million) Forecast by Technology, 2018 to 2033
Table 28: Latin America Market Volume (Units) Forecast by Technology, 2018 to 2033
Table 29: Latin America Market Value (US$ Million) Forecast by Application Media, 2018 to 2033
Table 30: Latin America Market Volume (Units) Forecast by Application Media, 2018 to 2033
Table 31: Latin America Market Value (US$ Million) Forecast by Monitoring Type, 2018 to 2033
Table 32: Latin America Market Volume (Units) Forecast by Monitoring Type, 2018 to 2033
Table 33: Latin America Market Value (US$ Million) Forecast by Device Type, 2018 to 2033
Table 34: Latin America Market Volume (Units) Forecast by Device Type, 2018 to 2033
Table 35: Latin America Market Value (US$ Million) Forecast by Industry, 2018 to 2033
Table 36: Latin America Market Volume (Units) Forecast by Industry, 2018 to 2033
Table 37: Western Europe Market Value (US$ Million) Forecast by Country, 2018 to 2033
Table 38: Western Europe Market Volume (Units) Forecast by Country, 2018 to 2033
Table 39: Western Europe Market Value (US$ Million) Forecast by Technology, 2018 to 2033
Table 40: Western Europe Market Volume (Units) Forecast by Technology, 2018 to 2033
Table 41: Western Europe Market Value (US$ Million) Forecast by Application Media, 2018 to 2033
Table 42: Western Europe Market Volume (Units) Forecast by Application Media, 2018 to 2033
Table 43: Western Europe Market Value (US$ Million) Forecast by Monitoring Type, 2018 to 2033
Table 44: Western Europe Market Volume (Units) Forecast by Monitoring Type, 2018 to 2033
Table 45: Western Europe Market Value (US$ Million) Forecast by Device Type, 2018 to 2033
Table 46: Western Europe Market Volume (Units) Forecast by Device Type, 2018 to 2033
Table 47: Western Europe Market Value (US$ Million) Forecast by Industry, 2018 to 2033
Table 48: Western Europe Market Volume (Units) Forecast by Industry, 2018 to 2033
Table 49: Eastern Europe Market Value (US$ Million) Forecast by Country, 2018 to 2033
Table 50: Eastern Europe Market Volume (Units) Forecast by Country, 2018 to 2033
Table 51: Eastern Europe Market Value (US$ Million) Forecast by Technology, 2018 to 2033
Table 52: Eastern Europe Market Volume (Units) Forecast by Technology, 2018 to 2033
Table 53: Eastern Europe Market Value (US$ Million) Forecast by Application Media, 2018 to 2033
Table 54: Eastern Europe Market Volume (Units) Forecast by Application Media, 2018 to 2033
Table 55: Eastern Europe Market Value (US$ Million) Forecast by Monitoring Type, 2018 to 2033
Table 56: Eastern Europe Market Volume (Units) Forecast by Monitoring Type, 2018 to 2033
Table 57: Eastern Europe Market Value (US$ Million) Forecast by Device Type, 2018 to 2033
Table 58: Eastern Europe Market Volume (Units) Forecast by Device Type, 2018 to 2033
Table 59: Eastern Europe Market Value (US$ Million) Forecast by Industry, 2018 to 2033
Table 60: Eastern Europe Market Volume (Units) Forecast by Industry, 2018 to 2033
Table 61: South Asia and Pacific Market Value (US$ Million) Forecast by Country, 2018 to 2033
Table 62: South Asia and Pacific Market Volume (Units) Forecast by Country, 2018 to 2033
Table 63: South Asia and Pacific Market Value (US$ Million) Forecast by Technology, 2018 to 2033
Table 64: South Asia and Pacific Market Volume (Units) Forecast by Technology, 2018 to 2033
Table 65: South Asia and Pacific Market Value (US$ Million) Forecast by Application Media, 2018 to 2033
Table 66: South Asia and Pacific Market Volume (Units) Forecast by Application Media, 2018 to 2033
Table 67: South Asia and Pacific Market Value (US$ Million) Forecast by Monitoring Type, 2018 to 2033
Table 68: South Asia and Pacific Market Volume (Units) Forecast by Monitoring Type, 2018 to 2033
Table 69: South Asia and Pacific Market Value (US$ Million) Forecast by Device Type, 2018 to 2033
Table 70: South Asia and Pacific Market Volume (Units) Forecast by Device Type, 2018 to 2033
Table 71: South Asia and Pacific Market Value (US$ Million) Forecast by Industry, 2018 to 2033
Table 72: South Asia and Pacific Market Volume (Units) Forecast by Industry, 2018 to 2033
Table 73: East Asia Market Value (US$ Million) Forecast by Country, 2018 to 2033
Table 74: East Asia Market Volume (Units) Forecast by Country, 2018 to 2033
Table 75: East Asia Market Value (US$ Million) Forecast by Technology, 2018 to 2033
Table 76: East Asia Market Volume (Units) Forecast by Technology, 2018 to 2033
Table 77: East Asia Market Value (US$ Million) Forecast by Application Media, 2018 to 2033
Table 78: East Asia Market Volume (Units) Forecast by Application Media, 2018 to 2033
Table 79: East Asia Market Value (US$ Million) Forecast by Monitoring Type, 2018 to 2033
Table 80: East Asia Market Volume (Units) Forecast by Monitoring Type, 2018 to 2033
Table 81: East Asia Market Value (US$ Million) Forecast by Device Type, 2018 to 2033
Table 82: East Asia Market Volume (Units) Forecast by Device Type, 2018 to 2033
Table 83: East Asia Market Value (US$ Million) Forecast by Industry, 2018 to 2033
Table 84: East Asia Market Volume (Units) Forecast by Industry, 2018 to 2033
Table 85: Middle East and Africa Market Value (US$ Million) Forecast by Country, 2018 to 2033
Table 86: Middle East and Africa Market Volume (Units) Forecast by Country, 2018 to 2033
Table 87: Middle East and Africa Market Value (US$ Million) Forecast by Technology, 2018 to 2033
Table 88: Middle East and Africa Market Volume (Units) Forecast by Technology, 2018 to 2033
Table 89: Middle East and Africa Market Value (US$ Million) Forecast by Application Media, 2018 to 2033
Table 90: Middle East and Africa Market Volume (Units) Forecast by Application Media, 2018 to 2033
Table 91: Middle East and Africa Market Value (US$ Million) Forecast by Monitoring Type, 2018 to 2033
Table 92: Middle East and Africa Market Volume (Units) Forecast by Monitoring Type, 2018 to 2033
Table 93: Middle East and Africa Market Value (US$ Million) Forecast by Device Type, 2018 to 2033
Table 94: Middle East and Africa Market Volume (Units) Forecast by Device Type, 2018 to 2033
Table 95: Middle East and Africa Market Value (US$ Million) Forecast by Industry, 2018 to 2033
Table 96: Middle East and Africa Market Volume (Units) Forecast by Industry, 2018 to 2033
Figure 1: Global Market Value (US$ Million) by Technology, 2023 to 2033
Figure 2: Global Market Value (US$ Million) by Application Media, 2023 to 2033
Figure 3: Global Market Value (US$ Million) by Monitoring Type, 2023 to 2033
Figure 4: Global Market Value (US$ Million) by Device Type, 2023 to 2033
Figure 5: Global Market Value (US$ Million) by Industry, 2023 to 2033
Figure 6: Global Market Value (US$ Million) by Region, 2023 to 2033
Figure 7: Global Market Value (US$ Million) Analysis by Region, 2018 to 2033
Figure 8: Global Market Volume (Units) Analysis by Region, 2018 to 2033
Figure 9: Global Market Value Share (%) and BPS Analysis by Region, 2023 to 2033
Figure 10: Global Market Y-o-Y Growth (%) Projections by Region, 2023 to 2033
Figure 11: Global Market Value (US$ Million) Analysis by Technology, 2018 to 2033
Figure 12: Global Market Volume (Units) Analysis by Technology, 2018 to 2033
Figure 13: Global Market Value Share (%) and BPS Analysis by Technology, 2023 to 2033
Figure 14: Global Market Y-o-Y Growth (%) Projections by Technology, 2023 to 2033
Figure 15: Global Market Value (US$ Million) Analysis by Application Media, 2018 to 2033
Figure 16: Global Market Volume (Units) Analysis by Application Media, 2018 to 2033
Figure 17: Global Market Value Share (%) and BPS Analysis by Application Media, 2023 to 2033
Figure 18: Global Market Y-o-Y Growth (%) Projections by Application Media, 2023 to 2033
Figure 19: Global Market Value (US$ Million) Analysis by Monitoring Type, 2018 to 2033
Figure 20: Global Market Volume (Units) Analysis by Monitoring Type, 2018 to 2033
Figure 21: Global Market Value Share (%) and BPS Analysis by Monitoring Type, 2023 to 2033
Figure 22: Global Market Y-o-Y Growth (%) Projections by Monitoring Type, 2023 to 2033
Figure 23: Global Market Value (US$ Million) Analysis by Device Type, 2018 to 2033
Figure 24: Global Market Volume (Units) Analysis by Device Type, 2018 to 2033
Figure 25: Global Market Value Share (%) and BPS Analysis by Device Type, 2023 to 2033
Figure 26: Global Market Y-o-Y Growth (%) Projections by Device Type, 2023 to 2033
Figure 27: Global Market Value (US$ Million) Analysis by Industry, 2018 to 2033
Figure 28: Global Market Volume (Units) Analysis by Industry, 2018 to 2033
Figure 29: Global Market Value Share (%) and BPS Analysis by Industry, 2023 to 2033
Figure 30: Global Market Y-o-Y Growth (%) Projections by Industry, 2023 to 2033
Figure 31: Global Market Attractiveness by Technology, 2023 to 2033
Figure 32: Global Market Attractiveness by Application Media, 2023 to 2033
Figure 33: Global Market Attractiveness by Monitoring Type, 2023 to 2033
Figure 34: Global Market Attractiveness by Device Type, 2023 to 2033
Figure 35: Global Market Attractiveness by Industry, 2023 to 2033
Figure 36: Global Market Attractiveness by Region, 2023 to 2033
Figure 37: North America Market Value (US$ Million) by Technology, 2023 to 2033
Figure 38: North America Market Value (US$ Million) by Application Media, 2023 to 2033
Figure 39: North America Market Value (US$ Million) by Monitoring Type, 2023 to 2033
Figure 40: North America Market Value (US$ Million) by Device Type, 2023 to 2033
Figure 41: North America Market Value (US$ Million) by Industry, 2023 to 2033
Figure 42: North America Market Value (US$ Million) by Country, 2023 to 2033
Figure 43: North America Market Value (US$ Million) Analysis by Country, 2018 to 2033
Figure 44: North America Market Volume (Units) Analysis by Country, 2018 to 2033
Figure 45: North America Market Value Share (%) and BPS Analysis by Country, 2023 to 2033
Figure 46: North America Market Y-o-Y Growth (%) Projections by Country, 2023 to 2033
Figure 47: North America Market Value (US$ Million) Analysis by Technology, 2018 to 2033
Figure 48: North America Market Volume (Units) Analysis by Technology, 2018 to 2033
Figure 49: North America Market Value Share (%) and BPS Analysis by Technology, 2023 to 2033
Figure 50: North America Market Y-o-Y Growth (%) Projections by Technology, 2023 to 2033
Figure 51: North America Market Value (US$ Million) Analysis by Application Media, 2018 to 2033
Figure 52: North America Market Volume (Units) Analysis by Application Media, 2018 to 2033
Figure 53: North America Market Value Share (%) and BPS Analysis by Application Media, 2023 to 2033
Figure 54: North America Market Y-o-Y Growth (%) Projections by Application Media, 2023 to 2033
Figure 55: North America Market Value (US$ Million) Analysis by Monitoring Type, 2018 to 2033
Figure 56: North America Market Volume (Units) Analysis by Monitoring Type, 2018 to 2033
Figure 57: North America Market Value Share (%) and BPS Analysis by Monitoring Type, 2023 to 2033
Figure 58: North America Market Y-o-Y Growth (%) Projections by Monitoring Type, 2023 to 2033
Figure 59: North America Market Value (US$ Million) Analysis by Device Type, 2018 to 2033
Figure 60: North America Market Volume (Units) Analysis by Device Type, 2018 to 2033
Figure 61: North America Market Value Share (%) and BPS Analysis by Device Type, 2023 to 2033
Figure 62: North America Market Y-o-Y Growth (%) Projections by Device Type, 2023 to 2033
Figure 63: North America Market Value (US$ Million) Analysis by Industry, 2018 to 2033
Figure 64: North America Market Volume (Units) Analysis by Industry, 2018 to 2033
Figure 65: North America Market Value Share (%) and BPS Analysis by Industry, 2023 to 2033
Figure 66: North America Market Y-o-Y Growth (%) Projections by Industry, 2023 to 2033
Figure 67: North America Market Attractiveness by Technology, 2023 to 2033
Figure 68: North America Market Attractiveness by Application Media, 2023 to 2033
Figure 69: North America Market Attractiveness by Monitoring Type, 2023 to 2033
Figure 70: North America Market Attractiveness by Device Type, 2023 to 2033
Figure 71: North America Market Attractiveness by Industry, 2023 to 2033
Figure 72: North America Market Attractiveness by Country, 2023 to 2033
Figure 73: Latin America Market Value (US$ Million) by Technology, 2023 to 2033
Figure 74: Latin America Market Value (US$ Million) by Application Media, 2023 to 2033
Figure 75: Latin America Market Value (US$ Million) by Monitoring Type, 2023 to 2033
Figure 76: Latin America Market Value (US$ Million) by Device Type, 2023 to 2033
Figure 77: Latin America Market Value (US$ Million) by Industry, 2023 to 2033
Figure 78: Latin America Market Value (US$ Million) by Country, 2023 to 2033
Figure 79: Latin America Market Value (US$ Million) Analysis by Country, 2018 to 2033
Figure 80: Latin America Market Volume (Units) Analysis by Country, 2018 to 2033
Figure 81: Latin America Market Value Share (%) and BPS Analysis by Country, 2023 to 2033
Figure 82: Latin America Market Y-o-Y Growth (%) Projections by Country, 2023 to 2033
Figure 83: Latin America Market Value (US$ Million) Analysis by Technology, 2018 to 2033
Figure 84: Latin America Market Volume (Units) Analysis by Technology, 2018 to 2033
Figure 85: Latin America Market Value Share (%) and BPS Analysis by Technology, 2023 to 2033
Figure 86: Latin America Market Y-o-Y Growth (%) Projections by Technology, 2023 to 2033
Figure 87: Latin America Market Value (US$ Million) Analysis by Application Media, 2018 to 2033
Figure 88: Latin America Market Volume (Units) Analysis by Application Media, 2018 to 2033
Figure 89: Latin America Market Value Share (%) and BPS Analysis by Application Media, 2023 to 2033
Figure 90: Latin America Market Y-o-Y Growth (%) Projections by Application Media, 2023 to 2033
Figure 91: Latin America Market Value (US$ Million) Analysis by Monitoring Type, 2018 to 2033
Figure 92: Latin America Market Volume (Units) Analysis by Monitoring Type, 2018 to 2033
Figure 93: Latin America Market Value Share (%) and BPS Analysis by Monitoring Type, 2023 to 2033
Figure 94: Latin America Market Y-o-Y Growth (%) Projections by Monitoring Type, 2023 to 2033
Figure 95: Latin America Market Value (US$ Million) Analysis by Device Type, 2018 to 2033
Figure 96: Latin America Market Volume (Units) Analysis by Device Type, 2018 to 2033
Figure 97: Latin America Market Value Share (%) and BPS Analysis by Device Type, 2023 to 2033
Figure 98: Latin America Market Y-o-Y Growth (%) Projections by Device Type, 2023 to 2033
Figure 99: Latin America Market Value (US$ Million) Analysis by Industry, 2018 to 2033
Figure 100: Latin America Market Volume (Units) Analysis by Industry, 2018 to 2033
Figure 101: Latin America Market Value Share (%) and BPS Analysis by Industry, 2023 to 2033
Figure 102: Latin America Market Y-o-Y Growth (%) Projections by Industry, 2023 to 2033
Figure 103: Latin America Market Attractiveness by Technology, 2023 to 2033
Figure 104: Latin America Market Attractiveness by Application Media, 2023 to 2033
Figure 105: Latin America Market Attractiveness by Monitoring Type, 2023 to 2033
Figure 106: Latin America Market Attractiveness by Device Type, 2023 to 2033
Figure 107: Latin America Market Attractiveness by Industry, 2023 to 2033
Figure 108: Latin America Market Attractiveness by Country, 2023 to 2033
Figure 109: Western Europe Market Value (US$ Million) by Technology, 2023 to 2033
Figure 110: Western Europe Market Value (US$ Million) by Application Media, 2023 to 2033
Figure 111: Western Europe Market Value (US$ Million) by Monitoring Type, 2023 to 2033
Figure 112: Western Europe Market Value (US$ Million) by Device Type, 2023 to 2033
Figure 113: Western Europe Market Value (US$ Million) by Industry, 2023 to 2033
Figure 114: Western Europe Market Value (US$ Million) by Country, 2023 to 2033
Figure 115: Western Europe Market Value (US$ Million) Analysis by Country, 2018 to 2033
Figure 116: Western Europe Market Volume (Units) Analysis by Country, 2018 to 2033
Figure 117: Western Europe Market Value Share (%) and BPS Analysis by Country, 2023 to 2033
Figure 118: Western Europe Market Y-o-Y Growth (%) Projections by Country, 2023 to 2033
Figure 119: Western Europe Market Value (US$ Million) Analysis by Technology, 2018 to 2033
Figure 120: Western Europe Market Volume (Units) Analysis by Technology, 2018 to 2033
Figure 121: Western Europe Market Value Share (%) and BPS Analysis by Technology, 2023 to 2033
Figure 122: Western Europe Market Y-o-Y Growth (%) Projections by Technology, 2023 to 2033
Figure 123: Western Europe Market Value (US$ Million) Analysis by Application Media, 2018 to 2033
Figure 124: Western Europe Market Volume (Units) Analysis by Application Media, 2018 to 2033
Figure 125: Western Europe Market Value Share (%) and BPS Analysis by Application Media, 2023 to 2033
Figure 126: Western Europe Market Y-o-Y Growth (%) Projections by Application Media, 2023 to 2033
Figure 127: Western Europe Market Value (US$ Million) Analysis by Monitoring Type, 2018 to 2033
Figure 128: Western Europe Market Volume (Units) Analysis by Monitoring Type, 2018 to 2033
Figure 129: Western Europe Market Value Share (%) and BPS Analysis by Monitoring Type, 2023 to 2033
Figure 130: Western Europe Market Y-o-Y Growth (%) Projections by Monitoring Type, 2023 to 2033
Figure 131: Western Europe Market Value (US$ Million) Analysis by Device Type, 2018 to 2033
Figure 132: Western Europe Market Volume (Units) Analysis by Device Type, 2018 to 2033
Figure 133: Western Europe Market Value Share (%) and BPS Analysis by Device Type, 2023 to 2033
Figure 134: Western Europe Market Y-o-Y Growth (%) Projections by Device Type, 2023 to 2033
Figure 135: Western Europe Market Value (US$ Million) Analysis by Industry, 2018 to 2033
Figure 136: Western Europe Market Volume (Units) Analysis by Industry, 2018 to 2033
Figure 137: Western Europe Market Value Share (%) and BPS Analysis by Industry, 2023 to 2033
Figure 138: Western Europe Market Y-o-Y Growth (%) Projections by Industry, 2023 to 2033
Figure 139: Western Europe Market Attractiveness by Technology, 2023 to 2033
Figure 140: Western Europe Market Attractiveness by Application Media, 2023 to 2033
Figure 141: Western Europe Market Attractiveness by Monitoring Type, 2023 to 2033
Figure 142: Western Europe Market Attractiveness by Device Type, 2023 to 2033
Figure 143: Western Europe Market Attractiveness by Industry, 2023 to 2033
Figure 144: Western Europe Market Attractiveness by Country, 2023 to 2033
Figure 145: Eastern Europe Market Value (US$ Million) by Technology, 2023 to 2033
Figure 146: Eastern Europe Market Value (US$ Million) by Application Media, 2023 to 2033
Figure 147: Eastern Europe Market Value (US$ Million) by Monitoring Type, 2023 to 2033
Figure 148: Eastern Europe Market Value (US$ Million) by Device Type, 2023 to 2033
Figure 149: Eastern Europe Market Value (US$ Million) by Industry, 2023 to 2033
Figure 150: Eastern Europe Market Value (US$ Million) by Country, 2023 to 2033
Figure 151: Eastern Europe Market Value (US$ Million) Analysis by Country, 2018 to 2033
Figure 152: Eastern Europe Market Volume (Units) Analysis by Country, 2018 to 2033
Figure 153: Eastern Europe Market Value Share (%) and BPS Analysis by Country, 2023 to 2033
Figure 154: Eastern Europe Market Y-o-Y Growth (%) Projections by Country, 2023 to 2033
Figure 155: Eastern Europe Market Value (US$ Million) Analysis by Technology, 2018 to 2033
Figure 156: Eastern Europe Market Volume (Units) Analysis by Technology, 2018 to 2033
Figure 157: Eastern Europe Market Value Share (%) and BPS Analysis by Technology, 2023 to 2033
Figure 158: Eastern Europe Market Y-o-Y Growth (%) Projections by Technology, 2023 to 2033
Figure 159: Eastern Europe Market Value (US$ Million) Analysis by Application Media, 2018 to 2033
Figure 160: Eastern Europe Market Volume (Units) Analysis by Application Media, 2018 to 2033
Figure 161: Eastern Europe Market Value Share (%) and BPS Analysis by Application Media, 2023 to 2033
Figure 162: Eastern Europe Market Y-o-Y Growth (%) Projections by Application Media, 2023 to 2033
Figure 163: Eastern Europe Market Value (US$ Million) Analysis by Monitoring Type, 2018 to 2033
Figure 164: Eastern Europe Market Volume (Units) Analysis by Monitoring Type, 2018 to 2033
Figure 165: Eastern Europe Market Value Share (%) and BPS Analysis by Monitoring Type, 2023 to 2033
Figure 166: Eastern Europe Market Y-o-Y Growth (%) Projections by Monitoring Type, 2023 to 2033
Figure 167: Eastern Europe Market Value (US$ Million) Analysis by Device Type, 2018 to 2033
Figure 168: Eastern Europe Market Volume (Units) Analysis by Device Type, 2018 to 2033
Figure 169: Eastern Europe Market Value Share (%) and BPS Analysis by Device Type, 2023 to 2033
Figure 170: Eastern Europe Market Y-o-Y Growth (%) Projections by Device Type, 2023 to 2033
Figure 171: Eastern Europe Market Value (US$ Million) Analysis by Industry, 2018 to 2033
Figure 172: Eastern Europe Market Volume (Units) Analysis by Industry, 2018 to 2033
Figure 173: Eastern Europe Market Value Share (%) and BPS Analysis by Industry, 2023 to 2033
Figure 174: Eastern Europe Market Y-o-Y Growth (%) Projections by Industry, 2023 to 2033
Figure 175: Eastern Europe Market Attractiveness by Technology, 2023 to 2033
Figure 176: Eastern Europe Market Attractiveness by Application Media, 2023 to 2033
Figure 177: Eastern Europe Market Attractiveness by Monitoring Type, 2023 to 2033
Figure 178: Eastern Europe Market Attractiveness by Device Type, 2023 to 2033
Figure 179: Eastern Europe Market Attractiveness by Industry, 2023 to 2033
Figure 180: Eastern Europe Market Attractiveness by Country, 2023 to 2033
Figure 181: South Asia and Pacific Market Value (US$ Million) by Technology, 2023 to 2033
Figure 182: South Asia and Pacific Market Value (US$ Million) by Application Media, 2023 to 2033
Figure 183: South Asia and Pacific Market Value (US$ Million) by Monitoring Type, 2023 to 2033
Figure 184: South Asia and Pacific Market Value (US$ Million) by Device Type, 2023 to 2033
Figure 185: South Asia and Pacific Market Value (US$ Million) by Industry, 2023 to 2033
Figure 186: South Asia and Pacific Market Value (US$ Million) by Country, 2023 to 2033
Figure 187: South Asia and Pacific Market Value (US$ Million) Analysis by Country, 2018 to 2033
Figure 188: South Asia and Pacific Market Volume (Units) Analysis by Country, 2018 to 2033
Figure 189: South Asia and Pacific Market Value Share (%) and BPS Analysis by Country, 2023 to 2033
Figure 190: South Asia and Pacific Market Y-o-Y Growth (%) Projections by Country, 2023 to 2033
Figure 191: South Asia and Pacific Market Value (US$ Million) Analysis by Technology, 2018 to 2033
Figure 192: South Asia and Pacific Market Volume (Units) Analysis by Technology, 2018 to 2033
Figure 193: South Asia and Pacific Market Value Share (%) and BPS Analysis by Technology, 2023 to 2033
Figure 194: South Asia and Pacific Market Y-o-Y Growth (%) Projections by Technology, 2023 to 2033
Figure 195: South Asia and Pacific Market Value (US$ Million) Analysis by Application Media, 2018 to 2033
Figure 196: South Asia and Pacific Market Volume (Units) Analysis by Application Media, 2018 to 2033
Figure 197: South Asia and Pacific Market Value Share (%) and BPS Analysis by Application Media, 2023 to 2033
Figure 198: South Asia and Pacific Market Y-o-Y Growth (%) Projections by Application Media, 2023 to 2033
Figure 199: South Asia and Pacific Market Value (US$ Million) Analysis by Monitoring Type, 2018 to 2033
Figure 200: South Asia and Pacific Market Volume (Units) Analysis by Monitoring Type, 2018 to 2033
Figure 201: South Asia and Pacific Market Value Share (%) and BPS Analysis by Monitoring Type, 2023 to 2033
Figure 202: South Asia and Pacific Market Y-o-Y Growth (%) Projections by Monitoring Type, 2023 to 2033
Figure 203: South Asia and Pacific Market Value (US$ Million) Analysis by Device Type, 2018 to 2033
Figure 204: South Asia and Pacific Market Volume (Units) Analysis by Device Type, 2018 to 2033
Figure 205: South Asia and Pacific Market Value Share (%) and BPS Analysis by Device Type, 2023 to 2033
Figure 206: South Asia and Pacific Market Y-o-Y Growth (%) Projections by Device Type, 2023 to 2033
Figure 207: South Asia and Pacific Market Value (US$ Million) Analysis by Industry, 2018 to 2033
Figure 208: South Asia and Pacific Market Volume (Units) Analysis by Industry, 2018 to 2033
Figure 209: South Asia and Pacific Market Value Share (%) and BPS Analysis by Industry, 2023 to 2033
Figure 210: South Asia and Pacific Market Y-o-Y Growth (%) Projections by Industry, 2023 to 2033
Figure 211: South Asia and Pacific Market Attractiveness by Technology, 2023 to 2033
Figure 212: South Asia and Pacific Market Attractiveness by Application Media, 2023 to 2033
Figure 213: South Asia and Pacific Market Attractiveness by Monitoring Type, 2023 to 2033
Figure 214: South Asia and Pacific Market Attractiveness by Device Type, 2023 to 2033
Figure 215: South Asia and Pacific Market Attractiveness by Industry, 2023 to 2033
Figure 216: South Asia and Pacific Market Attractiveness by Country, 2023 to 2033
Figure 217: East Asia Market Value (US$ Million) by Technology, 2023 to 2033
Figure 218: East Asia Market Value (US$ Million) by Application Media, 2023 to 2033
Figure 219: East Asia Market Value (US$ Million) by Monitoring Type, 2023 to 2033
Figure 220: East Asia Market Value (US$ Million) by Device Type, 2023 to 2033
Figure 221: East Asia Market Value (US$ Million) by Industry, 2023 to 2033
Figure 222: East Asia Market Value (US$ Million) by Country, 2023 to 2033
Figure 223: East Asia Market Value (US$ Million) Analysis by Country, 2018 to 2033
Figure 224: East Asia Market Volume (Units) Analysis by Country, 2018 to 2033
Figure 225: East Asia Market Value Share (%) and BPS Analysis by Country, 2023 to 2033
Figure 226: East Asia Market Y-o-Y Growth (%) Projections by Country, 2023 to 2033
Figure 227: East Asia Market Value (US$ Million) Analysis by Technology, 2018 to 2033
Figure 228: East Asia Market Volume (Units) Analysis by Technology, 2018 to 2033
Figure 229: East Asia Market Value Share (%) and BPS Analysis by Technology, 2023 to 2033
Figure 230: East Asia Market Y-o-Y Growth (%) Projections by Technology, 2023 to 2033
Figure 231: East Asia Market Value (US$ Million) Analysis by Application Media, 2018 to 2033
Figure 232: East Asia Market Volume (Units) Analysis by Application Media, 2018 to 2033
Figure 233: East Asia Market Value Share (%) and BPS Analysis by Application Media, 2023 to 2033
Figure 234: East Asia Market Y-o-Y Growth (%) Projections by Application Media, 2023 to 2033
Figure 235: East Asia Market Value (US$ Million) Analysis by Monitoring Type, 2018 to 2033
Figure 236: East Asia Market Volume (Units) Analysis by Monitoring Type, 2018 to 2033
Figure 237: East Asia Market Value Share (%) and BPS Analysis by Monitoring Type, 2023 to 2033
Figure 238: East Asia Market Y-o-Y Growth (%) Projections by Monitoring Type, 2023 to 2033
Figure 239: East Asia Market Value (US$ Million) Analysis by Device Type, 2018 to 2033
Figure 240: East Asia Market Volume (Units) Analysis by Device Type, 2018 to 2033
Figure 241: East Asia Market Value Share (%) and BPS Analysis by Device Type, 2023 to 2033
Figure 242: East Asia Market Y-o-Y Growth (%) Projections by Device Type, 2023 to 2033
Figure 243: East Asia Market Value (US$ Million) Analysis by Industry, 2018 to 2033
Figure 244: East Asia Market Volume (Units) Analysis by Industry, 2018 to 2033
Figure 245: East Asia Market Value Share (%) and BPS Analysis by Industry, 2023 to 2033
Figure 246: East Asia Market Y-o-Y Growth (%) Projections by Industry, 2023 to 2033
Figure 247: East Asia Market Attractiveness by Technology, 2023 to 2033
Figure 248: East Asia Market Attractiveness by Application Media, 2023 to 2033
Figure 249: East Asia Market Attractiveness by Monitoring Type, 2023 to 2033
Figure 250: East Asia Market Attractiveness by Device Type, 2023 to 2033
Figure 251: East Asia Market Attractiveness by Industry, 2023 to 2033
Figure 252: East Asia Market Attractiveness by Country, 2023 to 2033
Figure 253: Middle East and Africa Market Value (US$ Million) by Technology, 2023 to 2033
Figure 254: Middle East and Africa Market Value (US$ Million) by Application Media, 2023 to 2033
Figure 255: Middle East and Africa Market Value (US$ Million) by Monitoring Type, 2023 to 2033
Figure 256: Middle East and Africa Market Value (US$ Million) by Device Type, 2023 to 2033
Figure 257: Middle East and Africa Market Value (US$ Million) by Industry, 2023 to 2033
Figure 258: Middle East and Africa Market Value (US$ Million) by Country, 2023 to 2033
Figure 259: Middle East and Africa Market Value (US$ Million) Analysis by Country, 2018 to 2033
Figure 260: Middle East and Africa Market Volume (Units) Analysis by Country, 2018 to 2033
Figure 261: Middle East and Africa Market Value Share (%) and BPS Analysis by Country, 2023 to 2033
Figure 262: Middle East and Africa Market Y-o-Y Growth (%) Projections by Country, 2023 to 2033
Figure 263: Middle East and Africa Market Value (US$ Million) Analysis by Technology, 2018 to 2033
Figure 264: Middle East and Africa Market Volume (Units) Analysis by Technology, 2018 to 2033
Figure 265: Middle East and Africa Market Value Share (%) and BPS Analysis by Technology, 2023 to 2033
Figure 266: Middle East and Africa Market Y-o-Y Growth (%) Projections by Technology, 2023 to 2033
Figure 267: Middle East and Africa Market Value (US$ Million) Analysis by Application Media, 2018 to 2033
Figure 268: Middle East and Africa Market Volume (Units) Analysis by Application Media, 2018 to 2033
Figure 269: Middle East and Africa Market Value Share (%) and BPS Analysis by Application Media, 2023 to 2033
Figure 270: Middle East and Africa Market Y-o-Y Growth (%) Projections by Application Media, 2023 to 2033
Figure 271: Middle East and Africa Market Value (US$ Million) Analysis by Monitoring Type, 2018 to 2033
Figure 272: Middle East and Africa Market Volume (Units) Analysis by Monitoring Type, 2018 to 2033
Figure 273: Middle East and Africa Market Value Share (%) and BPS Analysis by Monitoring Type, 2023 to 2033
Figure 274: Middle East and Africa Market Y-o-Y Growth (%) Projections by Monitoring Type, 2023 to 2033
Figure 275: Middle East and Africa Market Value (US$ Million) Analysis by Device Type, 2018 to 2033
Figure 276: Middle East and Africa Market Volume (Units) Analysis by Device Type, 2018 to 2033
Figure 277: Middle East and Africa Market Value Share (%) and BPS Analysis by Device Type, 2023 to 2033
Figure 278: Middle East and Africa Market Y-o-Y Growth (%) Projections by Device Type, 2023 to 2033
Figure 279: Middle East and Africa Market Value (US$ Million) Analysis by Industry, 2018 to 2033
Figure 280: Middle East and Africa Market Volume (Units) Analysis by Industry, 2018 to 2033
Figure 281: Middle East and Africa Market Value Share (%) and BPS Analysis by Industry, 2023 to 2033
Figure 282: Middle East and Africa Market Y-o-Y Growth (%) Projections by Industry, 2023 to 2033
Figure 283: Middle East and Africa Market Attractiveness by Technology, 2023 to 2033
Figure 284: Middle East and Africa Market Attractiveness by Application Media, 2023 to 2033
Figure 285: Middle East and Africa Market Attractiveness by Monitoring Type, 2023 to 2033
Figure 286: Middle East and Africa Market Attractiveness by Device Type, 2023 to 2033
Figure 287: Middle East and Africa Market Attractiveness by Industry, 2023 to 2033
Figure 288: Middle East and Africa Market Attractiveness by Country, 2023 to 2033
The projected revenue of the market by 2033 is USD 8.6 billion.
The market CAGR for 2033 is projected to be 7%.
Honeywell, ABB, and Emerson are the key market players.
The market is estimated to secure a valuation of USD 4.3 billion in 2023.
North America is growing fast due to the increasing demand for level sensors.
Explore Similar Insights
Thank you!
You will receive an email from our Business Development Manager. Please be sure to check your SPAM/JUNK folder too.