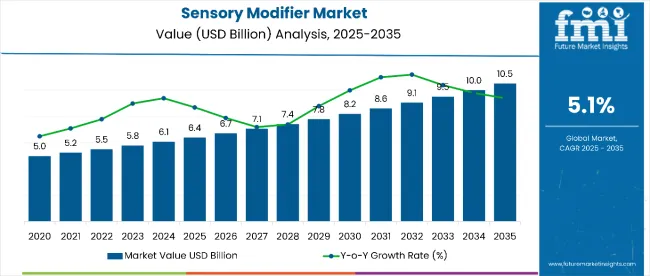
The sensory modifiermarket is estimated to be valued at USD 6.40 billion in 2025 and is projected to reach USD 10.5 billion by 2035, registering a CAGR of 5.1% over the forecast period. The market is projected to add an absolute dollar opportunity of USD 4.13 billion between 2025 and 2035.
| Metric | Value |
|---|---|
| Sensory Modifier Market Estimated Value (2025E) | USD 6.4 billion |
| Sensory Modifier Market Forecast Value (2035F) | USD 10.5 billion |
| Forecast CAGR (2025 to 2035) | 5.1% |
This reflects a 1.64 times growth at a compound annual growth rate of 5.1%. Market growth will be driven by rising consumer preference for natural cosmetic formulations, demand for multi-sensory experiences in personal care, and the increasing role of bio-based functional ingredients in skincare and haircare applications.
By 2030, the market is likely to reach approximately USD 8.2 billion, representing an incremental value of about USD 1.8 billion in the first half of the decade. The remaining USD 2.48 billion opportunity is expected to be realized between 2030 and 2035, suggesting a moderately back-loaded growth pattern.
Overall, the market is projected to add USD 4.1 billion in absolute dollar terms between 2025 and 2035. Product adoption is gaining traction due to sensory modifiers’ role in enhancing gloss, texture, and skin-feel attributes, positioning them as vital components in modern formulations.
Companies such as SensoryCo Inc. (15.0% share), Modifeye Technologies, SensiTouch Solutions, SensoryTech Innovations, and FeelSense Enterprises are strengthening their competitive positions through R&D in multifunctional agents, sustainable ingredient sourcing, and texture-optimizing technologies. Consumer demand will remain anchored in clean-label certification, sensory innovation, and sustainable cosmetic chemistry practices, with applications expanding into skin care (38.0% share), make-up, hair care, and personal hygiene products.
The market is expanding steadily, driven by the growing demand for multi-functional cosmetic and personal care formulations. Natural sensory modifiers dominate the market with a 64.2% share, reflecting a strong consumer preference for sustainable, bio-based ingredients over synthetic alternatives.
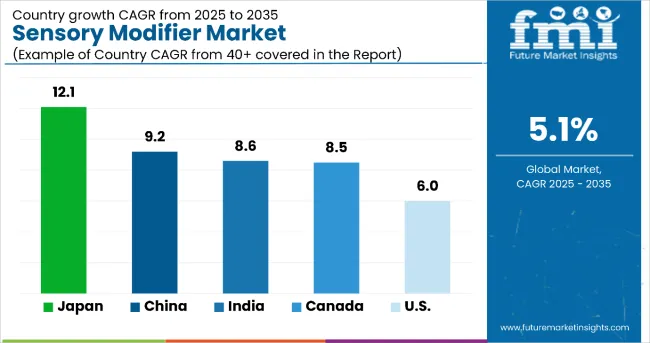
Japan leads as a key growth country with a market value of 12.1, followed by China (9.2) and India (8.6). In terms of functions, gloss modifiers account for 34%, while skin care applications hold 38% of the market share, highlighting the importance of sensory enhancers in beauty and personal care products. By type, emollients lead with 41%, widely used in face creams, anti-aging solutions, and sun protection products.
The market is further shaped by leading companies such as SensoryCo Inc. (15% share), Modifeye Technologies, SensiTouch Solutions, SensoryTech Innovations, and FeelSense Enterprises, who are investing in novel bio-based modifiers and multi-sensory solutions. The industry is undergoing structural transformation with the adoption of advanced formulation technologies to improve texture, consistency, and multi-sensory balance, reinforcing its role in cosmetics, personal hygiene, and pharmaceuticals.
The market is expanding as natural and bio-based ingredients become central to cosmetic and personal care formulations. Rising consumer preference for clean-label, sustainable, and natural cosmetic products is driving demand, with sensory modifiers playing a key role in enhancing gloss, texture, firmness, and skin-feel attributes.
Growing interest in multi-sensory experiences across skincare, make-up, and haircare is further accelerating adoption. The market is also supported by the shift toward functional ingredients. In applications, skin care accounts for 38% of the market, while among ingredient types, emollients lead with 41%, improving product efficacy and consumer satisfaction.
The market is segmented by nature, function, application, type, form, and region. By nature, the market is bifurcated into natural and synthetic. Based on function, the market is divided into gloss, color, odor, firmness, texture, and other multi-sensory attributes. By application, the market is categorized into make-up, skin care, face cream, anti-aging, sun protection, hair care, personal hygiene, and other categories such as fragrances and pharmaceuticals. By type, the market is divided into emollients, occlusives, humectants, and novel multifunctional agents. Based on form, the market is segmented into powders, liquids, and semi-solids. Regionally, the market spans across North America, Europe, Asia-Pacific, Latin America, Middle East & Africa.
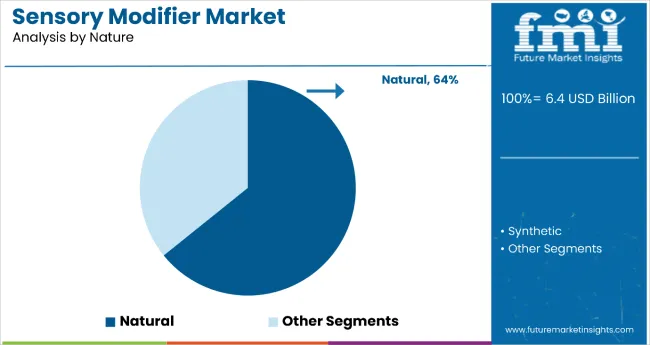
Natural sensory modifiers are the most lucrative by nature, holding an estimated 64% market share. Demand is propelled by clean-beauty and sustainability mandates, where brands prioritize bio-based, traceable inputs that improve skin-feel, texture, and gloss without synthetic additives. Natural formats command price premiums, enable stronger free-from and eco-certified claims, and fit seamlessly into hero categories skin care, sun care, and anti-aging where sensorial performance drives repeat purchase.
Suppliers benefit from broader formulation latitude (liquid and multifunctional blends), faster adoption in Asia’s innovation hubs (Japan, China, India), and retailer standards that increasingly prefer naturally derived ingredients. Advancements in gentle extraction and stabilization are boosting consistency and shelf life, narrowing the historical gap with synthetics. While natural inputs face cost and harvest variability risks, their brand equity, regulatory alignment, and consumer trust position them for continued outperformance versus synthetics over the forecast period.
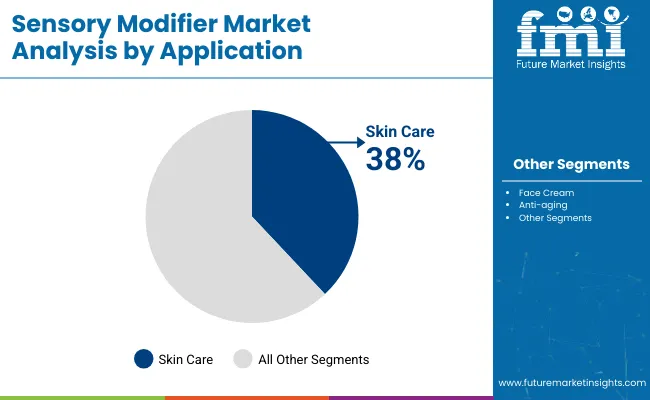
Skin care is the leading and most lucrative application segment, accounting for about 38% of the market share. This dominance is driven by consumers’ increasing demand for high-performance skin care products that not only deliver functional benefits but also enhance sensory appeal by improving texture, spreadability, gloss, and skin-feel attributes. Sensory modifiers are critical in face creams, anti-aging solutions, and sun protection products, where pleasant texture and immediate feel significantly influence consumer purchase and loyalty.
The global shift toward natural and bio-based skin care formulations further boosts the adoption of sensory modifiers, as they align with the clean-label and sustainability preferences of health-conscious buyers. Innovation in multifunctional formulations, particularly in Asia-Pacific and Europe, is accelerating adoption in moisturizers, serums, and protective creams. With premiumization trends, rising personal care spending, and growing awareness of anti-aging benefits, skin care applications will continue to lead market growth through 2035.
From 2025 to 2035, rising consumer demand for natural and bio-based cosmetic formulations has significantly accelerated adoption of sensory modifiers. Their role in enhancing gloss, texture, firmness, and overall sensory appeal makes them vital in skin care, make-up, and personal hygiene products. This trend positions producers of eco-certified, multifunctional sensory ingredients as key beneficiaries of the clean-label and sustainability movement in beauty and personal care.
Natural Ingredient Preference Drives Sensory Modifier Market Growth
The rising preference for natural and bio-based ingredients has emerged as the primary catalyst for growth in the sensory modifier market, with natural formats holding nearly 64% of the market share. Consumers increasingly associate natural formulations with safety, sustainability, and superior performance in terms of texture, gloss, and skin-feel. By 2024, stricter clean-label standards and retailer-driven sustainability mandates accelerated the shift away from synthetics. By 2025, beauty and personal care developers were expected to expand natural modifier adoption across skin care, anti-aging, and sun protection products, where sensory performance is a decisive purchase factor.
These developments indicate that scientifically validated performance attributes, not just marketing claims, are fueling market expansion. Suppliers offering standardized, traceable, and eco-certified natural modifiers are positioned to capture growing demand from both global beauty brands and regional innovators.
Value-Added Formulation Innovation Creates Market Opportunities
Manufacturers began focusing on advanced formulation technologies to create multi functional sensory modifiers that enhance spreadability, texture, and stability while meeting eco-label requirements. By 2025, innovative formats such as liquids (44% share), multi functional emollients (41%), and bio-based blends were being introduced, improving product performance in moisturizers, sunscreens, and premium make-up lines.
These developments show that when formulation innovation is combined with natural ingredient superiority, adoption accelerates across cosmetics, personal hygiene, and pharmaceuticals. Companies investing in novel bio-based solutions, liquid innovations, and multifunctional blends are well-positioned to capture expanding opportunities as the market grows toward USD 10.5 billion by 2035.
| Countries | CAGR (%) |
|---|---|
| Japan | 12.1% |
| China | 9.2% |
| India | 8.6% |
| Canada | 8.5% |
| United States | 6.0% |
The market demonstrates varied growth trajectories across the top five countries, reflecting unique consumer dynamics and regulatory environments. Japan leads with the highest CAGR of 12.1%, driven by its advanced R&D ecosystem and strong focus on premium skincare and anti-aging solutions. China follows with a 9.2% CAGR, supported by e-commerce dominance, rising disposable incomes, and multifunctional product adoption, making it the largest growth engine in Asia.
India, with a CAGR of 8.6%, shows high potential due to its young population, affordability-driven demand, and Ayurveda integration with modern sensorial innovation. Canada records a CAGR of 8.5%, benefiting from clean-label preferences, sustainability mandates, and collaborations between domestic and global players. The USA, though slower with a 6.0% CAGR, remains a critical innovation hub with premiumization trends and regulatory transparency driving adoption.
The report covers an in-depth analysis of 40+ countries; five top-performing OECD countries are highlighted below.
The sensory modifier market in Japan is projected to expand at a CAGR of 12.1% from 2025 to 2035, driven by rising demand for premium formulations that integrate natural and multifunctional modifiers. The rise of anti-aging and sun care segments provides a strong platform for growth, as consumers value product texture, gloss, and spreadability as much as efficacy.
Japan’s robust investment in R&D, combined with an advanced regulatory framework supporting clean-beauty and eco-label claims, has created a fertile environment for innovation. Tokyo and Osaka serve as centers for product development, where local brands and global leaders collaborate to introduce cutting-edge formulations. The country’s reputation for high-quality beauty products ensures continued global influence, driving adoption of next-generation sensory modifiers across Asia and beyond.
Revenue from sensory modifier in China is expected to grow at a CAGR of 9.2% from 2025 to 2035, supported by rising disposable incomes, urbanization, and the surge of beauty-conscious millennials and Gen Z. With a booming skincare sector, China has become one of the largest and most dynamic markets for sensory modifiers, driven by demand for multifunctional products that combine whitening, anti-aging, and hydration benefits.
E-commerce platforms like Tmall and JD.com play a crucial role, offering direct access to innovative formulations and accelerating consumer adoption. Domestic manufacturers are also gaining ground, leveraging local sourcing and affordable bio-based inputs to compete with global players. The government’s sustainability initiatives further encourage the shift toward naturally derived modifiers, strengthening clean-label awareness. This combination of strong digital distribution, consumer sophistication, and regulatory support positions China as a key global growth engine for the sensory modifier industry.
Demand for sensory modifier in India is projected to grow at a CAGR of 8.6% between 2025 to 2035, supported by a growing preference for natural, affordable, and multi functional beauty products. The country’s young demographic, combined with rising disposable incomes, is fueling strong demand for skin-lightening, moisturizing, and protective skincare products enhanced with sensory attributes.
India’s rich tradition of Ayurveda and herbal formulations is increasingly being integrated with modern sensorial enhancers, bridging consumer trust with innovation. Global multinationals are expanding their presence, targeting mass-market segments with tailored formulations, while local companies capitalize on herbal authenticity. With affordability driving large-scale adoption, sensory modifiers are being positioned as essential for creams, lotions, and personal care products.
Sales of sensory modifier in Canada are expected to grow at a CAGR of 8.5% from 2025 to 2035, supported by consumers’ increasing preference for clean-label, sustainable, and eco-certified beauty products. The Canadian market emphasizes premium skincare, personal hygiene, and organic formulations, creating a strong demand base for natural sensory modifiers. Manufacturers are integrating bio-based solutions to improve texture, consistency, and gloss while maintaining compliance with stringent health and safety regulations.
Specialty retail and online platforms are expanding rapidly, providing greater access to high-performance skincare lines that highlight sensory attributes. Collaborations between Canadian brands and global ingredient suppliers are also fostering innovation in multifunctional blends. This focus on sustainability, combined with consumer trust in safe and natural beauty products, positions Canada as a key North American hub for premium sensory modifier adoption.
The USA sensory modifier market is forecast to grow at a CAGR of 6.0% from 2025 to 2035, due to rising demand for premium skincare, sun protection, and multi functional beauty products among consumers. While the pace is slower than in Asia, the USA remains a global innovation hub, where sustainability and bio-based product development drive market differentiation. Consumers prioritize clean-label claims, texture improvements, and sensorial performance, making sensory modifiers critical in skincare and personal care formulations.
The strong presence of multinational beauty companies ensures consistent product innovation, while e-commerce and specialty retailers expand consumer access. Regulatory pressure around transparency and sourcing further reinforces demand for natural ingredients. Although mature, the USA market continues to evolve with premiumization trends, ensuring stable long-term adoption of sensory modifiers across high-value product categories.
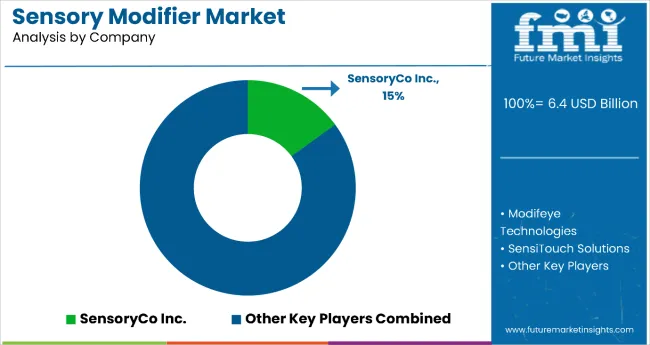
The market is moderately consolidated, with leading ingredient suppliers competing through innovation, bio-based solutions, and application-specific expertise. Givaudan, Firmenich, and Symrise dominate the premium fragrance, flavor, and cosmetic segment, leveraging advanced R&D and consumer insight platforms to design multifunctional sensory enhancers for beauty, food, and personal care applications. Their strength lies in developing patented molecules that enhance texture, mouthfeel, and sensorial appeal while aligning with clean-label and sustainability claims.
International Flavors & Fragrances (IFF) and Kerry Group focus on scalable solutions across food and beverage applications, addressing rising demand for natural taste modulators, mouthfeel enhancers, and masking agents in functional foods and nutraceuticals. Their competitive advantage comes from extensive formulation expertise and wide distribution networks catering to multinational FMCG brands.
Regional innovators such as Shin-Etsu Chemical (Japan) and Blue California (USA) emphasize biotechnological advancements, producing plant-based and fermentation-derived modifiers that appeal to the clean-beauty and natural nutrition segments. These players leverage localized expertise and sustainability credentials to differentiate within their markets while meeting strict regulatory and consumer safety requirements.
| Item | Value |
|---|---|
| Quantitative Units (2025) | USD 6.4 billion |
| Nature | Natural and Synthetic |
| Function | Gloss, Color, Odor, Firmness/Consistency, Texture, and Others (Stability Enhancers, Tactile Smoothness, and Cooling/Warming Agents) |
| Application | Skincare, Makeup, Face Cream, Anti-aging, Sun Protection, Hair Care, Personal Hygiene, and Others (Fragrances, Oral Care, and Pharmaceutical Formulations) |
| Type | Emollients, Occlusive, Humectants, and Others (Texture Modifiers, Conditioning Agents, and Sensory Enhancers) |
| Form | Powder, Liquid, and Semi-solids |
| Regions Covered | North America, Europe, Asia-Pacific, Latin America, and Middle East & Africa |
| Countries Covered | United States, Canada, Germany, France, United Kingdom, China, Japan, India, Brazil, South Africa, Australia and 40+ countries |
| Key Companies Profiled | Koninklijke DSM N.V., E. I. du Pont de Nemours and Company, BASF SE, Cargill Incorporated, Alchemy Ingredients, Solabia Group, Momentive Performance Materials, Sensient Cosmetic Technologies, and Naturex Group. |
| Additional Attributes | Dollar sales by function and application sector, rising adoption in premium skincare and anti-aging, increasing demand for bio-based and multifunctional inputs, strong growth in online retail, advancements in natural extraction technologies, and evolving consumer preference for clean-label, eco-certified beauty and wellness products. |
The global sensory modifier market is estimated to be valued at USD 6.4 billion in 2025.
The market size for the sensory modifier market is projected to reach USD 10.5 billion by 2035.
The sensory modifier market is expected to grow at a 5.1% CAGR between 2025 and 2035.
The key product types in sensory modifier market are synthetic and natural.
In terms of function, texture segment to command 28.4% share in the sensory modifier market in 2025.


Our Research Products

The "Full Research Suite" delivers actionable market intel, deep dives on markets or technologies, so clients act faster, cut risk, and unlock growth.

The Leaderboard benchmarks and ranks top vendors, classifying them as Established Leaders, Leading Challengers, or Disruptors & Challengers.

Locates where complements amplify value and substitutes erode it, forecasting net impact by horizon

We deliver granular, decision-grade intel: market sizing, 5-year forecasts, pricing, adoption, usage, revenue, and operational KPIs—plus competitor tracking, regulation, and value chains—across 60 countries broadly.

Spot the shifts before they hit your P&L. We track inflection points, adoption curves, pricing moves, and ecosystem plays to show where demand is heading, why it is changing, and what to do next across high-growth markets and disruptive tech

Real-time reads of user behavior. We track shifting priorities, perceptions of today’s and next-gen services, and provider experience, then pace how fast tech moves from trial to adoption, blending buyer, consumer, and channel inputs with social signals (#WhySwitch, #UX).

Partner with our analyst team to build a custom report designed around your business priorities. From analysing market trends to assessing competitors or crafting bespoke datasets, we tailor insights to your needs.
Supplier Intelligence
Discovery & Profiling
Capacity & Footprint
Performance & Risk
Compliance & Governance
Commercial Readiness
Who Supplies Whom
Scorecards & Shortlists
Playbooks & Docs
Category Intelligence
Definition & Scope
Demand & Use Cases
Cost Drivers
Market Structure
Supply Chain Map
Trade & Policy
Operating Norms
Deliverables
Buyer Intelligence
Account Basics
Spend & Scope
Procurement Model
Vendor Requirements
Terms & Policies
Entry Strategy
Pain Points & Triggers
Outputs
Pricing Analysis
Benchmarks
Trends
Should-Cost
Indexation
Landed Cost
Commercial Terms
Deliverables
Brand Analysis
Positioning & Value Prop
Share & Presence
Customer Evidence
Go-to-Market
Digital & Reputation
Compliance & Trust
KPIs & Gaps
Outputs
Full Research Suite comprises of:
Market outlook & trends analysis
Interviews & case studies
Strategic recommendations
Vendor profiles & capabilities analysis
5-year forecasts
8 regions and 60+ country-level data splits
Market segment data splits
12 months of continuous data updates
DELIVERED AS:
PDF EXCEL ONLINE
Gut Modifiers Market
Metal Modifiers Market Size and Share Forecast Outlook 2025 to 2035
Impact Modifier Market Growth & Trends 2018-2028
Bitumen Modifier Industry Analysis in Europe Size and Share Forecast Outlook 2025 to 2035
Rheology Modifiers Market Size and Share Forecast Outlook 2025 to 2035
Friction Modifiers Market Size and Share Forecast Outlook 2025 to 2035
Adhesive Modifier Market Analysis - Size, Share, and Forecast Outlook 2025 to 2035
Friction Modifier Additives Market Trends 2025 to 2035
Leukotriene Modifiers Market Growth - Demand, Innovations & Forecast 2025 to 2035
Organic Friction Modifier Additives Market 2022 to 2032
Biologic Response Modifiers Market
Natural Taste Enhancers and Modifiers Market

Thank you!
You will receive an email from our Business Development Manager. Please be sure to check your SPAM/JUNK folder too.
Chat With
MaRIA