Hose Reinforcement Wires Market Size and Share Forecast Outlook 2025 to 2035

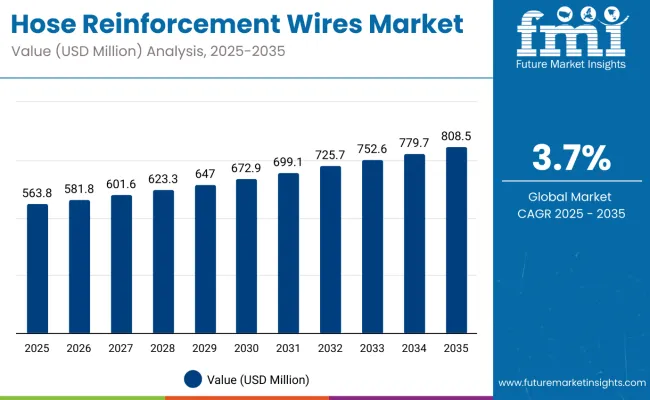
The global hose reinforcement wires market is projected to reach USD 563.8 million in 2025 and is expected to expand to approximately USD 808.5 million by 2035. This reflects an absolute increase of USD 244.7 million, representing a 43.4% rise in value over the forecast period. The market is forecast to grow at a compound annual growth rate (CAGR) of 3.7%, with the overall market size projected to expand by nearly 1.43X by the end of the decade.
Quick Stats For Hose Reinforcement Wires Market

  • Industry Value (2025): USD 563.8 million
  • Forecast Value (2035): USD 808.5 million
  • Forecast CAGR: 3.7%
  • Leading Segment (2025): Automotive Application (30% share)
  • Key Growth Region: China (fastest CAGR)
  • Top Key Players:Bekaert, KIS Wire, Shandong Daye, Hyosung Advanced Material, BMZ

Hose Reinforcement Wires Market

Metric Value
Industry Size (2025E) USD 563.8 Million
Industry Size (2035F) USD 808.5 Million
CAGR (2025-2035) 3.7%

Between 2025 and 2030, the hose reinforcement wires market is projected to grow from USD 563.8 million to USD 672.9 million, resulting in a value addition of USD 109.1 million over the first half of the forecast period. This phase of growth is expected to be supported by rising hydraulic hose consumption in construction equipment, mining, and agricultural machinery across high-demand regions.

Expansion in fluid power systems, driven by infrastructure development and mechanization trends in emerging economies, is fueling procurement of steel-reinforced hose assemblies with higher pressure ratings and improved fatigue resistance.

From 2030 to 2035, the market is forecast to advance from USD 672.9 million to USD 808.5 million, contributing an additional USD 135.6 million in value. The latter phase is likely to be characterized by increasing demand for multi-spiral and braided wire reinforcement formats compatible with compact hose designs and flexible routing. Rising emphasis on leak prevention, extended service life, and temperature resilience in hydraulic systems is expected to further influence product innovation and adoption across OEMs and aftermarket suppliers.

Between 2020 and 2025, the hose reinforcement wires market expanded from USD 487.3 million to USD 563.8 million, adding approximately USD 76.5 million in absolute value. This growth phase was driven by sustained demand from the construction, mining, and agricultural sectors, which continued to rely on high-pressure hydraulic hose assemblies for equipment reliability and performance. Manufacturers experienced moderate volume increases, supported by gradual recovery in global construction activity post-2020 disruptions.

The period also witnessed a preference for wire-reinforced thermoplastic and rubber hoses, particularly in fluid transfer systems requiring compact bend radii and enhanced pressure containment. Steel wire braiding and spiral winding technologies gained traction, with suppliers expanding capabilities for multi-layered reinforcement formats. Western Europe, China, and North America emerged as key production and consumption hubs, while supply chain stability and raw material price volatility remained areas of concern for OEMs and tiered suppliers during the early part of the decade.

Why the Hose Reinforcement Wires Market is Growing?

The hose reinforcement wires market is expanding due to increasing investments in construction equipment, agricultural machinery, and industrial fluid systems. These segments rely heavily on hydraulic hoses that require wire reinforcement to maintain structural integrity, high pressure endurance, and flexibility in demanding environments. Applications involving high mechanical loads, cyclic pressure surges, and tight routing conditions are driving the need for multi-layer braided and spiral-wound steel reinforcement formats.

Growth is also being supported by expanding infrastructure and industrial activity in Asia, Latin America, and Eastern Europe. These regions are witnessing increased deployment of hose-based systems in sectors such as energy, mining, material handling, and manufacturing.

Equipment manufacturers are actively sourcing reinforcement wires that enable hose designs with extended service life, higher temperature tolerance, and reduced weight without compromising pressure ratings. Improvements in production technologies such as precision braiding, inline quality inspection, and high-tensile wire forming are further enabling consistent supply to hose producers across global value chains.

Segmentation Overview

The hose reinforcement wires market is segmented by wire type into steel, fiberglass, plastic, and composite wires, each offering varying strength and temperature resistance profiles. Application areas include automotive, industrial, agricultural, construction, and home and garden use. Wire diameter classifications range from thin wires under 1mm to thick wires above 3mm, reflecting the pressure and flexibility requirements across hose types. Product forms include coiled, straight, and cut-length wire formats, tailored to fit production setups across global hose manufacturing operations.
Steel wires remain the preferred reinforcement type for high-pressure applications

Hose Reinforcement Wires Market By Type

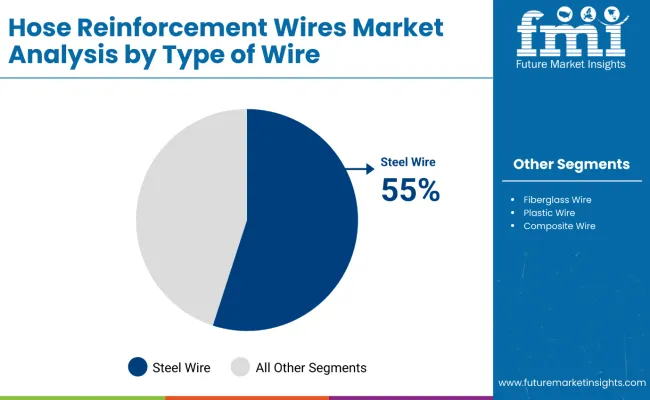
Steel wires are projected to hold 55% of the global hose reinforcement wires market in 2025 and are expected to expand at a CAGR of 3.6% through 2035. Their high tensile strength and durability make them ideal for hydraulic and industrial hoses operating under extreme pressure. These wires are widely utilized in construction machinery, agricultural equipment, and heavy vehicles where structural integrity and burst resistance are essential. The consistent mechanical performance of steel wire reinforcements continues to drive their demand across OEM and aftermarket hose production.
Automotive remains the dominant end-use segment due to high hydraulic hose consumption

Hose Reinforcement Wires Market By Application

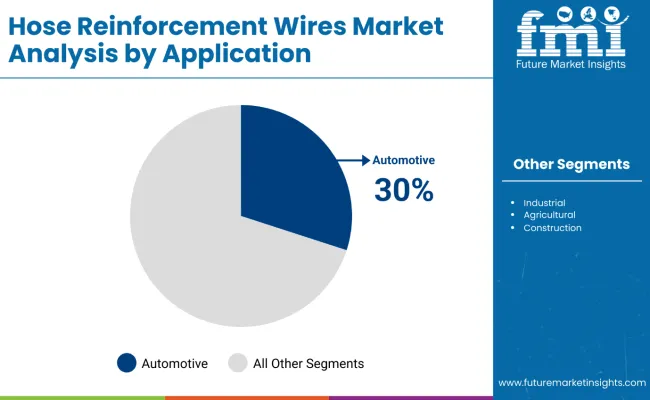
The automotive sector is estimated to account for 30% of global demand in 2025 and is forecast to grow at a CAGR of 3.8% through 2035. Hose reinforcement wires are extensively used in brake systems, power steering assemblies, and engine cooling hoses across passenger and commercial vehicles. As vehicle production continues to expand in Asia and electric vehicles integrate high-performance fluid transfer systems, demand for reinforced hose materials is expected to remain robust.
Medium-diameter wires lead due to optimal balance between strength and flexibility

Hose Reinforcement Wires Market By Wire Diameter

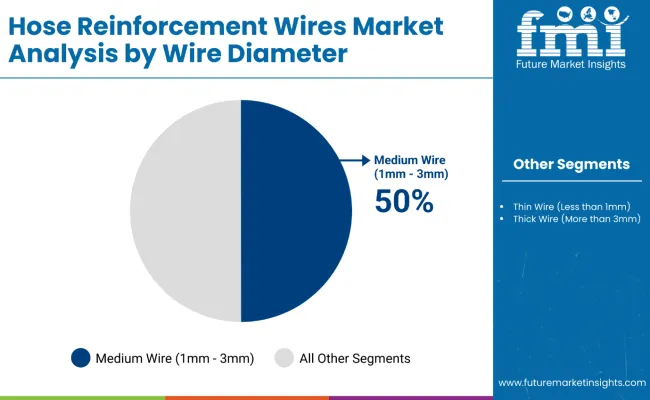
Medium wire diameters between 1mm and 3mm are projected to represent 50% of the total demand in 2025 and are likely to grow at a CAGR of 3.7% over the decade. These wires offer the necessary flexibility for hose routing while maintaining pressure resistance and fatigue life. The segment is widely adopted across industrial, automotive, and construction hoses where moderate reinforcement is required without compromising maneuverability or coilability.
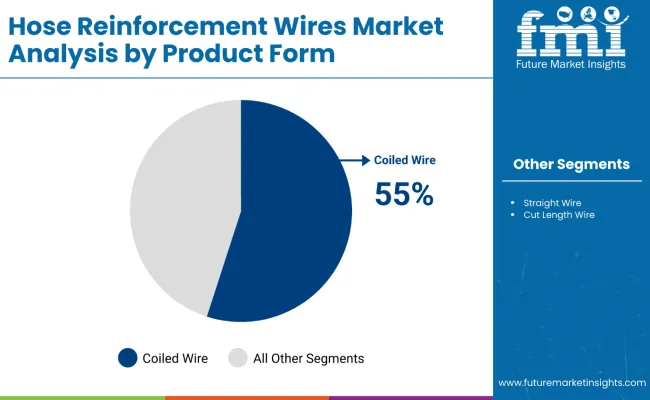
Coiled wire format dominates supply due to production efficiency and handling benefits

Hose Reinforcement Wires Market By Product

Coiled wires are estimated to make up 55% of the total product form segment in 2025 and are expected to grow at a CAGR of 3.6% through 2035. This format supports efficient bulk handling and automated feeding into braiding and spiraling machines during hose manufacturing. Coiled wires are particularly preferred in high-volume production environments, such as those serving OEM automotive hoses and industrial hydraulic assemblies.

Key Trends Shaping the Market

The hose reinforcement wires market is experiencing steady growth due to rising demand for high-pressure hose assemblies across construction, mining, agriculture, and industrial automation sectors. However, the market continues to face challenges from raw material price volatility, particularly related to high-carbon steel and alloyed wires.

Performance consistency, manufacturing complexity, and the need for compatibility with evolving hose materials remain areas of concern for suppliers. As the market matures, opportunities are emerging through product customization, region-specific hose formats, and integration of lightweight reinforcement solutions.

Hydraulic Equipment Demand is Sustaining Volume Growth

The proliferation of hydraulic machinery in infrastructure projects, agricultural mechanization, and utility services is sustaining demand for wire-reinforced hose assemblies. As OEMs require hoses capable of operating at higher pressures and in tighter configurations, multi-spiral wire reinforcement is gaining relevance. Applications such as excavators, tractors, cranes, and drilling equipment rely on steel wire reinforcement to maintain burst resistance and cyclic fatigue life, particularly in mobile systems exposed to harsh outdoor conditions.

Braiding and Spiral Technology Improvements are Enabling Product Differentiation

Technological advances in braiding machinery, die-forming, and automated coiling systems are allowing wire manufacturers to meet stringent tolerances in hose construction. The ability to produce consistent tensile strength, surface finish, and elongation profiles across wire batches is enhancing product standardization. Suppliers offering pre-treated, rust-inhibited, and low-carbon variants are gaining traction among global hose manufacturers. These process improvements are supporting the transition toward lightweight, yet high-performance reinforcement layers for compact and flexible hose systems.

Europe Market Split by Country

Countries Value Share 2025
Germany 28%
France 15%
UK 14%
Italy 10%
Spain 8%
BENELUX 7%
Russia 4%
Rest of Europe 14%
Countries Value Share 2035
Germany 26%
France 16%
UK 13%
Italy 11%
Spain 9%
BENELUX 8%
Russia 3%
Rest of Europe 14%

Germany is projected to remain the largest market for hose reinforcement wires in Europe, with a 28% share in 2025. While its share is expected to decline slightly to 26% by 2035, demand will continue to be supported by advanced manufacturing, industrial hydraulics, and automation in machinery production. The presence of leading OEMs and tiered suppliers sustains high domestic consumption of multi-layer reinforced hose solutions.

France is estimated to grow from a 15% share in 2025 to 16% by 2035, driven by investments in energy infrastructure, aerospace manufacturing, and high-pressure hydraulic systems in construction machinery. Italy and Spain are also expected to increase their shares by 1% each over the forecast period due to growth in fluid handling applications in agricultural equipment and municipal services.

BENELUX countries are set to rise from 7% to 8%, benefiting from compact automation systems and material handling equipment. Meanwhile, Russia’s share is projected to fall from 4% to 3%, impacted by trade limitations and restricted access to advanced production technologies.
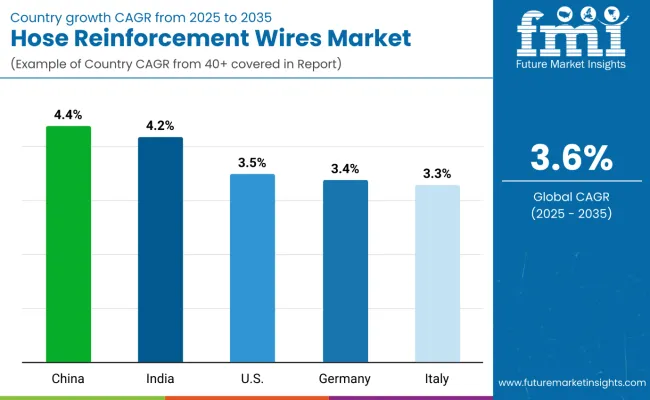
Key Countries Growth Outlook

Hose Reinforcement Wires Market By Country

China shows the fastest expansion in wire demand for hydraulic applications

China’s wire consumption is increasing in line with hydraulic hose manufacturing, supported by industrial automation and infrastructure development. Wire-reinforced hose demand is rising across construction, mining, and OEM machinery lines.

  • Growth driven by localized wire production in Hebei and Jiangsu
  • Demand from construction equipment manufacturers and high-pressure systems
  • Increased use of braided and spiral-wound wires in flexible hoses
  • OEMs investing in large-scale hydraulic equipment for roadbuilding

India to witness increasing use of reinforcement wire volumes across agriculture and mobility

India’s market is driven by growing production of hydraulic hoses for tractors, harvesters, and two-wheelers. Domestic wire manufacturing is scaling up to support low-cost hose exports.
  • Increased use in aftermarket hose assemblies in Tier II & III cities
  • Government schemes boosting demand for irrigation and power hose lines
  • Local wire mills expanding to support mid-pressure hose segment
  • Domestic OEMs pushing wire-based reinforcement for flexible applications

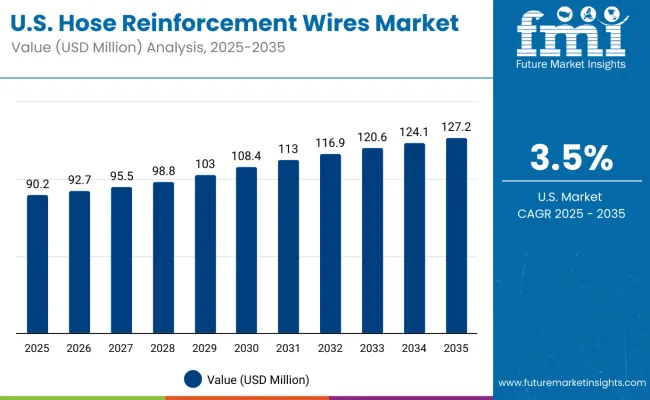
United States maintains steady demand from MRO and industrial sectors

Hose Reinforcement Wires Market Usa

Reinforcement wires are widely used in hose replacements across oil & gas, industrial hydraulics, and mobile equipment. Long-term demand is stable as capital goods see consistent uptime usage.

  • Aftermarket hose maintenance drives wire usage in drilling and logistics
  • Wire-wound hoses used in utility vehicles and municipal machinery
  • Growing use of hybrid hoses with steel wires and textile braids
  • North American wire suppliers remain competitive in quality-sensitive applications

Germany focuses on wire precision and specialty hose construction.

Germany’s wire demand is centered around precision applications in chemical plants, robotics, and smart machinery. Export-grade hose assemblies require high-quality wire input.

  • Stainless steel and carbon wire usage in custom hose construction
  • Automation systems driving demand for pressure and temperature-resistant hoses
  • European OEMs prioritizing supply chain traceability for reinforcement wires
  • Demand from construction machinery and automation equipment remains strong

Growing adoption in export-oriented hose systems to maintain demand in Italy

Italy’s market is shaped by demand from industrial hose exporters and machinery integrators. Reinforcement wires are increasingly being used in flexible hose systems for pressure washers, shipyards, and hydraulic presses.

  • Braided wire reinforcement preferred in mid-pressure applications
  • Hose manufacturers integrating lighter wire gauges for flexibility
  • High-pressure spiral wires used in energy and utility sectors
  • Demand stable in earthmoving and shipbuilding hose exports

Coiled wire leads South Korea’s reinforcement wire configurations

In South Korea, coiled wire is projected to account for 40% of hose reinforcement wire consumption in 2025, led by its compatibility with high-pressure hydraulic hose winding systems. The form is preferred by OEMs due to its ease of feeding into automated braiding lines. Straight wire follows with a 35% share, supporting mid-pressure hose applications across industrial machinery and factory automation. Cut length wires, with a 25% share, are increasingly used in precision hose fittings and repair kits.

  • Hydraulic and construction hoses drive demand for coiled wire
  • Straight wires widely used in factory-installed pressure hoses
  • Cut length wires serve niche markets like on-site maintenance assemblies
  • Wire suppliers focusing on dimensional consistency and tensile control

Japan’s reinforcement wire use dominated by automotive hoses

Japan’s application-wise demand is led by the automotive sector, representing 40% of the total market, driven by long lifecycle requirements and material integrity for brake, fuel, and AC hoses. Industrial applications account for 25%, driven by demand from factory automation and equipment exports. Construction and agricultural sectors follow at 15% and 10% respectively, while home and garden hoses also hold a consistent 10% share.
  • Automotive OEMs require high-durability wire for compact routing
  • Industrial hoses increasingly integrated with wire-wound smart sensors
  • Construction equipment hoses focus on shock and pressure resistance
  • Consumer hoses utilize lighter-gauge reinforcement for flexibility

Competition Outlook

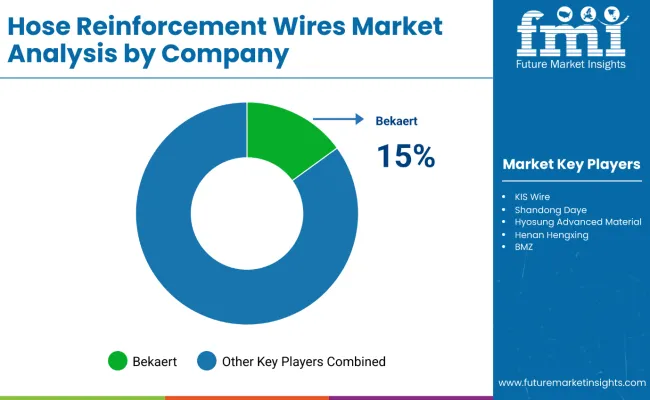
Hose Reinforcement Wires Market By Company

Competition in the hose reinforcement wires market is intensifying as manufacturers focus on expanding product portfolios and enhancing performance attributes. New wire-reinforced hoses are being introduced with higher burst pressure, improved flexibility, and compatibility with standard couplings to serve high-pressure and heavy-duty applications across construction, oil and gas, and industrial sectors. Reinforcement wires are being engineered for uniform tensile strength, superior adhesion, and suitability with rubber and thermoplastic hoses, addressing both domestic and export-oriented demand.

  • In June 2025, Jason Industrial, a subsidiary of Megadyne Group, introduced a new comprehensive hose product lineup aimed at enhancing hydraulic and industrial hose offerings for OEM and distributor clients. The launch includes expanded wire-reinforced hose ranges designed for high-pressure and heavy-duty applications. The company highlighted improvements in burst pressure ratings, flexibility, and compatibility with industry-standard couplings, catering to sectors such as construction, oil and gas, and general manufacturing.
  • In July 2025, Bansal Wire Industries announced the introduction of its latest product hose wire targeted specifically at reinforcement applications in hydraulic and industrial hoses. The company aims to tap into growing demand from domestic and export-oriented hose manufacturers. The new wire products are engineered for uniform tensile strength, improved adhesion properties, and compatibility with both rubber and thermoplastic hose constructions.

Companies

  • Bekaert
  • KIS Wire
  • Shandong Daye
  • Hyosung Advanced Material
  • Henan Hengxing
  • BMZ
  • Sunnywell
  • Sumin Metals
  • Tokyo Rope Mfg
  • Aokai Metal
  • Shougang Century
  • TOKUSEN KOGYO,
  • Gustav Wolf GmbH

Scope of the report

Item Value
Quantitative Units USD 563.8 Million (2025)
Product Form Coiled Wire, Straight Wire, Cut Length Wire
Wire Diameter Thin Wire (Less than 1mm), Medium Wire (1mm - 3mm), Thick Wire (More than 3mm)
Application Automotive, Industrial, Agricultural, Construction, Home and Garden
Regions Covered North America, Europe, East Asia, South Asia & Pacific, Latin America, Middle East & Africa
Countries Covered United States, Germany, Italy, Japan, China, South Korea
Key Companies Profiled Bekaert, Kiswire Ltd., Bridgestone Corp., Shandong Daye Co., Ltd., Zhejiang Jindun Group, Tianjin Huichi Metal Products Co., Ltd., Trefilados Inoxidables H.A. S.A., Yieh Hsing Enterprise Co., Ltd., Dongil Steel, Teufelberger Group

Key Segments

By Type of Wire:

  • Steel Wire
  • Fiberglass Wire
  • Plastic Wire
  • Composite Wire

By Application Types:

  • Automotive
  • Industrial
  • Agricultural
  • Construction
  • Home and Garden

By End-User Industry:

  • Manufacturing
  • Aerospace
  • Oil and Gas
  • Food and Beverage
  • Pharmaceutical

By Wire Diameter Types:

  • Thin Wire (Less than 1mm)
  • Medium Wire (1mm - 3mm)
  • Thick Wire (More than 3mm)

By Product Form:

  • Coiled Wire
  • Coiled Wire
  • Cut Length Wire

By Enterprise Size:

  • Large Enterprises
  • Small & Medium Sized Enterprises (SMEs)

By Region:

  • North America
  • Latin America
  • Western Europe
  • Eastern Europe
  • East Asia
  • South Asia & Pacific
  • Middle East & Africa

Table of Content

  1. Executive Summary
    • Global Market Outlook
    • Demand-side Trends
    • Supply-side Trends
    • Technology Roadmap Analysis
    • Analysis and Recommendations
  2. Market Overview
    • Market Coverage / Taxonomy
    • Market Definition / Scope / Limitations
  3. Market Background
    • Market Dynamics
      • Drivers
      • Restraints
      • Opportunity
      • Trends
    • Scenario Forecast
      • Demand in Optimistic Scenario
      • Demand in Likely Scenario
      • Demand in Conservative Scenario
    • Key Success Factors
    • Industry Developments
    • Supply Chain Analysis
      • Sourcing and Procurement
        • Raw Material / Component Suppliers
        • Technology Providers
      • Product Manufacturers
      • Channel Partners
      • End Users / Customers
    • Market Assessment Factors
      • Macro-economic Factors
      • Forecast Factors
  4. 3.10. Parent Market Outlook
  5. Global Market Analysis 2020 to 2024 and Forecast, 2025 to 2035
    • Historical Market Size Value (USD Billion) Analysis, 2020 to 2024
    • Current and Future Market Size Value (USD Billion) Projections, 2025 to 2035
      • Y-o-Y Growth Trend Analysis
      • Absolute $ Opportunity Analysis
  6. Global Market Pricing Analysis 2020 to 2024 and Forecast 2025 to 2035
  7. Global Market Analysis 2020 to 2024 and Forecast 2025 to 2035, By Type of Wire
    • Introduction / Key Findings
    • Historical Market Size Value (USD Billion) Analysis By Type of Wire, 2020 to 2024
    • Current and Future Market Size Value (USD Billion) Analysis and Forecast By Type of Wire, 2025 to 2035
      • Steel Wire
      • Fiberglass Wire
      • Plastic Wire
      • Composite Wire
    • Y-o-Y Growth Trend Analysis By Type of Wire, 2020 to 2024
    • Absolute $ Opportunity Analysis By Type of Wire, 2025 to 2035
  8. Global Market Analysis 2020 to 2024 and Forecast 2025 to 2035, By Application Types
    • Introduction / Key Findings
    • Historical Market Size Value (USD Billion) Analysis By Application Types , 2020 to 2024
    • Current and Future Market Size Value (USD Billion) Analysis and Forecast By Application Types , 2025 to 2035
      • Automotive
      • Industrial
      • Agricultural
      • Construction
      • Home and Garden
    • Y-o-Y Growth Trend Analysis By Application Types , 2020 to 2024
    • Absolute $ Opportunity Analysis By Application Types , 2025 to 2035
  9. Global Market Analysis 2020 to 2024 and Forecast 2025 to 2035, By End-User Industry
    • Introduction / Key Findings
    • Historical Market Size Value (USD Billion) Analysis By End-User Industry, 2020 to 2024
    • Current and Future Market Size Value (USD Billion) Analysis and Forecast By End-User Industry, 2025 to 2035
      • Manufacturing
      • Aerospace
      • Oil and Gas
      • Food and Beverage
      • Pharmaceutical
    • Y-o-Y Growth Trend Analysis By End-User Industry, 2020 to 2024
    • Absolute $ Opportunity Analysis By End-User Industry, 2025 to 2035
  10. Global Market Analysis 2020 to 2024 and Forecast 2025 to 2035, By Wire Diameter Types
    • Introduction / Key Findings
    • Historical Market Size Value (USD Billion) Analysis By Wire Diameter Types , 2020 to 2024
    • Current and Future Market Size Value (USD Billion) Analysis and Forecast By Wire Diameter Types , 2025 to 2035
      • Thin Wire (Less than 1mm)
      • Medium Wire (1mm - 3mm)
      • Thick Wire (More than 3mm)
    • Y-o-Y Growth Trend Analysis By Wire Diameter Types , 2020 to 2024
    • Absolute $ Opportunity Analysis By Wire Diameter Types , 2025 to 2035
  11. Global Market Analysis 2020 to 2024 and Forecast 2025 to 2035, By Product Form
    • Introduction / Key Findings
    • Historical Market Size Value (USD Billion) Analysis By Product Form , 2020 to 2024
    • Current and Future Market Size Value (USD Billion) Analysis and Forecast By Product Form , 2025 to 2035
      • Coiled Wire
      • Coiled Wire
      • Cut Length Wire
    • Y-o-Y Growth Trend Analysis By Product Form , 2020 to 2024
    • Absolute $ Opportunity Analysis By Product Form , 2025 to 2035
  12. Global Market Analysis 2020 to 2024 and Forecast 2025 to 2035, By Enterprise Size
    • Introduction / Key Findings
    • Historical Market Size Value (USD Billion) Analysis By Enterprise Size , 2020 to 2024
    • Current and Future Market Size Value (USD Billion) Analysis and Forecast By Enterprise Size , 2025 to 2035
      • Large Enterprises
      • Small & Medium Sized Enterprises (SMEs)
    • Y-o-Y Growth Trend Analysis By Enterprise Size , 2020 to 2024
    • Absolute $ Opportunity Analysis By Enterprise Size , 2025 to 2035
  13. Global Market Analysis 2020 to 2024 and Forecast 2025 to 2035, By Region
    • Introduction
    • Historical Market Size Value (USD Billion) Analysis By Region, 2020 to 2024
    • Current Market Size Value (USD Billion) Analysis and Forecast By Region, 2025 to 2035
      • North America
      • Latin America
      • Western Europe
      • Eastern Europe
      • East Asia
      • South Asia & Pacific
      • Middle East & Africa
    • Market Attractiveness Analysis By Region
  14. North America Market Analysis 2020 to 2024 and Forecast 2025 to 2035, By Country
    • Historical Market Size Value (USD Billion) Trend Analysis By Market Taxonomy, 2020 to 2024
    • Market Size Value (USD Billion) Forecast By Market Taxonomy, 2025 to 2035
      • By Country
        • USA
        • Canada
        • Mexico
      • By Type of Wire
      • By Application Types
      • By End-User Industry
      • By Wire Diameter Types
      • By Product Form
      • By Enterprise Size
    • Market Attractiveness Analysis
      • By Country
      • By Type of Wire
      • By Application Types
      • By End-User Industry
      • By Wire Diameter Types
      • By Product Form
      • By Enterprise Size
    • Key Takeaways
  15. Latin America Market Analysis 2020 to 2024 and Forecast 2025 to 2035, By Country
    • Historical Market Size Value (USD Billion) Trend Analysis By Market Taxonomy, 2020 to 2024
    • Market Size Value (USD Billion) Forecast By Market Taxonomy, 2025 to 2035
      • By Country
        • Brazil
        • Argentina
        • Rest of Latin America
      • By Type of Wire
      • By Application Types
      • By End-User Industry
      • By Wire Diameter Types
      • By Product Form
      • By Enterprise Size
    • Market Attractiveness Analysis
      • By Country
      • By Type of Wire
      • By Application Types
      • By End-User Industry
      • By Wire Diameter Types
      • By Product Form
      • By Enterprise Size
    • Key Takeaways
  16. Western Europe Market Analysis 2020 to 2024 and Forecast 2025 to 2035, By Country
    • Historical Market Size Value (USD Billion) Trend Analysis By Market Taxonomy, 2020 to 2024
    • Market Size Value (USD Billion) Forecast By Market Taxonomy, 2025 to 2035
      • By Country
        • Germany
        • Italy
        • France
        • UK
        • Spain
        • BENELUX
        • Nordics
        • Rest of W. Europe
      • By Type of Wire
      • By Application Types
      • By End-User Industry
      • By Wire Diameter Types
      • By Product Form
      • By Enterprise Size
    • Market Attractiveness Analysis
      • By Country
      • By Type of Wire
      • By Application Types
      • By End-User Industry
      • By Wire Diameter Types
      • By Product Form
      • By Enterprise Size
    • Key Takeaways
  17. Eastern Europe Market Analysis 2020 to 2024 and Forecast 2025 to 2035, By Country
    • Historical Market Size Value (USD Billion) Trend Analysis By Market Taxonomy, 2020 to 2024
    • Market Size Value (USD Billion) Forecast By Market Taxonomy, 2025 to 2035
      • By Country
        • Hungary
        • Poland
        • Russia
        • Balkan & Baltics
        • Rest of E.Europe
      • By Type of Wire
      • By Application Types
      • By End-User Industry
      • By Wire Diameter Types
      • By Product Form
      • By Enterprise Size
    • Market Attractiveness Analysis
      • By Country
      • By Type of Wire
      • By Application Types
      • By End-User Industry
      • By Wire Diameter Types
      • By Product Form
      • By Enterprise Size
    • Key Takeaways
  18. East Asia Market Analysis 2020 to 2024 and Forecast 2025 to 2035, By Country
    • Historical Market Size Value (USD Billion) Trend Analysis By Market Taxonomy, 2020 to 2024
    • Market Size Value (USD Billion) Forecast By Market Taxonomy, 2025 to 2035
      • By Country
        • China
        • Japan
        • South Korea
      • By Type of Wire
      • By Application Types
      • By End-User Industry
      • By Wire Diameter Types
      • By Product Form
      • By Enterprise Size
    • Market Attractiveness Analysis
      • By Country
      • By Type of Wire
      • By Application Types
      • By End-User Industry
      • By Wire Diameter Types
      • By Product Form
      • By Enterprise Size
    • Key Takeaways
  19. South Asia & Pacific Market Analysis 2020 to 2024 and Forecast 2025 to 2035, By Country
    • Historical Market Size Value (USD Billion) Trend Analysis By Market Taxonomy, 2020 to 2024
    • Market Size Value (USD Billion) Forecast By Market Taxonomy, 2025 to 2035
      • By Country
        • India
        • ASEAN
        • Australia & New Zealand
      • By Type of Wire
      • By Application Types
      • By End-User Industry
      • By Wire Diameter Types
      • By Product Form
      • By Enterprise Size
    • Market Attractiveness Analysis
      • By Country
      • By Type of Wire
      • By Application Types
      • By End-User Industry
      • By Wire Diameter Types
      • By Product Form
      • By Enterprise Size
    • Key Takeaways
  20. Middle East & Africa Market Analysis 2020 to 2024 and Forecast 2025 to 2035, By Country
    • Historical Market Size Value (USD Billion) Trend Analysis By Market Taxonomy, 2020 to 2024
    • Market Size Value (USD Billion) Forecast By Market Taxonomy, 2025 to 2035
      • By Country
        • GCC Countries
        • Turkiye
        • Northern Africa
        • South Africa
        • Rest of MEA
      • By Type of Wire
      • By Application Types
      • By End-User Industry
      • By Wire Diameter Types
      • By Product Form
      • By Enterprise Size
    • Market Attractiveness Analysis
      • By Country
      • By Type of Wire
      • By Application Types
      • By End-User Industry
      • By Wire Diameter Types
      • By Product Form
      • By Enterprise Size
    • Key Takeaways
  21. Key Countries Market Analysis
    • USA
      • Pricing Analysis
      • Market Share Analysis, 2024
        • By Type of Wire
        • By Application Types
        • By End-User Industry
        • By Wire Diameter Types
        • By Product Form
        • By Enterprise Size
    • Canada
      • Pricing Analysis
      • Market Share Analysis, 2024
        • By Type of Wire
        • By Application Types
        • By End-User Industry
        • By Wire Diameter Types
        • By Product Form
        • By Enterprise Size
    • Mexico
      • Pricing Analysis
      • Market Share Analysis, 2024
        • By Type of Wire
        • By Application Types
        • By End-User Industry
        • By Wire Diameter Types
        • By Product Form
        • By Enterprise Size
    • Brazil
      • Pricing Analysis
      • Market Share Analysis, 2024
        • By Type of Wire
        • By Application Types
        • By End-User Industry
        • By Wire Diameter Types
        • By Product Form
        • By Enterprise Size
    • Argentina
      • Pricing Analysis
      • Market Share Analysis, 2024
        • By Type of Wire
        • By Application Types
        • By End-User Industry
        • By Wire Diameter Types
        • By Product Form
        • By Enterprise Size
    • Germany
      • Pricing Analysis
      • Market Share Analysis, 2024
        • By Type of Wire
        • By Application Types
        • By End-User Industry
        • By Wire Diameter Types
        • By Product Form
        • By Enterprise Size
    • Italy
      • Pricing Analysis
      • Market Share Analysis, 2024
        • By Type of Wire
        • By Application Types
        • By End-User Industry
        • By Wire Diameter Types
        • By Product Form
        • By Enterprise Size
    • France
      • Pricing Analysis
      • Market Share Analysis, 2024
        • By Type of Wire
        • By Application Types
        • By End-User Industry
        • By Wire Diameter Types
        • By Product Form
        • By Enterprise Size
    • UK
      • Pricing Analysis
      • Market Share Analysis, 2024
        • By Type of Wire
        • By Application Types
        • By End-User Industry
        • By Wire Diameter Types
        • By Product Form
        • By Enterprise Size
    • Spain
      • Pricing Analysis
      • Market Share Analysis, 2024
        • By Type of Wire
        • By Application Types
        • By End-User Industry
        • By Wire Diameter Types
        • By Product Form
        • By Enterprise Size
    • BENELUX
      • Pricing Analysis
      • Market Share Analysis, 2024
        • By Type of Wire
        • By Application Types
        • By End-User Industry
        • By Wire Diameter Types
        • By Product Form
        • By Enterprise Size
    • Nordics
      • Pricing Analysis
      • Market Share Analysis, 2024
        • By Type of Wire
        • By Application Types
        • By End-User Industry
        • By Wire Diameter Types
        • By Product Form
        • By Enterprise Size
    • Russia
      • Pricing Analysis
      • Market Share Analysis, 2024
        • By Type of Wire
        • By Application Types
        • By End-User Industry
        • By Wire Diameter Types
        • By Product Form
        • By Enterprise Size
    • Hungary
      • Pricing Analysis
      • Market Share Analysis, 2024
        • By Type of Wire
        • By Application Types
        • By End-User Industry
        • By Wire Diameter Types
        • By Product Form
        • By Enterprise Size
    • Poland
      • Pricing Analysis
      • Market Share Analysis, 2024
        • By Type of Wire
        • By Application Types
        • By End-User Industry
        • By Wire Diameter Types
        • By Product Form
        • By Enterprise Size
    • Balkan & Baltics
      • Pricing Analysis
      • Market Share Analysis, 2024
        • By Type of Wire
        • By Application Types
        • By End-User Industry
        • By Wire Diameter Types
        • By Product Form
        • By Enterprise Size
    • China
      • Pricing Analysis
      • Market Share Analysis, 2024
        • By Type of Wire
        • By Application Types
        • By End-User Industry
        • By Wire Diameter Types
        • By Product Form
        • By Enterprise Size
    • Japan
      • Pricing Analysis
      • Market Share Analysis, 2024
        • By Type of Wire
        • By Application Types
        • By End-User Industry
        • By Wire Diameter Types
        • By Product Form
        • By Enterprise Size
    • South Korea
      • Pricing Analysis
      • Market Share Analysis, 2024
        • By Type of Wire
        • By Application Types
        • By End-User Industry
        • By Wire Diameter Types
        • By Product Form
        • By Enterprise Size
    • India
      • Pricing Analysis
      • Market Share Analysis, 2024
        • By Type of Wire
        • By Application Types
        • By End-User Industry
        • By Wire Diameter Types
        • By Product Form
        • By Enterprise Size
    • ASEAN
      • Pricing Analysis
      • Market Share Analysis, 2024
        • By Type of Wire
        • By Application Types
        • By End-User Industry
        • By Wire Diameter Types
        • By Product Form
        • By Enterprise Size
    • Australia & New Zealand
      • Pricing Analysis
      • Market Share Analysis, 2024
        • By Type of Wire
        • By Application Types
        • By End-User Industry
        • By Wire Diameter Types
        • By Product Form
        • By Enterprise Size
    • GCC Countries
      • Pricing Analysis
      • Market Share Analysis, 2024
        • By Type of Wire
        • By Application Types
        • By End-User Industry
        • By Wire Diameter Types
        • By Product Form
        • By Enterprise Size
    • Turkiye
      • Pricing Analysis
      • Market Share Analysis, 2024
        • By Type of Wire
        • By Application Types
        • By End-User Industry
        • By Wire Diameter Types
        • By Product Form
        • By Enterprise Size
    • Northern Africa
      • Pricing Analysis
      • Market Share Analysis, 2024
        • By Type of Wire
        • By Application Types
        • By End-User Industry
        • By Wire Diameter Types
        • By Product Form
        • By Enterprise Size
    • South Africa
      • Pricing Analysis
      • Market Share Analysis, 2024
        • By Type of Wire
        • By Application Types
        • By End-User Industry
        • By Wire Diameter Types
        • By Product Form
        • By Enterprise Size
  22. Market Structure Analysis
    • Competition Dashboard
    • Competition Benchmarking
    • Market Share Analysis of Top Players
      • By Regional
      • By Type of Wire
      • By Application Types
      • By End-User Industry
      • By Wire Diameter Types
      • By Product Form
      • By Enterprise Size
  23. Competition Analysis
    • Competition Deep Dive
      • Bekaert
        • Overview
        • Product Portfolio
        • Profitability by Market Segments
        • Sales Footprint
        • Strategy Overview
      • KIS Wire
        • Overview
        • Product Portfolio
        • Profitability by Market Segments
        • Sales Footprint
        • Strategy Overview
      • Shandong Daye
        • Overview
        • Product Portfolio
        • Profitability by Market Segments
        • Sales Footprint
        • Strategy Overview
      • Hyosung Advanced Material
        • Overview
        • Product Portfolio
        • Profitability by Market Segments
        • Sales Footprint
        • Strategy Overview
      • Henan Hengxing
        • Overview
        • Product Portfolio
        • Profitability by Market Segments
        • Sales Footprint
        • Strategy Overview
      • BMZ
        • Overview
        • Product Portfolio
        • Profitability by Market Segments
        • Sales Footprint
        • Strategy Overview
      • Sunnywell
        • Overview
        • Product Portfolio
        • Profitability by Market Segments
        • Sales Footprint
        • Strategy Overview
      • Sumin Metals
        • Overview
        • Product Portfolio
        • Profitability by Market Segments
        • Sales Footprint
        • Strategy Overview
      • Tokyo Rope Mfg
        • Overview
        • Product Portfolio
        • Profitability by Market Segments
        • Sales Footprint
        • Strategy Overview
      • Aokai Metal
        • Overview
        • Product Portfolio
        • Profitability by Market Segments
        • Sales Footprint
        • Strategy Overview
      • Shougang Century
        • Overview
        • Product Portfolio
        • Profitability by Market Segments
        • Sales Footprint
        • Strategy Overview
      • TOKUSEN KOGYO,
        • Overview
        • Product Portfolio
        • Profitability by Market Segments
        • Sales Footprint
        • Strategy Overview
      • Gustav Wolf GmbH
        • Overview
        • Product Portfolio
        • Profitability by Market Segments
        • Sales Footprint
        • Strategy Overview
  24. Assumptions & Acronyms Used
  25. Research Methodology

List of Tables

  • Table 1: Global Market Value (USD Billion) Forecast by Region, 2020-2035
  • Table 2: Global Market Value (USD Billion) Forecast by Type of Wire, 2020-2035
  • Table 3: Global Market Value (USD Billion) Forecast by Application Types , 2020-2035
  • Table 4: Global Market Value (USD Billion) Forecast by End-User Industry, 2020-2035
  • Table 5: Global Market Value (USD Billion) Forecast by Wire Diameter Types , 2020-2035
  • Table 6: Global Market Value (USD Billion) Forecast by Product Form , 2020-2035
  • Table 7: Global Market Value (USD Billion) Forecast by Enterprise Size , 2020-2035
  • Table 8: North America Market Value (USD Billion) Forecast by Country, 2020-2035
  • Table 9: North America Market Value (USD Billion) Forecast by Type of Wire, 2020-2035
  • Table 10: North America Market Value (USD Billion) Forecast by Application Types , 2020-2035
  • Table 11: North America Market Value (USD Billion) Forecast by End-User Industry, 2020-2035
  • Table 12: North America Market Value (USD Billion) Forecast by Wire Diameter Types , 2020-2035
  • Table 13: North America Market Value (USD Billion) Forecast by Product Form , 2020-2035
  • Table 14: North America Market Value (USD Billion) Forecast by Enterprise Size , 2020-2035
  • Table 15: Latin America Market Value (USD Billion) Forecast by Country, 2020-2035
  • Table 16: Latin America Market Value (USD Billion) Forecast by Type of Wire, 2020-2035
  • Table 17: Latin America Market Value (USD Billion) Forecast by Application Types , 2020-2035
  • Table 18: Latin America Market Value (USD Billion) Forecast by End-User Industry, 2020-2035
  • Table 19: Latin America Market Value (USD Billion) Forecast by Wire Diameter Types , 2020-2035
  • Table 20: Latin America Market Value (USD Billion) Forecast by Product Form , 2020-2035
  • Table 21: Latin America Market Value (USD Billion) Forecast by Enterprise Size , 2020-2035
  • Table 22: Western Europe Market Value (USD Billion) Forecast by Country, 2020-2035
  • Table 23: Western Europe Market Value (USD Billion) Forecast by Type of Wire, 2020-2035
  • Table 24: Western Europe Market Value (USD Billion) Forecast by Application Types , 2020-2035
  • Table 25: Western Europe Market Value (USD Billion) Forecast by End-User Industry, 2020-2035
  • Table 26: Western Europe Market Value (USD Billion) Forecast by Wire Diameter Types , 2020-2035
  • Table 27: Western Europe Market Value (USD Billion) Forecast by Product Form , 2020-2035
  • Table 28: Western Europe Market Value (USD Billion) Forecast by Enterprise Size , 2020-2035
  • Table 29: Eastern Europe Market Value (USD Billion) Forecast by Country, 2020-2035
  • Table 30: Eastern Europe Market Value (USD Billion) Forecast by Type of Wire, 2020-2035
  • Table 31: Eastern Europe Market Value (USD Billion) Forecast by Application Types , 2020-2035
  • Table 32: Eastern Europe Market Value (USD Billion) Forecast by End-User Industry, 2020-2035
  • Table 33: Eastern Europe Market Value (USD Billion) Forecast by Wire Diameter Types , 2020-2035
  • Table 34: Eastern Europe Market Value (USD Billion) Forecast by Product Form , 2020-2035
  • Table 35: Eastern Europe Market Value (USD Billion) Forecast by Enterprise Size , 2020-2035
  • Table 36: East Asia Market Value (USD Billion) Forecast by Country, 2020-2035
  • Table 37: East Asia Market Value (USD Billion) Forecast by Type of Wire, 2020-2035
  • Table 38: East Asia Market Value (USD Billion) Forecast by Application Types , 2020-2035
  • Table 39: East Asia Market Value (USD Billion) Forecast by End-User Industry, 2020-2035
  • Table 40: East Asia Market Value (USD Billion) Forecast by Wire Diameter Types , 2020-2035
  • Table 41: East Asia Market Value (USD Billion) Forecast by Product Form , 2020-2035
  • Table 42: East Asia Market Value (USD Billion) Forecast by Enterprise Size , 2020-2035
  • Table 43: South Asia & Pacific Market Value (USD Billion) Forecast by Country, 2020-2035
  • Table 44: South Asia & Pacific Market Value (USD Billion) Forecast by Type of Wire, 2020-2035
  • Table 45: South Asia & Pacific Market Value (USD Billion) Forecast by Application Types , 2020-2035
  • Table 46: South Asia & Pacific Market Value (USD Billion) Forecast by End-User Industry, 2020-2035
  • Table 47: South Asia & Pacific Market Value (USD Billion) Forecast by Wire Diameter Types , 2020-2035
  • Table 48: South Asia & Pacific Market Value (USD Billion) Forecast by Product Form , 2020-2035
  • Table 49: South Asia & Pacific Market Value (USD Billion) Forecast by Enterprise Size , 2020-2035
  • Table 50: Middle East & Africa Market Value (USD Billion) Forecast by Country, 2020-2035
  • Table 51: Middle East & Africa Market Value (USD Billion) Forecast by Type of Wire, 2020-2035
  • Table 52: Middle East & Africa Market Value (USD Billion) Forecast by Application Types , 2020-2035
  • Table 53: Middle East & Africa Market Value (USD Billion) Forecast by End-User Industry, 2020-2035
  • Table 54: Middle East & Africa Market Value (USD Billion) Forecast by Wire Diameter Types , 2020-2035
  • Table 55: Middle East & Africa Market Value (USD Billion) Forecast by Product Form , 2020-2035
  • Table 56: Middle East & Africa Market Value (USD Billion) Forecast by Enterprise Size , 2020-2035

List of Figures

  • Figure 1: Global Market Pricing Analysis
  • Figure 2: Global Market Value (USD Billion) Forecast 2020-2035
  • Figure 3: Global Market Value Share and BPS Analysis by Type of Wire, 2025 and 2035
  • Figure 4: Global Market Y-o-Y Growth Comparison by Type of Wire, 2025-2035
  • Figure 5: Global Market Attractiveness Analysis by Type of Wire
  • Figure 6: Global Market Value Share and BPS Analysis by Application Types , 2025 and 2035
  • Figure 7: Global Market Y-o-Y Growth Comparison by Application Types , 2025-2035
  • Figure 8: Global Market Attractiveness Analysis by Application Types
  • Figure 9: Global Market Value Share and BPS Analysis by End-User Industry, 2025 and 2035
  • Figure 10: Global Market Y-o-Y Growth Comparison by End-User Industry, 2025-2035
  • Figure 11: Global Market Attractiveness Analysis by End-User Industry
  • Figure 12: Global Market Value Share and BPS Analysis by Wire Diameter Types , 2025 and 2035
  • Figure 13: Global Market Y-o-Y Growth Comparison by Wire Diameter Types , 2025-2035
  • Figure 14: Global Market Attractiveness Analysis by Wire Diameter Types
  • Figure 15: Global Market Value Share and BPS Analysis by Product Form , 2025 and 2035
  • Figure 16: Global Market Y-o-Y Growth Comparison by Product Form , 2025-2035
  • Figure 17: Global Market Attractiveness Analysis by Product Form
  • Figure 18: Global Market Value Share and BPS Analysis by Enterprise Size , 2025 and 2035
  • Figure 19: Global Market Y-o-Y Growth Comparison by Enterprise Size , 2025-2035
  • Figure 20: Global Market Attractiveness Analysis by Enterprise Size
  • Figure 21: Global Market Value (USD Billion) Share and BPS Analysis by Region, 2025 and 2035
  • Figure 22: Global Market Y-o-Y Growth Comparison by Region, 2025-2035
  • Figure 23: Global Market Attractiveness Analysis by Region
  • Figure 24: North America Market Incremental $ Opportunity, 2025-2035
  • Figure 25: Latin America Market Incremental $ Opportunity, 2025-2035
  • Figure 26: Western Europe Market Incremental $ Opportunity, 2025-2035
  • Figure 27: Eastern Europe Market Incremental $ Opportunity, 2025-2035
  • Figure 28: East Asia Market Incremental $ Opportunity, 2025-2035
  • Figure 29: South Asia & Pacific Market Incremental $ Opportunity, 2025-2035
  • Figure 30: Middle East & Africa Market Incremental $ Opportunity, 2025-2035
  • Figure 31: North America Market Value Share and BPS Analysis by Country, 2025 and 2035
  • Figure 32: North America Market Value Share and BPS Analysis by Type of Wire, 2025 and 2035
  • Figure 33: North America Market Y-o-Y Growth Comparison by Type of Wire, 2025-2035
  • Figure 34: North America Market Attractiveness Analysis by Type of Wire
  • Figure 35: North America Market Value Share and BPS Analysis by Application Types , 2025 and 2035
  • Figure 36: North America Market Y-o-Y Growth Comparison by Application Types , 2025-2035
  • Figure 37: North America Market Attractiveness Analysis by Application Types
  • Figure 38: North America Market Value Share and BPS Analysis by End-User Industry, 2025 and 2035
  • Figure 39: North America Market Y-o-Y Growth Comparison by End-User Industry, 2025-2035
  • Figure 40: North America Market Attractiveness Analysis by End-User Industry
  • Figure 41: North America Market Value Share and BPS Analysis by Wire Diameter Types , 2025 and 2035
  • Figure 42: North America Market Y-o-Y Growth Comparison by Wire Diameter Types , 2025-2035
  • Figure 43: North America Market Attractiveness Analysis by Wire Diameter Types
  • Figure 44: North America Market Value Share and BPS Analysis by Product Form , 2025 and 2035
  • Figure 45: North America Market Y-o-Y Growth Comparison by Product Form , 2025-2035
  • Figure 46: North America Market Attractiveness Analysis by Product Form
  • Figure 47: North America Market Value Share and BPS Analysis by Enterprise Size , 2025 and 2035
  • Figure 48: North America Market Y-o-Y Growth Comparison by Enterprise Size , 2025-2035
  • Figure 49: North America Market Attractiveness Analysis by Enterprise Size
  • Figure 50: Latin America Market Value Share and BPS Analysis by Country, 2025 and 2035
  • Figure 51: Latin America Market Value Share and BPS Analysis by Type of Wire, 2025 and 2035
  • Figure 52: Latin America Market Y-o-Y Growth Comparison by Type of Wire, 2025-2035
  • Figure 53: Latin America Market Attractiveness Analysis by Type of Wire
  • Figure 54: Latin America Market Value Share and BPS Analysis by Application Types , 2025 and 2035
  • Figure 55: Latin America Market Y-o-Y Growth Comparison by Application Types , 2025-2035
  • Figure 56: Latin America Market Attractiveness Analysis by Application Types
  • Figure 57: Latin America Market Value Share and BPS Analysis by End-User Industry, 2025 and 2035
  • Figure 58: Latin America Market Y-o-Y Growth Comparison by End-User Industry, 2025-2035
  • Figure 59: Latin America Market Attractiveness Analysis by End-User Industry
  • Figure 60: Latin America Market Value Share and BPS Analysis by Wire Diameter Types , 2025 and 2035
  • Figure 61: Latin America Market Y-o-Y Growth Comparison by Wire Diameter Types , 2025-2035
  • Figure 62: Latin America Market Attractiveness Analysis by Wire Diameter Types
  • Figure 63: Latin America Market Value Share and BPS Analysis by Product Form , 2025 and 2035
  • Figure 64: Latin America Market Y-o-Y Growth Comparison by Product Form , 2025-2035
  • Figure 65: Latin America Market Attractiveness Analysis by Product Form
  • Figure 66: Latin America Market Value Share and BPS Analysis by Enterprise Size , 2025 and 2035
  • Figure 67: Latin America Market Y-o-Y Growth Comparison by Enterprise Size , 2025-2035
  • Figure 68: Latin America Market Attractiveness Analysis by Enterprise Size
  • Figure 69: Western Europe Market Value Share and BPS Analysis by Country, 2025 and 2035
  • Figure 70: Western Europe Market Value Share and BPS Analysis by Type of Wire, 2025 and 2035
  • Figure 71: Western Europe Market Y-o-Y Growth Comparison by Type of Wire, 2025-2035
  • Figure 72: Western Europe Market Attractiveness Analysis by Type of Wire
  • Figure 73: Western Europe Market Value Share and BPS Analysis by Application Types , 2025 and 2035
  • Figure 74: Western Europe Market Y-o-Y Growth Comparison by Application Types , 2025-2035
  • Figure 75: Western Europe Market Attractiveness Analysis by Application Types
  • Figure 76: Western Europe Market Value Share and BPS Analysis by End-User Industry, 2025 and 2035
  • Figure 77: Western Europe Market Y-o-Y Growth Comparison by End-User Industry, 2025-2035
  • Figure 78: Western Europe Market Attractiveness Analysis by End-User Industry
  • Figure 79: Western Europe Market Value Share and BPS Analysis by Wire Diameter Types , 2025 and 2035
  • Figure 80: Western Europe Market Y-o-Y Growth Comparison by Wire Diameter Types , 2025-2035
  • Figure 81: Western Europe Market Attractiveness Analysis by Wire Diameter Types
  • Figure 82: Western Europe Market Value Share and BPS Analysis by Product Form , 2025 and 2035
  • Figure 83: Western Europe Market Y-o-Y Growth Comparison by Product Form , 2025-2035
  • Figure 84: Western Europe Market Attractiveness Analysis by Product Form
  • Figure 85: Western Europe Market Value Share and BPS Analysis by Enterprise Size , 2025 and 2035
  • Figure 86: Western Europe Market Y-o-Y Growth Comparison by Enterprise Size , 2025-2035
  • Figure 87: Western Europe Market Attractiveness Analysis by Enterprise Size
  • Figure 88: Eastern Europe Market Value Share and BPS Analysis by Country, 2025 and 2035
  • Figure 89: Eastern Europe Market Value Share and BPS Analysis by Type of Wire, 2025 and 2035
  • Figure 90: Eastern Europe Market Y-o-Y Growth Comparison by Type of Wire, 2025-2035
  • Figure 91: Eastern Europe Market Attractiveness Analysis by Type of Wire
  • Figure 92: Eastern Europe Market Value Share and BPS Analysis by Application Types , 2025 and 2035
  • Figure 93: Eastern Europe Market Y-o-Y Growth Comparison by Application Types , 2025-2035
  • Figure 94: Eastern Europe Market Attractiveness Analysis by Application Types
  • Figure 95: Eastern Europe Market Value Share and BPS Analysis by End-User Industry, 2025 and 2035
  • Figure 96: Eastern Europe Market Y-o-Y Growth Comparison by End-User Industry, 2025-2035
  • Figure 97: Eastern Europe Market Attractiveness Analysis by End-User Industry
  • Figure 98: Eastern Europe Market Value Share and BPS Analysis by Wire Diameter Types , 2025 and 2035
  • Figure 99: Eastern Europe Market Y-o-Y Growth Comparison by Wire Diameter Types , 2025-2035
  • Figure 100: Eastern Europe Market Attractiveness Analysis by Wire Diameter Types
  • Figure 101: Eastern Europe Market Value Share and BPS Analysis by Product Form , 2025 and 2035
  • Figure 102: Eastern Europe Market Y-o-Y Growth Comparison by Product Form , 2025-2035
  • Figure 103: Eastern Europe Market Attractiveness Analysis by Product Form
  • Figure 104: Eastern Europe Market Value Share and BPS Analysis by Enterprise Size , 2025 and 2035
  • Figure 105: Eastern Europe Market Y-o-Y Growth Comparison by Enterprise Size , 2025-2035
  • Figure 106: Eastern Europe Market Attractiveness Analysis by Enterprise Size
  • Figure 107: East Asia Market Value Share and BPS Analysis by Country, 2025 and 2035
  • Figure 108: East Asia Market Value Share and BPS Analysis by Type of Wire, 2025 and 2035
  • Figure 109: East Asia Market Y-o-Y Growth Comparison by Type of Wire, 2025-2035
  • Figure 110: East Asia Market Attractiveness Analysis by Type of Wire
  • Figure 111: East Asia Market Value Share and BPS Analysis by Application Types , 2025 and 2035
  • Figure 112: East Asia Market Y-o-Y Growth Comparison by Application Types , 2025-2035
  • Figure 113: East Asia Market Attractiveness Analysis by Application Types
  • Figure 114: East Asia Market Value Share and BPS Analysis by End-User Industry, 2025 and 2035
  • Figure 115: East Asia Market Y-o-Y Growth Comparison by End-User Industry, 2025-2035
  • Figure 116: East Asia Market Attractiveness Analysis by End-User Industry
  • Figure 117: East Asia Market Value Share and BPS Analysis by Wire Diameter Types , 2025 and 2035
  • Figure 118: East Asia Market Y-o-Y Growth Comparison by Wire Diameter Types , 2025-2035
  • Figure 119: East Asia Market Attractiveness Analysis by Wire Diameter Types
  • Figure 120: East Asia Market Value Share and BPS Analysis by Product Form , 2025 and 2035
  • Figure 121: East Asia Market Y-o-Y Growth Comparison by Product Form , 2025-2035
  • Figure 122: East Asia Market Attractiveness Analysis by Product Form
  • Figure 123: East Asia Market Value Share and BPS Analysis by Enterprise Size , 2025 and 2035
  • Figure 124: East Asia Market Y-o-Y Growth Comparison by Enterprise Size , 2025-2035
  • Figure 125: East Asia Market Attractiveness Analysis by Enterprise Size
  • Figure 126: South Asia & Pacific Market Value Share and BPS Analysis by Country, 2025 and 2035
  • Figure 127: South Asia & Pacific Market Value Share and BPS Analysis by Type of Wire, 2025 and 2035
  • Figure 128: South Asia & Pacific Market Y-o-Y Growth Comparison by Type of Wire, 2025-2035
  • Figure 129: South Asia & Pacific Market Attractiveness Analysis by Type of Wire
  • Figure 130: South Asia & Pacific Market Value Share and BPS Analysis by Application Types , 2025 and 2035
  • Figure 131: South Asia & Pacific Market Y-o-Y Growth Comparison by Application Types , 2025-2035
  • Figure 132: South Asia & Pacific Market Attractiveness Analysis by Application Types
  • Figure 133: South Asia & Pacific Market Value Share and BPS Analysis by End-User Industry, 2025 and 2035
  • Figure 134: South Asia & Pacific Market Y-o-Y Growth Comparison by End-User Industry, 2025-2035
  • Figure 135: South Asia & Pacific Market Attractiveness Analysis by End-User Industry
  • Figure 136: South Asia & Pacific Market Value Share and BPS Analysis by Wire Diameter Types , 2025 and 2035
  • Figure 137: South Asia & Pacific Market Y-o-Y Growth Comparison by Wire Diameter Types , 2025-2035
  • Figure 138: South Asia & Pacific Market Attractiveness Analysis by Wire Diameter Types
  • Figure 139: South Asia & Pacific Market Value Share and BPS Analysis by Product Form , 2025 and 2035
  • Figure 140: South Asia & Pacific Market Y-o-Y Growth Comparison by Product Form , 2025-2035
  • Figure 141: South Asia & Pacific Market Attractiveness Analysis by Product Form
  • Figure 142: South Asia & Pacific Market Value Share and BPS Analysis by Enterprise Size , 2025 and 2035
  • Figure 143: South Asia & Pacific Market Y-o-Y Growth Comparison by Enterprise Size , 2025-2035
  • Figure 144: South Asia & Pacific Market Attractiveness Analysis by Enterprise Size
  • Figure 145: Middle East & Africa Market Value Share and BPS Analysis by Country, 2025 and 2035
  • Figure 146: Middle East & Africa Market Value Share and BPS Analysis by Type of Wire, 2025 and 2035
  • Figure 147: Middle East & Africa Market Y-o-Y Growth Comparison by Type of Wire, 2025-2035
  • Figure 148: Middle East & Africa Market Attractiveness Analysis by Type of Wire
  • Figure 149: Middle East & Africa Market Value Share and BPS Analysis by Application Types , 2025 and 2035
  • Figure 150: Middle East & Africa Market Y-o-Y Growth Comparison by Application Types , 2025-2035
  • Figure 151: Middle East & Africa Market Attractiveness Analysis by Application Types
  • Figure 152: Middle East & Africa Market Value Share and BPS Analysis by End-User Industry, 2025 and 2035
  • Figure 153: Middle East & Africa Market Y-o-Y Growth Comparison by End-User Industry, 2025-2035
  • Figure 154: Middle East & Africa Market Attractiveness Analysis by End-User Industry
  • Figure 155: Middle East & Africa Market Value Share and BPS Analysis by Wire Diameter Types , 2025 and 2035
  • Figure 156: Middle East & Africa Market Y-o-Y Growth Comparison by Wire Diameter Types , 2025-2035
  • Figure 157: Middle East & Africa Market Attractiveness Analysis by Wire Diameter Types
  • Figure 158: Middle East & Africa Market Value Share and BPS Analysis by Product Form , 2025 and 2035
  • Figure 159: Middle East & Africa Market Y-o-Y Growth Comparison by Product Form , 2025-2035
  • Figure 160: Middle East & Africa Market Attractiveness Analysis by Product Form
  • Figure 161: Middle East & Africa Market Value Share and BPS Analysis by Enterprise Size , 2025 and 2035
  • Figure 162: Middle East & Africa Market Y-o-Y Growth Comparison by Enterprise Size , 2025-2035
  • Figure 163: Middle East & Africa Market Attractiveness Analysis by Enterprise Size
  • Figure 164: Global Market - Tier Structure Analysis
  • Figure 165: Global Market - Company Share Analysis

Frequently Asked Questions

What is the current market size of the hose reinforcement wires market?

The global hose reinforcement wires market is valued at USD 563.8 million in 2025 and is projected to reach USD 808.5 million by 2035.

Which product form type leads the global market?

Coiled wire holds the largest share, led by its extensive use in high-pressure hydraulic and automotive hose applications.

Which application segment is the most prominent?

Automotive applications dominate the market, accounting for a significant share due to extensive use in brake, fuel, and AC hose reinforcement.

What is the projected CAGR for the market?

The hose reinforcement wires market is expected to grow at a CAGR of 3.7% between 2025 and 2035.

Which region shows strong growth potential?

Asia Pacific, particularly China and India, shows strong growth due to increasing demand in construction equipment and industrial automation hoses.

What are key challenges faced by manufacturers?

Challenges include fluctuations in raw material costs, increasing demand for lightweight alternatives, and evolving hose designs requiring tighter wire tolerances.

Explore Similar Insights

Future Market Insights

Hose Reinforcement Wires Market