
- Market Size (2026)
- USD 3.8 Bn
- Forecast (2036)
- USD 10.4 Bn
- CAGR (2026 to 2036)
- 10.7%
How big is Reinforcement Geosynthetics Market in 2026?
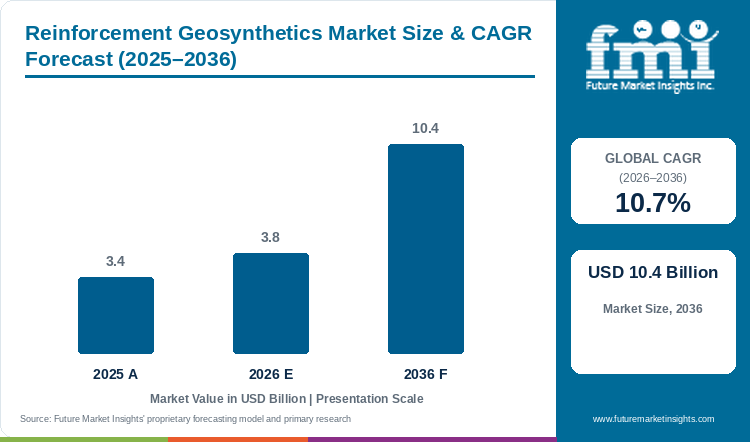
Sales of reinforcement geosynthetics will grow at a CAGR of 10.7% from 2026 to 2036. Market size was USD 3.4 billion in 2025 and is projected to reach USD 3.8 billion in 2026 and USD 10.4 billion by 2036.
Reinforcement geosynthetics market size is projected to rise from USD 3.8 billion in 2026 to USD 10.4 billion by 2036, after standing at USD 3.4 billion in 2025. Demand for reinforcement geosynthetics will grow at a CAGR of 10.7% from 2026 to 2036, according to FMI.
Key challenges faced by suppliers include the timing of public funds. Contractors will order only after programmes are tendered, and a delay in funding will push orders into later years. Stock held near large projects will help suppliers meet short delivery windows and keep orders that slip between tender rounds.
Growth of road renewal is the trend behind the strong pace in the FMI forecast. The UK Department for Transport published a Road Investment Strategy of over GBP 27 billion for April 2026 to March 2031, with GBP 8.4 billion for renewals of major structures and road surfaces. Renewal work strengthens existing road beds and embankments, so demand for geotextiles and geogrids will recur with each renewal cycle. Highway owners are likely to favour longer-lasting road bases as budgets stay tight, and contractors will specify reinforcement to cut repair visits.
Sales potential is expected to emerge from road programmes in other countries that follow the same renewal pattern.
Key Market Trends & Insights
- By product type, geotextiles led with a 47.6% share of sales in 2026, ahead of geo-composites at 36.8% and geofoam at 15.6%, supported by flexibility, strength and ease of installation.
- By application, road construction and embankment accounted for 42.1% of sales in 2026, ahead of bridges abutment and infilling at 11.7% and landfill and erosion control at 10.9%. The FHWA apportioned about USD 56.81 billion in federal-aid highway program funds for fiscal year 2026.
Regional Highlights
- Fastest-growing profiled country: China (14.4% CAGR, 2026 to 2036).
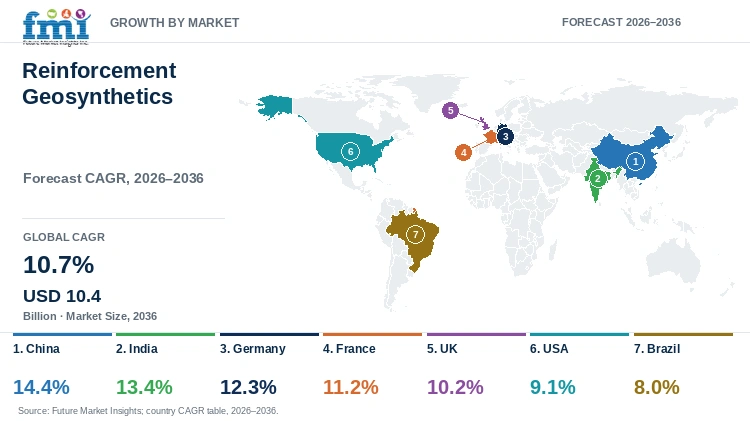
- By country: India (13.4%), Germany (12.3%), France (11.2%), the UK (10.2%) and the USA (9.1%) follow, and Brazil records the lowest profiled CAGR at 8%.
- Germany's Federal Government describes a special fund of EUR 500 billion that funds can approve over 12 years for infrastructure and climate neutrality.
Market Size & Forecast
Table 1: Market Size and Forecast for the Reinforcement Geosynthetics Market (USD billion and percentage), 2025 to 2036
| Metric | Value |
|---|---|
| 2025 Market Size | USD 3.4 billion |
| Estimated Market Size in 2026 | USD 3.8 billion |
| Projected Market Size by 2036 | USD 10.4 billion |
| CAGR, 2026 to 2036 | 10.7% |
| Added Revenue, 2026 to 2036 | USD 6.6 billion |
| Market Expansion Multiple | 2.7x |
Expansion of 2.7 times is projected for reinforcement geosynthetics market size between 2026 and 2036, and nonwoven capacity shows that growth in plant plans. Schouw & Co reported on 5 March 2026 that Fibertex Nonwovens expects revenue growth in 2026, supported by increased production capacity in the USA and new capacity in Europe. Solmax began construction on 5 May 2026 of a European geosynthetics center in Les Mureaux that consolidates European nonwoven production. FMI notes that raw fibers, including polypropylene, polyester and viscose, make up a large share of nonwoven production costs, so fibre prices in the nonwoven fabrics market reach both plants. Buyers of reinforcement fabrics then compare plant location as well as price.
Infrastructure Funding and Supplier Capacity
Public budgets set the order book for reinforcement fabrics, grids and composites. The FHWA apportioned about USD 56.81 billion in federal-aid highway program funds for fiscal year 2026 on 1 October 2025. The UK Department for Transport published a Road Investment Strategy of over GBP 27 billion for April 2026 to March 2031, with GBP 8.4 billion for renewals of major structures and road surfaces. Germany plans federal investments above EUR 120 billion in 2026, against EUR 87 billion in 2025. Brazil's government programmed 14 highway concessions for 2026 with R$158 billion in forecast investment, Diário do Comércio reported on 19 November 2025. Budgets are not orders, and the gap between a funded year and a tendered year tests supplier lead times.
Suppliers are answering with plants and design choices. Officine Maccaferri inaugurated a facility at Fort Lawn, South Carolina, on 5 June 2026, at the Synteen Technical Fabrics site. A Texas State Highway 21 rehabilitation described by HUESKER Inc. used a 75 mm asphalt overlay over a polymeric geocomposite interlayer in place of a 125 mm overlay, a 40% cut in thickness. Naue promoted a webinar for 4 March 2026 on reinforced soil for temporary roads serving wind energy and linear infrastructure projects on soft subgrades. Buyers choose between thinner reinforced designs and thicker conventional ones, and the Texas case gives the first choice a six-year record.
Table 2: Infrastructure Funding and Supplier Capacity Indicators for the Reinforcement Geosynthetics Market (billion amounts, percentages and dates), mixed reporting years from 2025 to 2026
| Indicator | Data Point | Why This Matters | Source |
|---|---|---|---|
| FHWA federal-aid highway program, fiscal year 2026 | About USD 56.81 billion apportioned on 1 October 2025 | The National Highway Performance Program received USD 30.78 billion of that total. | |
| UK Road Investment Strategy 3 | Over GBP 27 billion for April 2026 to March 2031 | GBP 8.4 billion is set for renewals of major structures and road surfaces. | |
| Germany special fund for infrastructure | EUR 500 billion over 12 years; federal investment planned above EUR 120 billion in 2026 | Federal investment was EUR 87 billion in 2025. | |
| Brazil highway concessions, 2026 | 14 concessions planned; R$158 billion in forecast investment | The stretches cover 7,295 km, including 1,197 km of new dual carriageways. | |
| Officine Maccaferri, Khandale, India | Plant of about 400,000 sq ft; second-largest in the group | The plant is planned for geosynthetics, double-twist and rockfall protection solutions. | |
| Officine Maccaferri, Fort Lawn, South Carolina | Facility inaugurated on 5 June 2026 | The opening followed an investment announced in March. | |
| Fibertex Nonwovens, 2026 outlook | Revenue growth expected on added capacity in the USA and Europe | Schouw & Co reported the outlook on 5 March 2026. | |
| Solmax, Les Mureaux | Construction began on 5 May 2026 | European nonwoven production is being consolidated at one center. | |
| Texas State Highway 21 rehabilitation | 75 mm overlay over geocomposite in place of 125 mm; no distress reported by May 2025 | The change is a 40% cut in overlay thickness. | |
| Naue temporary road webinar | 4 March 2026 session on reinforced soil for temporary roads | Unreinforced temporary structures often need large amounts of material and frequent maintenance. |
Analyst Perspective
“Highway, rail and embankment budgets are moving to contract stage in the USA, Germany, the UK and Brazil, and that pipeline will set the pace of the 10.7% CAGR. Suppliers with local plants and geocomposite ranges will hold the strongest position when buyers compare thinner pavement designs.”
- Nikhil Kaitwade, Principal Consultant, Future Market Insights.
How is the Reinforcement Geosynthetics Market segmented?
The reinforcement geosynthetics market is segmented into product type and application, and region. In 2026, geotextiles hold 47.6% of product type sales and road construction and embankment holds 42.1% of application sales.
By product type: geotextiles, geo-composites, and geofoam.
By application: road construction and embankment, bridges abutment and infilling, landfill and erosion control, railways construction, structural base infill, retaining walls, waterworks and waste treatments, and others.
By region: North America, Latin America, Western Europe, Eastern Europe, Balkan and Baltic Countries, Russia and Belarus, Central Asia, East Asia, South Asia and Pacific, and Middle East and Africa.
Why do geotextiles lead product type sales?
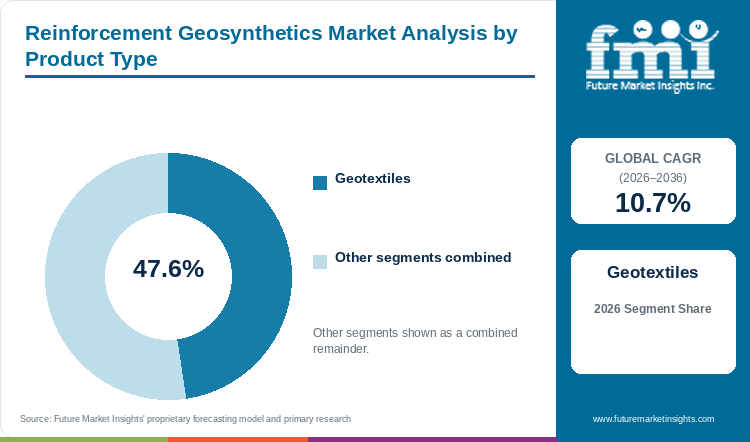
Geotextiles account for 47.6% of product type sales in 2026, ahead of geo-composites at 36.8% and geofoam at 15.6%.
Table 3: Product Type Share for the Reinforcement Geosynthetics Market (percentage share), 2026
| Product Type | Estimated Share (2026) |
|---|---|
| Geotextiles | 47.6% |
| Geo-composites | 36.8% |
| Geofoam | 15.6% |
| Total | 100.0% |
Table 4: Product Type Leadership and Market Growth for the Reinforcement Geosynthetics Market (segment and CAGR percentage), 2026 to 2036
| Metric | Value |
|---|---|
| Global CAGR (2026 to 2036) | 10.7% |
| Leading Segment | Geotextiles |
FMI attributes the lead of geotextiles to flexibility, strength and ease of installation, with quick deployment and a lower draw on natural aggregates as further benefits. Durability is the test buyers apply next. The Texas State Highway 21 rehabilitation described by HUESKER Inc. reports no distress and no annual maintenance since construction, as of an article published on 2 June 2025. Fibre cost swings reach geotextile makers first, and the polypropylene market is the nearest coverage of that input. Buyers weigh a plain geotextile against a composite on each job, and geo-composites and geofoam together hold the 52.4% balance.
- Flexibility, strength and ease of installation drive geotextile use across civil engineering.
- A geocomposite interlayer let engineers cut an asphalt overlay from 125 mm to 75 mm on Texas State Highway 21.
What keeps road construction and embankment ahead of other applications?
Road construction and embankment accounts for 42.1% of application sales in 2026, ahead of bridges abutment and infilling at 11.7% and landfill and erosion control at 10.9%.
Table 5: Application Share for the Reinforcement Geosynthetics Market (percentage share), 2026
| Application | Estimated Share (2026) |
|---|---|
| Road construction and embankment | 42.1% |
| Bridges abutment and infilling | 11.7% |
| Landfill and erosion control | 10.9% |
| Railways construction | 9.3% |
| Retaining walls | 7.8% |
| Structural base infill | 7.2% |
| Waterworks and waste treatments | 6.6% |
| Others | 4.4% |
| Total | 100.0% |
Highway budgets give road construction and embankment work a firm base. The FHWA apportioned USD 30.78 billion to the National Highway Performance Program alone for fiscal year 2026, out of about USD 56.81 billion in federal-aid highway program funds. FMI links the 42.1% share of 2026 application sales to improved pavement performance, erosion control and embankment stability, and to longer road service life with reduced maintenance. Road jobs also buy surface markings, and the road marking paint market covers that adjacent spend. Awards, not apportionments, create the orders for rolls and grids.
- Even load distribution and the prevention of differential settlement support road and embankment use.
- Brazil's 14 planned highway concessions for 2026 cover 7,295 km, including 1,197 km of new dual carriageways and 1,331 km of additional lanes.
What are the drivers, restraints, and opportunities in the Reinforcement Geosynthetics Market?
In the reinforcement geosynthetics market, highway, rail and embankment budgets drive sales, the gap between funding and contract awards restrains orders, and adjacent products such as rockfall protection and reinforced temporary roads open the main opportunity.
- Driver: Highway budgets in the USA, the UK, Germany and Brazil support sales, and thinner reinforced pavement designs cut material use.
- Restraint: Funds apportioned or planned reach suppliers only after contracts are awarded, and Brazil's concession plan still needs confirmed auctions.
- Opportunity: Rockfall protection, double-twist products and reinforced temporary roads give suppliers a route into neighbouring uses.
Highway and Rail Budgets Support Sales
Multi-year programmes give suppliers a schedule to plan against. The UK Department for Transport set over GBP 27 billion for the strategic road network from April 2026 to March 2031, with GBP 8.4 billion for renewals of major structures and road surfaces. Germany's special fund allows approvals over 12 years, and the Federal Government names rail and roads among the intended uses. Renewal work reuses existing embankments and pavements, which puts reinforcement in direct competition with thicker conventional overlays on each job.
Contract Timing Slows the Path from Budget to Order
Apportioned funds are not yet orders. The FHWA notice of 1 October 2025 distributes about USD 56.81 billion across federal-aid highway programs. States and project owners then need to tender work before orders reach suppliers. Diário do Comércio reported on 19 November 2025 that 2026 would see the most highway auctions under President Lula's administration, subject to confirmation of the 14 planned concessions. Suppliers that stock grids and fabrics ahead of awards carry the cost of any delay in tenders.
Adjacent Uses Open a Second Route to Orders
Naue promoted a webinar for 4 March 2026 on reinforced soil for temporary roads, including access roads, working platforms and logistics routes for wind energy and linear infrastructure. Maccaferri's Khandale plant combines geosynthetics with double-twist and rockfall protection solutions. These uses call for the same soil reinforcement skills as road work, so a supplier with embankment engineers can quote them without a new sales team.
Which country CAGRs are profiled in the Reinforcement Geosynthetics Market?
Table 6: Country CAGR Comparison for the Reinforcement Geosynthetics Market (CAGR percentage), 2026 to 2036
| Country | CAGR |
|---|---|
| China | 14.4% |
| India | 13.4% |
| Germany | 12.3% |
| France | 11.2% |
| UK | 10.2% |
| USA | 9.1% |
| Brazil | 8% |
How do country-level CAGRs compare in the reinforcement geosynthetics market?
Seven countries carry a profiled CAGR, and the spread between China at 14.4% and Brazil at 8% is 6.4 percentage points. As per the analysis from FMI, India is projected at 13.4% CAGR from 2026 to 2036, followed by Germany at 12.3% and France at 11.2%. The UK is projected at 10.2% and the USA at 9.1%. Japan and South Korea hold 2025 market sizes of USD 174.3 million and USD 91.8 million.
- China posts the highest rate and leads Asia Pacific growth.
- India follows China by 1.0 percentage point, and Maccaferri is building a plant at Khandale.
- Germany leads Western Europe, and federal investment is planned above EUR 120 billion in 2026.
- France stands 1.1 points below Germany, and Solmax is building a European center at Les Mureaux.
- The UK stands 1.0 point below France, with GBP 27 billion in road funding to March 2031.
- The USA records 9.1%, and the FHWA apportioned about USD 56.81 billion for fiscal year 2026.
- Brazil records the lowest rate, with 14 highway concessions planned for 2026.
Full report country CAGRs cover: North America; Latin America; Western Europe; Eastern Europe; Balkan and Baltic Countries; Russia and Belarus; Central Asia; East Asia; South Asia and Pacific; Middle East and Africa.
Country-wise Analysis
China Reinforcement Geosynthetics Market Outlook (2026 to 2036)
At 14.4% CAGR from 2026 to 2036, China is projected to grow 1.0 percentage point faster than India and 5.3 points faster than the USA. Infrastructure investment and urbanization make China a main engine of Asia Pacific growth. Large public programmes buy through tenders, so foreign suppliers compete on engineering support and local production, and not on catalogue range.
Key takeaway: China gains the most from the scale of public projects, so access to tender lists counts for more than product novelty.
India Reinforcement Geosynthetics Market Outlook (2026 to 2036)
Maccaferri has operated in India for almost 30 years and calls the country one of the group's main growth drivers. The Khandale plant of about 400,000 sq ft will become the second-largest manufacturing facility worldwide, announced on 2 July 2026. India is projected at 13.4% CAGR from 2026 to 2036, and the country joins China as a driver of Asia Pacific growth. A local plant shortens delivery to highway sites, and FMI tracks the wider region in the analysis of demand for geosynthetics in South Asia.
Key takeaway: India favours local production, and the Khandale plant sets the benchmark that rival suppliers have to answer.
Germany Reinforcement Geosynthetics Market Outlook (2026 to 2036)
The Federal Government describes a special fund of EUR 500 billion over 12 years, split into EUR 300 billion for federal investment, EUR 100 billion for the Länder and municipalities and EUR 100 billion for the Climate and Transformation Fund. Federal investment is planned above EUR 120 billion in 2026, against EUR 87 billion in 2025. Germany is projected at 12.3% CAGR from 2026 to 2036, and the country is described as dominant in Western Europe sales in 2024. A fund of that length lets road and rail owners schedule renewals in sequence, so suppliers can plan output against multi-year programmes.
Key takeaway: Germany's 12.3% CAGR has a funded programme behind the forecast, and the EUR 24 billion drawn by the end of 2025 is a small start against the EUR 500 billion fund.
France Reinforcement Geosynthetics Market Outlook (2026 to 2036)
Solmax began construction on 5 May 2026 of a flagship European geosynthetics center in Les Mureaux, France, which consolidates European nonwoven production. France is projected at 11.2% CAGR from 2026 to 2036, 1.1 points below Germany. Infrastructure activity drives European growth, and France follows the regional trend. Fabric made at a central French site shortens the route to project owners in the country.
Key takeaway: France draws a European production decision, since Solmax is placing consolidated nonwoven output inside the country.
UK Reinforcement Geosynthetics Market Outlook (2026 to 2036)
The UK is projected at 10.2% CAGR from 2026 to 2036, 1.0 point below France. The Department for Transport published the third Road Investment Strategy on 26 March 2026 with over GBP 27 billion for April 2026 to March 2031, including GBP 8.4 billion for renewals of major structures and road surfaces. The strategic road network covers 4,500 miles. Renewals of structures and surfaces are jobs in which a reinforced layer competes with a thicker overlay.
Key takeaway: UK sales follow a five-year road plan, so the March 2031 end date frames the supplier order book.
USA Reinforcement Geosynthetics Market Outlook (2026 to 2036)
FMI sizes the USA at USD 1.3 billion in 2025 and projects USD 3.0 billion by 2036, with highways and airport infrastructure as the North American growth drivers. Those figures put the USA at about 38% of 2025 market size and about 32% of 2035, because 9.1% CAGR is below the global 10.7%. Federal-aid highway funds of about USD 56.81 billion were apportioned for fiscal year 2026, supporting highway infrastructure activity across the country.[2] Officine Maccaferri inaugurated a North American facility at Fort Lawn, South Carolina, on 5 June 2026.[7]
Key takeaway: The USA carries about 38% of 2025 market size but grows below the global rate, so suppliers add local plants to defend share.
Brazil Reinforcement Geosynthetics Market Outlook (2026 to 2036)
Brazil is projected at 8% CAGR from 2026 to 2036, the lowest of the seven profiled countries. Diário do Comércio reported on 19 November 2025 that the government planned 14 federal highway concessions for 2026 with R$158 billion in forecast investment, covering 7,295 km, 1,197 km of new dual carriageways and 1,331 km of additional lanes. Eight of the stretches are new and six are renegotiated contracts. New carriageways and added lanes involve earthworks, so concessionaires are the buyers to reach.
Key takeaway: Brazil's concession plan makes private operators the buyers, and auction results set the order timing.
Who are the notable companies in the Reinforcement Geosynthetics Market?
Solmax (Performance Materials), NAUE, Officine Maccaferri, Freudenberg Performance Materials, HUESKER Group, Fibertex Nonwovens, and AGRU Kunststofftechnik are notable companies profiled in this market.
Plant scale and new capacity mark the leading producers. Maccaferri calls the Khandale plant the second-largest manufacturing facility of the group, and Fibertex Nonwovens expects 2026 revenue growth on added capacity. Both companies are adding output in 2026.
Positioning differs by product line. Maccaferri extends into double-twist and rockfall products and opened a South Carolina facility in June 2026. HUESKER is linked to a geocomposite pavement case in Texas, and Naue promotes reinforced temporary roads. Fibertex Nonwovens works from nonwoven capacity inside Schouw & Co.
- Most active producers in 2025 and 2026: Officine Maccaferri, HUESKER Group, NAUE, and Fibertex Nonwovens.
- Other key producers: TenCate Geosynthetics, GSE Environmental, Freudenberg Performance Materials, and AGRU Kunststofftechnik.
Competitive Benchmarking: Reinforcement Geosynthetics Market
Table 7: Competitive Benchmarking for the Reinforcement Geosynthetics Market (qualitative documentation ratings), 2026
| Company | Plant Investment | Road Application | Activity | Disclosure |
|---|---|---|---|---|
| Officine Maccaferri | High | Medium | High | High |
| HUESKER | Low | High | Medium | Medium |
| NAUE | Low | Medium | Medium | Medium |
| Fibertex Nonwovens | Medium | Low | Medium | High |
High indicates wider documentation in company filings and releases, Medium indicates limited documentation, and Low indicates less direct documentation. Ratings do not indicate product quality, market share or company rank.
Key Developments in the Reinforcement Geosynthetics Market
- On 2 July 2026, Geosynthetics Magazine reported that Officine Maccaferri is building a plant of about 400,000 sq ft at Khandale, India.
- On 5 June 2026, Officine Maccaferri inaugurated a North American facility at Fort Lawn, South Carolina.
- On 5 May 2026, Solmax began construction of a flagship European geosynthetics center in Les Mureaux.
- On 5 March 2026, Schouw & Co said Fibertex Nonwovens expects revenue growth in 2026 on added capacity in the USA and Europe.
- On 12 February 2026, Naue promoted a 4 March webinar on reinforced soil for temporary roads.
- On 2 June 2025, Geosynthetics Magazine published a Texas State Highway 21 case on a geocomposite interlayer under the asphalt overlay.
Key Players in the Reinforcement Geosynthetics Market
Most Active Producers
- Officine Maccaferri
- HUESKER Group
- NAUE GmbH & Co. KG
- Fibertex Nonwovens
Other Key Producers
- TenCate Geosynthetics
- GSE Environmental
- Low & Bonar (Freudenberg)
- AGRU Kunststofftechnik
Reinforcement Geosynthetics Market - Report Scope
Table 8: Report Scope for the Reinforcement Geosynthetics Market (coverage fields and definitions), 2026 to 2036
| Coverage field | Report scope |
|---|---|
| Market breakdown | Product type; application; region |
| Quantitative units | USD billion |
| Market definition | Reinforcement geosynthetics market covering geotextiles, geo-composites and geofoam, tracked by application in road construction and embankment, bridges abutment and infilling, landfill and erosion control, railways construction, structural base infill, retaining walls, waterworks and waste treatments, and others. |
| Regions covered | North America; Latin America; Western Europe; Eastern Europe; Balkan and Baltic Countries; Russia and Belarus; Central Asia; East Asia; South Asia and Pacific; Middle East and Africa |
| Countries covered | China; India; Germany; France; UK; USA; Brazil |
| Key companies profiled | TenCate Geosynthetics, NAUE, GSE Environmental, Officine Maccaferri, Low & Bonar (Freudenberg), HUESKER Group, Fibertex Nonwovens, AGRU Kunststofftechnik |
| Forecast period | 2026 to 2036 |
Reinforcement Geosynthetics Market - Research Methodology
Table 9: Research Methodology for the Reinforcement Geosynthetics Market (research methods and approach), 2026 edition
| Method | Approach |
|---|---|
| Data Sources | Company and funding facts come from company releases, trade press, government budget notices and regulator notices dated May 2025 or later. |
| Desk Research | Desk research covers company announcements, trade press on geosynthetics plants and projects, and government budget documents on highway and infrastructure funding. |
| Market Sizing and Forecasting | Sizing starts from the 2025 base of USD 3.4 billion and the 10.7% CAGR. |
| Data Validation | Plant, project and budget figures are compared across company, trade and government sources. |
Reinforcement Geosynthetics Market by Segments
Reinforcement Geosynthetics Market segmented by Product Type:
- Geotextiles
- Geo-composites
- Geofoam
Reinforcement Geosynthetics Market segmented by Application:
- Road construction and embankment
- Bridges abutment and infilling
- Landfill and erosion control
- Railways construction
- Structural base infill
- Retaining walls
- Waterworks and waste treatments
- Others
Reinforcement Geosynthetics Market by Region
- North America
- Latin America
- Western Europe
- Eastern Europe
- Balkan and Baltic Countries
- Russia and Belarus
- Central Asia
- East Asia
- South Asia and Pacific
- Middle East and Africa
Research Sources and Bibliography
- [1] Department for Transport (GOV.UK). (2026, March 26). Road Investment Strategy 3 (RIS3): 2026 to 2031. https://www.gov.uk/government/publications/road-investment-strategy-3-ris3-2026-to-2031/road-investment-strategy-3-ris3-2026-to-2031-introduction
- [2] Federal Highway Administration. (2025, October 1). N 4510.905, Apportionment of Federal-Aid Highway Program Funds for Fiscal Year 2026. https://highways.dot.gov/laws-regulations/directives/notices/n-4510905
- [3] Die Bundesregierung. (2026, March 19). Sondervermögen für Infrastruktur und Klimaneutralität. https://www.bundesregierung.de/breg-de/aktuelles/sondervermoegen-2356240
- [4] Schouw & Co. (GlobeNewswire). (2026, March 5). Schouw & Co. Annual Report 2025. https://www.globenewswire.com/news-release/2026/03/05/3249861/0/en/schouw-co-annual-report-2025.html
- [5] Solmax. (2026, May 5). Solmax begins construction of flagship European geosynthetics center in Les Mureaux. https://www.solmax.com/us/en/news/solmax-begins-construction-of-flagship-european-geosynthetics-center-in-les
- [6] Diário do Comércio (Folhapress). (2025, November 19). Com previsão de R$ 158 bi em investimentos, governo programa 14 concessões de rodovias em 2026; veja quais. https://diariodocomercio.com.br/economia/governo-concessoes-rodovias-2026/
- [7] Geosynthetics Magazine. (2026, June 10). Officine Maccaferri opens new South Carolina facility. https://geosyntheticsmagazine.com/2026/06/10/officine-maccaferri-south-carolina/
- [8] Geosynthetics Magazine. (2025, June 2). Geosynthetic Reinforcement: A Sustainable and Economic Solution for Texas State Highway 21, Part 1. https://geosyntheticsmagazine.com/2025/06/02/geosynthetic-reinforcement-a-sustainable-and-economic-solution-for-texas-state-highway-21-part-1/
- [9] Geosynthetics Magazine. (2026, February 12). Webinar – Strong roads for wind & power lines – March 4. https://geosyntheticsmagazine.com/2026/02/12/webinar-strong-roads-for-wind-power-lines-march-4/
- [10] Geosynthetics Magazine. (2026, July 2). Macaferri building new India manufacturing facility. https://geosyntheticsmagazine.com/2026/07/02/macaferri-building-new-india-manufacturing-facility/
This bibliography is provided for reader reference. The full report contains the complete reference list and detailed citations.
This Report Answers
- How big is the reinforcement geosynthetics market during 2026?
- What market size is projected by 2036?
- Which product type holds notable share?
- Which application holds notable share?
- Which countries have notable growth?
- Which companies are notable in the market?
Table of Content
- Key Takeaways
- Market Size and CAGR
- Top Growth Driver
- Fastest Growing Segment
- Leading Region
- Key Companies
- Emerging Opportunities
- Executive Summary
- Global Market Outlook
- Demand-side Trends
- Supply-side Trends
- Technology Roadmap Analysis
- Analysis and Recommendations
- Analyst Perspective (What is happening? Why now? What should investors know?)
- Key Questions Answered
- How large is the market?
- What is the CAGR?
- What are key trends?
- Which region dominates?
- Who are the leaders?
Read More...
- Market Overview
- Market Coverage / Taxonomy
- Market Definition / Scope / Limitations
- Research Methodology
- Chapter Orientation
- Analytical Lens and Working Hypotheses
- Market Structure, Signals, and Trend Drivers
- Benchmarking and Cross-market Comparability
- Market Sizing, Forecasting, and Opportunity Mapping
- Research Design and Evidence Framework
- Desk Research Programme (Secondary Evidence)
- Expert Input and Fieldwork (Primary Evidence)
- Tooling, Models, and Reference Databases
- Data Engineering and Model Build
- Quality Assurance and Audit Trail
- Market Background
- Market Dynamics (Drivers, Restraints, Opportunity, Trends)
- Scenario Forecast (Optimistic, Likely, Conservative)
- Impact Analysis
- AI Impact
- Sustainability Impact
- Regulatory Impact
- Technology Impact
- Consumer / Buyer Analysis
- Purchase Drivers
- Adoption Barriers
- Buyer Journey
- Opportunity Map Analysis
- Product Life Cycle Analysis
- Supply Chain Analysis
- Investment Feasibility Matrix
- Value Chain Analysis
- PESTLE and Porter's Analysis
- Regulatory Landscape
- Regional Parent Market Outlook
- Production and Consumption Statistics
- Import and Export Statistics
- Global Market Analysis and Forecast, 2021 to 2036
- Historical Market Size Value (USD Billion) Analysis, 2021 to 2025
- Current and Future Market Size Value (USD Billion) Projections, 2026 to 2036
- Y-o-Y Growth Trend Analysis
- Absolute $ Opportunity Analysis
- Global Market Pricing Analysis, 2021 to 2036
- Global Market Analysis and Forecast, By Product Type, 2021 to 2036
- Introduction / Key Findings
- Historical Market Size Value (USD Billion) Analysis By Product Type, 2021 to 2025
- Current and Future Market Size Value (USD Billion) Analysis and Forecast By Product Type, 2026 to 2036
- Geotextiles
- Geo-composites
- Geofoam
- Y-o-Y Growth Trend Analysis By Product Type, 2021 to 2025
- Absolute $ Opportunity Analysis By Product Type, 2026 to 2036
- Global Market Analysis and Forecast, By Application, 2021 to 2036
- Introduction / Key Findings
- Historical Market Size Value (USD Billion) Analysis By Application, 2021 to 2025
- Current and Future Market Size Value (USD Billion) Analysis and Forecast By Application, 2026 to 2036
- Road construction and embankment
- Bridges abutment and infilling
- Landfill and erosion control
- Railways construction
- Structural base infill
- Retaining walls
- Waterworks and waste treatments
- Others
- Y-o-Y Growth Trend Analysis By Application, 2021 to 2025
- Absolute $ Opportunity Analysis By Application, 2026 to 2036
- Global Market Analysis and Forecast, By Region, 2021 to 2036
- Introduction
- Historical Market Size Value (USD Billion) Analysis By Region, 2021 to 2025
- Current Market Size Value (USD Billion) Analysis and Forecast By Region, 2026 to 2036
- North America
- Latin America
- Western Europe
- Eastern Europe
- East Asia
- South Asia and Pacific
- Middle East and Africa
- Market Attractiveness Analysis By Region
- North America Market Analysis and Forecast, By Country, 2021 to 2036
- Historical Market Size Value (USD Billion) Trend Analysis By Market Taxonomy, 2021 to 2025
- Market Size Value (USD Billion) Forecast By Market Taxonomy, 2026 to 2036
- By Country
- By Product Type
- By Application
- Market Attractiveness Analysis
- By Country
- By Product Type
- By Application
- Key Takeaways
- Latin America Market Analysis and Forecast, By Country
- Historical Market Size Value (USD Billion) Trend Analysis By Market Taxonomy, 2021 to 2025
- Market Size Value (USD Billion) Forecast By Market Taxonomy, 2026 to 2036
- By Country
- By Product Type
- By Application
- Market Attractiveness Analysis
- By Country
- By Product Type
- By Application
- Key Takeaways
- Western Europe Market Analysis and Forecast, By Country
- Historical Market Size Value (USD Billion) Trend Analysis By Market Taxonomy, 2021 to 2025
- Market Size Value (USD Billion) Forecast By Market Taxonomy, 2026 to 2036
- By Country
- By Product Type
- By Application
- Market Attractiveness Analysis
- By Country
- By Product Type
- By Application
- Key Takeaways
- Eastern Europe Market Analysis and Forecast, By Country
- Historical Market Size Value (USD Billion) Trend Analysis By Market Taxonomy, 2021 to 2025
- Market Size Value (USD Billion) Forecast By Market Taxonomy, 2026 to 2036
- By Country
- Balkan and Baltic Countries
- Russia and Belarus
- Central Asia
- By Product Type
- By Application
- By Country
- Market Attractiveness Analysis
- By Country
- By Product Type
- By Application
- Key Takeaways
- East Asia Market Analysis and Forecast, By Country
- Historical Market Size Value (USD Billion) Trend Analysis By Market Taxonomy, 2021 to 2025
- Market Size Value (USD Billion) Forecast By Market Taxonomy, 2026 to 2036
- By Country
- By Product Type
- By Application
- Market Attractiveness Analysis
- By Country
- By Product Type
- By Application
- Key Takeaways
- South Asia and Pacific Market Analysis and Forecast, By Country
- Historical Market Size Value (USD Billion) Trend Analysis By Market Taxonomy, 2021 to 2025
- Market Size Value (USD Billion) Forecast By Market Taxonomy, 2026 to 2036
- By Country
- By Product Type
- By Application
- Market Attractiveness Analysis
- By Country
- By Product Type
- By Application
- Key Takeaways
- Middle East and Africa Market Analysis and Forecast, By Country
- Historical Market Size Value (USD Billion) Trend Analysis By Market Taxonomy, 2021 to 2025
- Market Size Value (USD Billion) Forecast By Market Taxonomy, 2026 to 2036
- By Country
- By Product Type
- By Application
- Market Attractiveness Analysis
- By Country
- By Product Type
- By Application
- Key Takeaways
- Key Countries Market Analysis
- China
- Pricing Analysis
- Market Share Analysis, 2025
- By Product Type
- By Application
- India
- Pricing Analysis
- Market Share Analysis, 2025
- By Product Type
- By Application
- Germany
- Pricing Analysis
- Market Share Analysis, 2025
- By Product Type
- By Application
- France
- Pricing Analysis
- Market Share Analysis, 2025
- By Product Type
- By Application
- UK
- Pricing Analysis
- Market Share Analysis, 2025
- By Product Type
- By Application
- USA
- Pricing Analysis
- Market Share Analysis, 2025
- By Product Type
- By Application
- Brazil
- Pricing Analysis
- Market Share Analysis, 2025
- By Product Type
- By Application
- China
- Market Structure Analysis
- Competition Dashboard
- Competition Benchmarking
- Market Share Analysis of Top Players
- By Regional
- By Product Type
- By Application
- Emerging Startups
- Innovation Benchmarking
- Competition Analysis
- Competition Deep Dive
- Officine Maccaferri
- Overview
- Product Portfolio
- Profitability by Market Segments
- Sales Footprint
- Strategy Overview
- Marketing Strategy
- Product Strategy
- Channel Strategy
- HUESKER
- NAUE
- Fibertex Nonwovens
- HUESKER Group
- NAUE GmbH & Co. KG
- TenCate Geosynthetics
- GSE Environmental
- Low & Bonar (Freudenberg)
- AGRU Kunststofftechnik
- Officine Maccaferri
- Case Studies
- Success Stories
- Recent Developments
- Competition Deep Dive
- Assumptions & Acronyms Used
List of Tables
- Table 1: Global Market Value (USD Billion) Forecast by Region, 2021 to 2036
- Table 2: Global Market Value (USD Billion) Forecast by Product Type, 2021 to 2036
- Table 3: Global Market Value (USD Billion) Forecast by Application, 2021 to 2036
- Table 4: North America Market Value (USD Billion) Forecast by Country, 2021 to 2036
- Table 5: North America Market Value (USD Billion) Forecast by Product Type, 2021 to 2036
- Table 6: North America Market Value (USD Billion) Forecast by Application, 2021 to 2036
- Table 7: Latin America Market Value (USD Billion) Forecast by Country, 2021 to 2036
- Table 8: Latin America Market Value (USD Billion) Forecast by Product Type, 2021 to 2036
- Table 9: Latin America Market Value (USD Billion) Forecast by Application, 2021 to 2036
- Table 10: Western Europe Market Value (USD Billion) Forecast by Country, 2021 to 2036
- Table 11: Western Europe Market Value (USD Billion) Forecast by Product Type, 2021 to 2036
- Table 12: Western Europe Market Value (USD Billion) Forecast by Application, 2021 to 2036
- Table 13: Eastern Europe Market Value (USD Billion) Forecast by Country, 2021 to 2036
- Table 14: Eastern Europe Market Value (USD Billion) Forecast by Product Type, 2021 to 2036
- Table 15: Eastern Europe Market Value (USD Billion) Forecast by Application, 2021 to 2036
- Table 16: East Asia Market Value (USD Billion) Forecast by Country, 2021 to 2036
- Table 17: East Asia Market Value (USD Billion) Forecast by Product Type, 2021 to 2036
- Table 18: East Asia Market Value (USD Billion) Forecast by Application, 2021 to 2036
- Table 19: South Asia and Pacific Market Value (USD Billion) Forecast by Country, 2021 to 2036
- Table 20: South Asia and Pacific Market Value (USD Billion) Forecast by Product Type, 2021 to 2036
- Table 21: South Asia and Pacific Market Value (USD Billion) Forecast by Application, 2021 to 2036
- Table 22: Middle East and Africa Market Value (USD Billion) Forecast by Country, 2021 to 2036
- Table 23: Middle East and Africa Market Value (USD Billion) Forecast by Product Type, 2021 to 2036
- Table 24: Middle East and Africa Market Value (USD Billion) Forecast by Application, 2021 to 2036
List of Figures
- Figure 1: Global Market Pricing Analysis
- Figure 2: Global Market Value (USD Billion) Forecast 2021-2036
- Figure 3: Global Market Value Share and BPS Analysis by Product Type, 2026 and 2036
- Figure 4: Global Market Y-o-Y Growth Comparison by Product Type, 2026-2036
- Figure 5: Global Market Attractiveness Analysis by Product Type
- Figure 6: Global Market Value Share and BPS Analysis by Application, 2026 and 2036
- Figure 7: Global Market Y-o-Y Growth Comparison by Application, 2026-2036
- Figure 8: Global Market Attractiveness Analysis by Application
- Figure 9: Global Market Value (USD Billion) Share and BPS Analysis by Region, 2026 and 2036
- Figure 10: Global Market Y-o-Y Growth Comparison by Region, 2026-2036
- Figure 11: Global Market Attractiveness Analysis by Region
- Figure 12: North America Market Incremental Dollar Opportunity, 2026-2036
- Figure 13: Latin America Market Incremental Dollar Opportunity, 2026-2036
- Figure 14: Western Europe Market Incremental Dollar Opportunity, 2026-2036
- Figure 15: Eastern Europe Market Incremental Dollar Opportunity, 2026-2036
- Figure 16: East Asia Market Incremental Dollar Opportunity, 2026-2036
- Figure 17: South Asia and Pacific Market Incremental Dollar Opportunity, 2026-2036
- Figure 18: Middle East and Africa Market Incremental Dollar Opportunity, 2026-2036
- Figure 19: North America Market Value Share and BPS Analysis by Country, 2026 and 2036
- Figure 20: North America Market Value Share and BPS Analysis by Product Type, 2026 and 2036
- Figure 21: North America Market Y-o-Y Growth Comparison by Product Type, 2026-2036
- Figure 22: North America Market Attractiveness Analysis by Product Type
- Figure 23: North America Market Value Share and BPS Analysis by Application, 2026 and 2036
- Figure 24: North America Market Y-o-Y Growth Comparison by Application, 2026-2036
- Figure 25: North America Market Attractiveness Analysis by Application
- Figure 26: Latin America Market Value Share and BPS Analysis by Country, 2026 and 2036
- Figure 27: Latin America Market Value Share and BPS Analysis by Product Type, 2026 and 2036
- Figure 28: Latin America Market Y-o-Y Growth Comparison by Product Type, 2026-2036
- Figure 29: Latin America Market Attractiveness Analysis by Product Type
- Figure 30: Latin America Market Value Share and BPS Analysis by Application, 2026 and 2036
- Figure 31: Latin America Market Y-o-Y Growth Comparison by Application, 2026-2036
- Figure 32: Latin America Market Attractiveness Analysis by Application
- Figure 33: Western Europe Market Value Share and BPS Analysis by Country, 2026 and 2036
- Figure 34: Western Europe Market Value Share and BPS Analysis by Product Type, 2026 and 2036
- Figure 35: Western Europe Market Y-o-Y Growth Comparison by Product Type, 2026-2036
- Figure 36: Western Europe Market Attractiveness Analysis by Product Type
- Figure 37: Western Europe Market Value Share and BPS Analysis by Application, 2026 and 2036
- Figure 38: Western Europe Market Y-o-Y Growth Comparison by Application, 2026-2036
- Figure 39: Western Europe Market Attractiveness Analysis by Application
- Figure 40: Eastern Europe Market Value Share and BPS Analysis by Country, 2026 and 2036
- Figure 41: Eastern Europe Market Value Share and BPS Analysis by Product Type, 2026 and 2036
- Figure 42: Eastern Europe Market Y-o-Y Growth Comparison by Product Type, 2026-2036
- Figure 43: Eastern Europe Market Attractiveness Analysis by Product Type
- Figure 44: Eastern Europe Market Value Share and BPS Analysis by Application, 2026 and 2036
- Figure 45: Eastern Europe Market Y-o-Y Growth Comparison by Application, 2026-2036
- Figure 46: Eastern Europe Market Attractiveness Analysis by Application
- Figure 47: East Asia Market Value Share and BPS Analysis by Country, 2026 and 2036
- Figure 48: East Asia Market Value Share and BPS Analysis by Product Type, 2026 and 2036
- Figure 49: East Asia Market Y-o-Y Growth Comparison by Product Type, 2026-2036
- Figure 50: East Asia Market Attractiveness Analysis by Product Type
- Figure 51: East Asia Market Value Share and BPS Analysis by Application, 2026 and 2036
- Figure 52: East Asia Market Y-o-Y Growth Comparison by Application, 2026-2036
- Figure 53: East Asia Market Attractiveness Analysis by Application
- Figure 54: South Asia and Pacific Market Value Share and BPS Analysis by Country, 2026 and 2036
- Figure 55: South Asia and Pacific Market Value Share and BPS Analysis by Product Type, 2026 and 2036
- Figure 56: South Asia and Pacific Market Y-o-Y Growth Comparison by Product Type, 2026-2036
- Figure 57: South Asia and Pacific Market Attractiveness Analysis by Product Type
- Figure 58: South Asia and Pacific Market Value Share and BPS Analysis by Application, 2026 and 2036
- Figure 59: South Asia and Pacific Market Y-o-Y Growth Comparison by Application, 2026-2036
- Figure 60: South Asia and Pacific Market Attractiveness Analysis by Application
- Figure 61: Middle East and Africa Market Value Share and BPS Analysis by Country, 2026 and 2036
- Figure 62: Middle East and Africa Market Value Share and BPS Analysis by Product Type, 2026 and 2036
- Figure 63: Middle East and Africa Market Y-o-Y Growth Comparison by Product Type, 2026-2036
- Figure 64: Middle East and Africa Market Attractiveness Analysis by Product Type
- Figure 65: Middle East and Africa Market Value Share and BPS Analysis by Application, 2026 and 2036
- Figure 66: Middle East and Africa Market Y-o-Y Growth Comparison by Application, 2026-2036
- Figure 67: Middle East and Africa Market Attractiveness Analysis by Application
- Figure 68: Global Market - Tier Structure Analysis
- Figure 69: Global Market - Company Share Analysis
Frequently Asked Questions
How large is the Reinforcement Geosynthetics Market in 2026?
Future Market Insights estimates that market size is projected to reach USD 3.8 billion in 2026, up from USD 3.4 billion in 2025. Market size is projected to reach USD 10.4 billion by 2036 as highway, rail and embankment budgets reach contract stage.
What CAGR is projected for the Reinforcement Geosynthetics Market through 2036?
As per FMI analysis, sales of reinforcement geosynthetics will grow at a CAGR of 10.7% from 2026 to 2036. Investment in highways, embankments and airport pavements leads the growth drivers.
Which product type holds a notable market share in 2026?
Geotextiles account for 47.6% of product type sales in 2026. Geo-composites and geofoam share the balance.
Which application holds a notable market share in 2026?
Road construction and embankment accounts for 42.1% of application sales in 2026. Bridges abutment and infilling, landfill and erosion control, and railways construction are among the other applications.
Which country has a notable expansion outlook through 2036?
The fastest growth, at 14.4% CAGR from 2026 to 2036, is projected for China, according to FMI. India follows at 13.4% CAGR.
Who are the key companies in the Reinforcement Geosynthetics Market?
Notable companies include TenCate Geosynthetics, NAUE, GSE Environmental, Officine Maccaferri, Low & Bonar (Freudenberg), HUESKER Group, Fibertex Nonwovens, and AGRU Kunststofftechnik.
Preview the report firsthand - request a free sample
Get SampleGet the brochure for pricing and purchase details.
Get PDF
