Microbial Lipase Market Size and Share Forecast Outlook 2025 to 2035

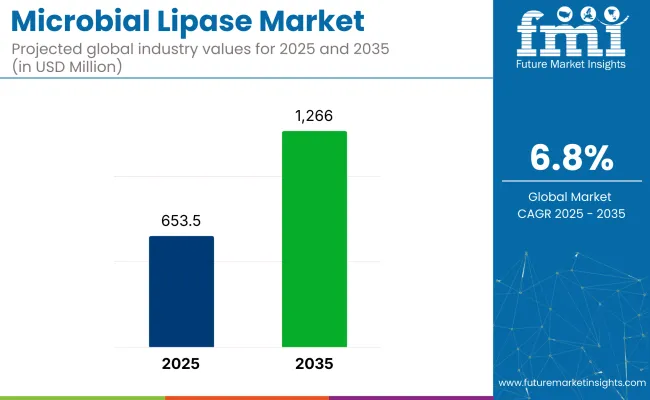
The microbial lipase market is valued at USD 653.5 million and is forecast to reach USD 1,266.0 million by 2035, which shows a CAGR of 6.8%.
Quick Stats - Microbial Lipase Market

  • Market Size (2025): USD 653.5 million
  • Projected Market Size (2035): USD 1,266.0 million
  • Value-based CAGR (2025 to 2035): 6.8%
  • Top Source Segment: Fungi-based lipases (48.9% share)
  • Leading Application Area: Cleaning agents (23.9% share)
  • Top Growth Region: Europe (Germany is fastest-growing market with 7.1% CAGR)

Microbial Lipase Market

Metric Value
Market Value (2025) USD 653.5 million
Market Value (2035) USD 1,266.0 million
CAGR (2025 to 2035) 6.8%

Technological advancements in fermentation and bioprocessing have allowed for greater yield and functional enzyme customization, benefiting major players such as Novozymes, Amano Enzyme, and DSM.Microbial lipases, which catalyze the breakdown of fats, are preferred in industrial processes for their specificity and eco-friendly nature. The market is witnessing a shift from chemical surfactants to enzyme-based alternatives, especially in the detergent and food processing sectors. This transformation is also aided by rising awareness of clean-label ingredients and the growing need for biodegradable, sustainable inputs.

Research institutions and industry players are collaborating more frequently, promoting innovations in enzyme purification and fermentation technology. The emphasis on renewable feedstock utilization, low-energy enzymatic reactions, and reduction of processing residues is expected to define the microbial lipase production landscape for the next decade. The convergence of synthetic biology, AI-led strain design, and sustainable manufacturing positions microbial lipases as critical agents in industrial biotransformation.

Key application areas such as biodiesel production are also seeing a surge in microbial lipase use, due to the enzyme's role in enhancing transesterification processes. In terms of application, the cleaning agents segment holds 23.9% share. On the basis of source, the fungi-derived lipases segment accounts for 48.9% share.The USA is poised to grow at 6.8% CAGR during the study period.

The microbial lipase market falls under the broader functional food ingredients and industrial enzymes categories. It represents a niche yet rapidly growing subset within the global enzyme industry, which includes proteases, amylases, and carbohydrases. Microbial lipases contribute approximately 8-10% of the global industrial enzymes market and around 12-15% within the specialty food enzymes segment. With increasing applications in both household and industrial bio-catalysis, microbial lipases are also influencing innovation in sectors like green chemistry and biopharmaceuticals.

Analyzing Microbial Lipase Market by Top Investment Segments

The market is segmented by source into fungi, bacteria, and yeast; by form into powder and liquid; by application into cleaning agents, animal feed, dairy products, bakery products, confectionery products, and other applications (pharmaceuticals, leather processing, biodiesel production, cosmetics, and wastewater treatment); and by region into North America, Latin America, Europe, East Asia, South Asia, Oceania, and the Middle East & Africa (MEA).

Fungi to Lead the Source Segment with 48.9% Market Share in 2025

Fungi-derived microbial lipases dominate the source segment, holding approximately 48.9% of the global market share in 2025.
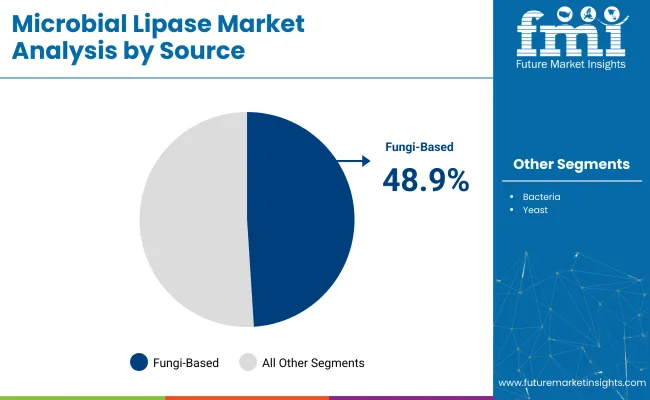
  • Fungi offer high enzyme yields and superior stability under varying pH and temperature conditions.
  • They are widely used across food processing, detergents, and biodiesel sectors due to their robust fermentation profiles.
  • Aspergillus and Rhizopus species are especially preferred for industrial-scale lipase production.

Microbial Lipase Market By Source

Powder to Lead the Form Segment with 58.2% Market Share in 2025

Powdered microbial lipases are set to lead the form segment, commanding a 58.2% market share in 2025.

  • Powder form provides better shelf life and heat stability compared to liquids.
  • It is preferred for dry blending in animal feed, detergent formulations, and baking premixes.
  • Easier handling, transportation, and dosing flexibility make it ideal for large-scale use.

Cleaning Agents to Lead the Application Segment with 23.9% Market Share in 2025

Cleaning agents account for the largest share of the microbial lipase market by application, holding 23.9% market share in 2025.
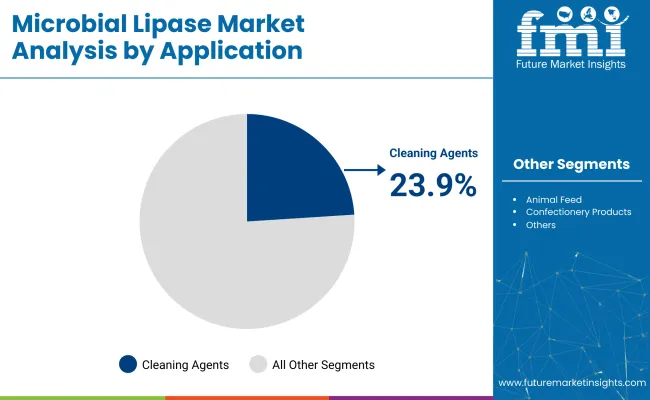
  • Lipases break down greasy stains by hydrolyzing fats into water-soluble components.
  • Widely used in laundry and dishwashing detergents, both household and industrial.
  • Their cold-water activity reduces energy consumption and enhances fabric safety.

Microbial Lipase Market By Application

Top Microbial Lipase Market Dynamics

The market is witnessing consistent expansion, fueled by increasing demand for enzyme-based alternatives in food processing, cleaning, and biofuel production. Growing preference for natural, biodegradable enzymes, rising clean-label food trends, and advancements in fermentation technology are contributing significantly to market acceleration. Additionally, partnerships between enzyme producers and research institutions are driving innovation in lipase specificity and industrial applicability.

Recent Trends in the Microbial Lipase Market

  • Enzyme manufacturers are investing in synthetic biology to create customized lipase strains with enhanced functionality.
  • Use of microbial lipase in plant-based food processing is increasing to improve texture and mouthfeel.
  • Adoption of lipases in bioremediation and green chemistry is expanding due to their eco-friendly profile.
  • Growing demand for lipase-based cold-water detergents to reduce energy use and improve sustainability.

Challenges in the Microbial Lipase Market
  • High production costs associated with strain optimization, purification, and scaling.
  • Stringent regulatory approvals for enzymes used in food and pharmaceutical applications.
  • Limited awareness and slower adoption of microbial enzymes in low-income and emerging markets.
  • Temperature and pH sensitivity of some microbial lipases affecting performance consistency in harsh industrial environments.

Analyzing Top Countries Exporting and Supplying Microbial Lipase-based Products

Microbial Lipase Market Country Wise

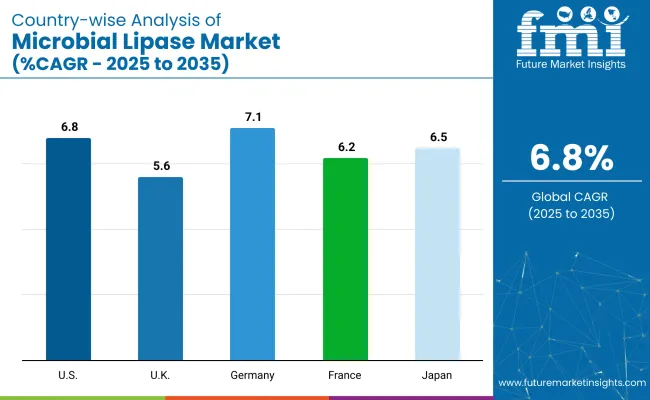
Among the top five countries, Germany is projected to witness the fastest growth in the microbial lipase market with a CAGR of 7.1% from 2025 to 2035, driven by strong industrial biotech adoption and R&D investments. The USA follows closely with 6.8% CAGR, supported by clean-label trends and biofuel sector expansion. Japan and France are expected to grow at 6.5% and 6.2% CAGR respectively, fueled by applications in personal care and food processing. The UK shows steady but comparatively lower growth at 5.6% CAGR, reflecting its mature market and stringent sustainability standards across detergent and food enzyme use cases.

The report covers an in-depth analysis of 40+ countries; five top-performing OECD countries are highlighted below.

USA Microbial Lipase Market Analysis

The microbial lipase demand in the USA is projected to grow at a CAGR of 6.8% from 2025 to 2035.

  • Rising incorporation of microbial lipase in plant-based food processing for enhanced flavor and texture.
  • Strong focus on clean-label ingredients and enzymatic food processing.
  • Growing demand in the biofuel industry for transesterification applications.
  • Leading players like Novozymes and Enzyme Development Corp. driving innovation and market penetration.

UK Microbial Lipase Demand Analysis

Demand for microbial lipase in the UK is projected to grow steadily at a CAGR of 5.6% from 2025 to 2035.

  • Increasing use of microbial enzymes in eco-friendly detergents and personal care products.
  • Compliance with EU sustainability standards promoting enzyme-based formulations.
  • Growth in artisan and specialty food processing utilizing microbial lipases.
  • Companies investing in biotech partnerships to enhance fermentation yields.

Germany Microbial Lipase Market Analysis

Germany’s microbial lipase revenue is projected to grow at a CAGR of 7.1% from 2025 to 2035.

  • Expanding role of microbial lipase in industrial biotech and pharmaceutical production.
  • Strong emphasis on green chemistry and bio-based processing technologies.
  • High regulatory standards favoring safe, enzyme-based manufacturing.
  • Partnerships between global producers and German R&D institutes advancing product innovation.

France Microbial Lipase Market Analysis

Demand for microbial lipase in France is projected to grow at a CAGR of 6.2% from 2025 to 2035.

  • Growing demand for bio-catalysts in dairy and bakery food processing.
  • Shift toward non-GMO enzymatic solutions in food and beverage production.
  • Increasing government incentives for low-emission enzymatic alternatives.
  • Local enzyme producers expanding fermentation capacity for food-grade lipases.

Japan Microbial Lipase Demand Analysis

Microbial lipase revenue in Japan is projected to grow at a CAGR of 6.5% from 2025 to 2035.

  • High demand in cosmetic and personal care sectors for stable, bioactive enzymes.
  • Rising adoption of microbial lipases in aquaculture feed enhancement.
  • Growing R&D focus on thermostable lipase strains for niche applications.
  • Import reliance supported by stringent quality control regulations and rising consumer awareness.

Leading Microbial Lipase Companies

The microbial lipase market is moderately fragmented, with a mix of global enzyme giants and specialized biotech firms. Novozymes, BASF, and DSM lead as Tier 1 players, leveraging advanced fermentation technologies, global distribution networks, and strong R&D pipelines. Amano Enzyme, AB Enzymes, and Chr.

Hansen follow in Tier 2, focusing on tailored applications in food, feed, and detergents. Enzyme Development Corp., Biocatalysts, and Genomatica represent Tier 3 players, offering niche solutions and innovative enzyme formulations for specific industrial needs. Strategic collaborations, patent filings, and expansion into clean-label and sustainable enzyme markets define the competition. Continuous innovation in strain engineering and production efficiency remains key to gaining market share amid growing demand for natural and eco-friendly enzyme solutions.

Recent Microbial Lipase Industry News

  • In November 2024, BASF inked a deal with Acies Bio to enhance its position in the sustainable space.
  • In July 2024, Amano broke ground on a 29,827 sq ft expansion at its Elgin, Illinois facility, adding manufacturing, warehouse, and technical services capacity.

Microbial Lipase Market Report Scope

Report Attributes Details
Current Total Market Size (2025) USD 653.5 million
Projected Market Size (2035) USD 1,266.0 million
CAGR (2025 to 2035) 6.8%
Base Year for Estimation 2024
Historical Period 2020 to 2024
Projections Period 2025 to 2035
Market Analysis Parameters Revenue in USD million/Volume in Kilo Tons
By Source Fungi, Bacteria, and Yeast
By Form Powder and Liquid
By End Use Industry Agriculture (Commercial Farming, Organic Farming), Animal Feed, Aquaculture, Horticulture
By Application Cleaning Agents, Animal Feed, Dairy Products, Bakery Products, Confectionery Products, and Other Applications (Pharmaceuticals, Leather Processing, Biodiesel Production, Cosmetics, and Wastewater Treatment)
Regions Covered North America, Latin America, Western Europe, Eastern Europe, East Asia, South Asia & Pacific, Middle East & Africa
Countries Covered United States, Canada, United Kingdom, Germany, France, China, Japan, South Korea, Brazil, Australia
Key Players Novozymes , BASF, DSM, Amano Enzyme, AB Enzymes, Chr. Hansen, Enzyme Development Corp., Biocatalysts, Genomatica
Additional Attributes Dollar sales by value, market share analysis by region, and country-wise analysis.

Segmentation

By Source:

Fungi, Bacteria, and Yeast.

By Form:

Powder and Liquid.

By End Use:

Industry Agriculture (Commercial Farming, Organic Farming), Animal Feed, Aquaculture, Horticulture.

By Application:

Cleaning Agents, Animal Feed, Dairy Products, Bakery Products, Confectionery Products, and Other Applications (Pharmaceuticals, Leather Processing, Biodiesel Production, Cosmetics, and Wastewater Treatment).

By Regions:

Regions Covered North America, Latin America, Western Europe, Eastern Europe, East Asia, South Asia & Pacific, Middle East & Africa.

Table of Content

  1. Executive Summary
    • Global Market Outlook
    • Demand-side Trends
    • Supply-side Trends
    • Technology Roadmap Analysis
    • Analysis and Recommendations
  2. Market Overview
    • Market Coverage / Taxonomy
    • Market Definition / Scope / Limitations
  3. Market Background
    • Market Dynamics
      • Drivers
      • Restraints
      • Opportunity
      • Trends
    • Scenario Forecast
      • Demand in Optimistic Scenario
      • Demand in Likely Scenario
      • Demand in Conservative Scenario
    • Opportunity Map Analysis
    • Product Life Cycle Analysis
    • Supply Chain Analysis
      • Supply Side Participants and their Roles
        • Producers
        • Mid-Level Participants (Traders/ Agents/ Brokers)
        • Wholesalers and Distributors
      • Value Added and Value Created at Node in the Supply Chain
      • List of Raw Material Suppliers
      • List of Existing and Potential Buyer’s
    • Investment Feasibility Matrix
    • Value Chain Analysis
      • Profit Margin Analysis
      • Wholesalers and Distributors
      • Retailers
    • PESTLE and Porter’s Analysis
    • Regulatory Landscape
      • By Key Regions
      • By Key Countries
    • Regional Parent Market Outlook
    • Production and Consumption Statistics
    • Import and Export Statistics
  4. Global Market Analysis 2020 to 2024 and Forecast, 2025 to 2035
    • Historical Market Size Value (USD Million) & Volume (Kilo Tons) Analysis, 2020 to 2024
    • Current and Future Market Size Value (USD Million) & Volume (Kilo Tons) Projections, 2025 to 2035
      • Y-o-Y Growth Trend Analysis
      • Absolute $ Opportunity Analysis
  5. Global Market Pricing Analysis 2020 to 2024 and Forecast 2025 to 2035
  6. Global Market Analysis 2020 to 2024 and Forecast 2025 to 2035, By Source
    • Introduction / Key Findings
    • Historical Market Size Value (USD Million) & Volume (Kilo Tons) Analysis By Source, 2020 to 2024
    • Current and Future Market Size Value (USD Million) & Volume (Kilo Tons) Analysis and Forecast By Source, 2025 to 2035
      • Fungi
      • Bacteria
      • Yeast
    • Y-o-Y Growth Trend Analysis By Source, 2020 to 2024
    • Absolute $ Opportunity Analysis By Source, 2025 to 2035
  7. Global Market Analysis 2020 to 2024 and Forecast 2025 to 2035, By Form
    • Introduction / Key Findings
    • Historical Market Size Value (USD Million) & Volume (Kilo Tons) Analysis By Form, 2020 to 2024
    • Current and Future Market Size Value (USD Million) & Volume (Kilo Tons) Analysis and Forecast By Form, 2025 to 2035
      • Powder
      • Liquid
    • Y-o-Y Growth Trend Analysis By Form, 2020 to 2024
    • Absolute $ Opportunity Analysis By Form, 2025 to 2035
  8. Global Market Analysis 2020 to 2024 and Forecast 2025 to 2035, By Application
    • Introduction / Key Findings
    • Historical Market Size Value (USD Million) & Volume (Kilo Tons) Analysis By Application, 2020 to 2024
    • Current and Future Market Size Value (USD Million) & Volume (Kilo Tons) Analysis and Forecast By Application, 2025 to 2035
      • Cleaning Agents
      • Animal Feed
      • Dairy Products
      • Bakery Products
      • Confectionery Products
      • Other Applications
    • Y-o-Y Growth Trend Analysis By Application, 2020 to 2024
    • Absolute $ Opportunity Analysis By Application, 2025 to 2035
  9. Global Market Analysis 2020 to 2024 and Forecast 2025 to 2035, By Region
    • Introduction
    • Historical Market Size Value (USD Million) & Volume (Kilo Tons) Analysis By Region, 2020 to 2024
    • Current Market Size Value (USD Million) & Volume (Kilo Tons) Analysis and Forecast By Region, 2025 to 2035
      • North America
      • Latin America
      • Western Europe
      • Eastern Europe
      • East Asia
      • South Asia & Pacific
      • Middle East and Africa
    • Market Attractiveness Analysis By Region
  10. North America Market Analysis 2020 to 2024 and Forecast 2025 to 2035, By Country
    • Historical Market Size Value (USD Million) & Volume (Kilo Tons) Trend Analysis By Market Taxonomy, 2020 to 2024
    • Market Size Value (USD Million) & Volume (Kilo Tons) Forecast By Market Taxonomy, 2025 to 2035
      • By Country
        • USA
        • Canada
        • Mexico
      • By Source
      • By Form
      • By Application
    • Market Attractiveness Analysis
      • By Country
      • By Source
      • By Form
      • By Application
    • Key Takeaways
  11. Latin America Market Analysis 2020 to 2024 and Forecast 2025 to 2035, By Country
    • Historical Market Size Value (USD Million) & Volume (Kilo Tons) Trend Analysis By Market Taxonomy, 2020 to 2024
    • Market Size Value (USD Million) & Volume (Kilo Tons) Forecast By Market Taxonomy, 2025 to 2035
      • By Country
        • Brazil
        • Argentina
        • Rest of LATAM
      • By Source
      • By Form
      • By Application
    • Market Attractiveness Analysis
      • By Country
      • By Source
      • By Form
      • By Application
    • Key Takeaways
  12. Western Europe Market Analysis 2020 to 2024 and Forecast 2025 to 2035, By Country
    • Historical Market Size Value (USD Million) & Volume (Kilo Tons) Trend Analysis By Market Taxonomy, 2020 to 2024
    • Market Size Value (USD Million) & Volume (Kilo Tons) Forecast By Market Taxonomy, 2025 to 2035
      • By Country
        • Germany
        • Italy
        • France
        • UK
        • Spain
        • BENELUX
        • Nordic
        • Rest of W.Europe
      • By Source
      • By Form
      • By Application
    • Market Attractiveness Analysis
      • By Country
      • By Source
      • By Form
      • By Application
    • Key Takeaways
  13. Eastern Europe Market Analysis 2020 to 2024 and Forecast 2025 to 2035, By Country
    • Historical Market Size Value (USD Million) & Volume (Kilo Tons) Trend Analysis By Market Taxonomy, 2020 to 2024
    • Market Size Value (USD Million) & Volume (Kilo Tons) Forecast By Market Taxonomy, 2025 to 2035
      • By Country
        • Russia
        • Hungary
        • Poland
        • Balkan & Baltics
        • Rest of E. Europe
      • By Source
      • By Form
      • By Application
    • Market Attractiveness Analysis
      • By Country
      • By Source
      • By Form
      • By Application
    • Key Takeaways
  14. East Asia Market Analysis 2020 to 2024 and Forecast 2025 to 2035, By Country
    • Historical Market Size Value (USD Million) & Volume (Kilo Tons) Trend Analysis By Market Taxonomy, 2020 to 2024
    • Market Size Value (USD Million) & Volume (Kilo Tons) Forecast By Market Taxonomy, 2025 to 2035
      • By Country
        • China
        • Japan
        • South Korea
      • By Source
      • By Form
      • By Application
    • Market Attractiveness Analysis
      • By Country
      • By Source
      • By Form
      • By Application
    • Key Takeaways
  15. South Asia & Pacific Market Analysis 2020 to 2024 and Forecast 2025 to 2035, By Country
    • Historical Market Size Value (USD Million) & Volume (Kilo Tons) Trend Analysis By Market Taxonomy, 2020 to 2024
    • Market Size Value (USD Million) & Volume (Kilo Tons) Forecast By Market Taxonomy, 2025 to 2035
      • By Country
        • India
        • Australia & New Zealand
        • ASEAN
        • Rest of SAP
      • By Source
      • By Form
      • By Application
    • Market Attractiveness Analysis
      • By Country
      • By Source
      • By Form
      • By Application
    • Key Takeaways
  16. Middle East and Africa Market Analysis 2020 to 2024 and Forecast 2025 to 2035, By Country
    • Historical Market Size Value (USD Million) & Volume (Kilo Tons) Trend Analysis By Market Taxonomy, 2020 to 2024
    • Market Size Value (USD Million) & Volume (Kilo Tons) Forecast By Market Taxonomy, 2025 to 2035
      • By Country
        • GCC Countries
        • Northern Africa
        • South Africa
        • Turkiye
        • Rest of MEA
      • By Source
      • By Form
      • By Application
    • Market Attractiveness Analysis
      • By Country
      • By Source
      • By Form
      • By Application
    • Key Takeaways
  17. Key Countries Market Analysis
    • USA
      • Pricing Analysis
      • Market Share Analysis, 2024
        • By Source
        • By Form
        • By Application
    • Canada
      • Pricing Analysis
      • Market Share Analysis, 2024
        • By Source
        • By Form
        • By Application
    • Brazil
      • Pricing Analysis
      • Market Share Analysis, 2024
        • By Source
        • By Form
        • By Application
    • Mexico
      • Pricing Analysis
      • Market Share Analysis, 2024
        • By Source
        • By Form
        • By Application
    • Argentina
      • Pricing Analysis
      • Market Share Analysis, 2024
        • By Source
        • By Form
        • By Application
  18. Market Structure Analysis
    • Competition Dashboard
    • Competition Benchmarking
    • Market Share Analysis of Top Players
      • By Regional
      • By Source
      • By Form
      • By Application
  19. Competition Analysis
    • Competition Deep Dive
      • Novozymes
        • Overview
        • Product Portfolio
        • Profitability by Market Segments (Product/Age /Sales Channel/Region)
        • Sales Footprint
        • Strategy Overview
          • Marketing Strategy
          • Product Strategy
          • Channel Strategy
      • BASF
        • Overview
        • Product Portfolio
        • Profitability by Market Segments (Product/Age /Sales Channel/Region)
        • Sales Footprint
        • Strategy Overview
          • Marketing Strategy
          • Product Strategy
          • Channel Strategy
      • DSM
        • Overview
        • Product Portfolio
        • Profitability by Market Segments (Product/Age /Sales Channel/Region)
        • Sales Footprint
        • Strategy Overview
          • Marketing Strategy
          • Product Strategy
          • Channel Strategy
      • Amano Enzyme
        • Overview
        • Product Portfolio
        • Profitability by Market Segments (Product/Age /Sales Channel/Region)
        • Sales Footprint
        • Strategy Overview
          • Marketing Strategy
          • Product Strategy
          • Channel Strategy
      • AB Enzymes
        • Overview
        • Product Portfolio
        • Profitability by Market Segments (Product/Age /Sales Channel/Region)
        • Sales Footprint
        • Strategy Overview
          • Marketing Strategy
          • Product Strategy
          • Channel Strategy
      • Chr. Hansen
        • Overview
        • Product Portfolio
        • Profitability by Market Segments (Product/Age /Sales Channel/Region)
        • Sales Footprint
        • Strategy Overview
          • Marketing Strategy
          • Product Strategy
          • Channel Strategy
      • Enzyme Development Corp.
        • Overview
        • Product Portfolio
        • Profitability by Market Segments (Product/Age /Sales Channel/Region)
        • Sales Footprint
        • Strategy Overview
          • Marketing Strategy
          • Product Strategy
          • Channel Strategy
      • Biocatalysts
        • Overview
        • Product Portfolio
        • Profitability by Market Segments (Product/Age /Sales Channel/Region)
        • Sales Footprint
        • Strategy Overview
          • Marketing Strategy
          • Product Strategy
          • Channel Strategy
      • Genomatica
        • Overview
        • Product Portfolio
        • Profitability by Market Segments (Product/Age /Sales Channel/Region)
        • Sales Footprint
        • Strategy Overview
          • Marketing Strategy
          • Product Strategy
          • Channel Strategy
  20. Assumptions & Acronyms Used
  21. Research Methodology

List of Tables

  • Table 1: Global Market Value (USD Million) Forecast by Region, 2020 to 2035
  • Table 2: Global Market Volume (Kilo Tons) Forecast by Region, 2020 to 2035
  • Table 3: Global Market Value (USD Million) Forecast by Source, 2020 to 2035
  • Table 4: Global Market Volume (Kilo Tons) Forecast by Source, 2020 to 2035
  • Table 5: Global Market Value (USD Million) Forecast by Form, 2020 to 2035
  • Table 6: Global Market Volume (Kilo Tons) Forecast by Form, 2020 to 2035
  • Table 7: Global Market Value (USD Million) Forecast by Application, 2020 to 2035
  • Table 8: Global Market Volume (Kilo Tons) Forecast by Application, 2020 to 2035
  • Table 9: North America Market Value (USD Million) Forecast by Country, 2020 to 2035
  • Table 10: North America Market Volume (Kilo Tons) Forecast by Country, 2020 to 2035
  • Table 11: North America Market Value (USD Million) Forecast by Source, 2020 to 2035
  • Table 12: North America Market Volume (Kilo Tons) Forecast by Source, 2020 to 2035
  • Table 13: North America Market Value (USD Million) Forecast by Form, 2020 to 2035
  • Table 14: North America Market Volume (Kilo Tons) Forecast by Form, 2020 to 2035
  • Table 15: North America Market Value (USD Million) Forecast by Application, 2020 to 2035
  • Table 16: North America Market Volume (Kilo Tons) Forecast by Application, 2020 to 2035
  • Table 17: Latin America Market Value (USD Million) Forecast by Country, 2020 to 2035
  • Table 18: Latin America Market Volume (Kilo Tons) Forecast by Country, 2020 to 2035
  • Table 19: Latin America Market Value (USD Million) Forecast by Source, 2020 to 2035
  • Table 20: Latin America Market Volume (Kilo Tons) Forecast by Source, 2020 to 2035
  • Table 21: Latin America Market Value (USD Million) Forecast by Form, 2020 to 2035
  • Table 22: Latin America Market Volume (Kilo Tons) Forecast by Form, 2020 to 2035
  • Table 23: Latin America Market Value (USD Million) Forecast by Application, 2020 to 2035
  • Table 24: Latin America Market Volume (Kilo Tons) Forecast by Application, 2020 to 2035
  • Table 25: Western Europe Market Value (USD Million) Forecast by Country, 2020 to 2035
  • Table 26: Western Europe Market Volume (Kilo Tons) Forecast by Country, 2020 to 2035
  • Table 27: Western Europe Market Value (USD Million) Forecast by Source, 2020 to 2035
  • Table 28: Western Europe Market Volume (Kilo Tons) Forecast by Source, 2020 to 2035
  • Table 29: Western Europe Market Value (USD Million) Forecast by Form, 2020 to 2035
  • Table 30: Western Europe Market Volume (Kilo Tons) Forecast by Form, 2020 to 2035
  • Table 31: Western Europe Market Value (USD Million) Forecast by Application, 2020 to 2035
  • Table 32: Western Europe Market Volume (Kilo Tons) Forecast by Application, 2020 to 2035
  • Table 33: Eastern Europe Market Value (USD Million) Forecast by Country, 2020 to 2035
  • Table 34: Eastern Europe Market Volume (Kilo Tons) Forecast by Country, 2020 to 2035
  • Table 35: Eastern Europe Market Value (USD Million) Forecast by Source, 2020 to 2035
  • Table 36: Eastern Europe Market Volume (Kilo Tons) Forecast by Source, 2020 to 2035
  • Table 37: Eastern Europe Market Value (USD Million) Forecast by Form, 2020 to 2035
  • Table 38: Eastern Europe Market Volume (Kilo Tons) Forecast by Form, 2020 to 2035
  • Table 39: Eastern Europe Market Value (USD Million) Forecast by Application, 2020 to 2035
  • Table 40: Eastern Europe Market Volume (Kilo Tons) Forecast by Application, 2020 to 2035
  • Table 41: East Asia Market Value (USD Million) Forecast by Country, 2020 to 2035
  • Table 42: East Asia Market Volume (Kilo Tons) Forecast by Country, 2020 to 2035
  • Table 43: East Asia Market Value (USD Million) Forecast by Source, 2020 to 2035
  • Table 44: East Asia Market Volume (Kilo Tons) Forecast by Source, 2020 to 2035
  • Table 45: East Asia Market Value (USD Million) Forecast by Form, 2020 to 2035
  • Table 46: East Asia Market Volume (Kilo Tons) Forecast by Form, 2020 to 2035
  • Table 47: East Asia Market Value (USD Million) Forecast by Application, 2020 to 2035
  • Table 48: East Asia Market Volume (Kilo Tons) Forecast by Application, 2020 to 2035
  • Table 49: South Asia & Pacific Market Value (USD Million) Forecast by Country, 2020 to 2035
  • Table 50: South Asia & Pacific Market Volume (Kilo Tons) Forecast by Country, 2020 to 2035
  • Table 51: South Asia & Pacific Market Value (USD Million) Forecast by Source, 2020 to 2035
  • Table 52: South Asia & Pacific Market Volume (Kilo Tons) Forecast by Source, 2020 to 2035
  • Table 53: South Asia & Pacific Market Value (USD Million) Forecast by Form, 2020 to 2035
  • Table 54: South Asia & Pacific Market Volume (Kilo Tons) Forecast by Form, 2020 to 2035
  • Table 55: South Asia & Pacific Market Value (USD Million) Forecast by Application, 2020 to 2035
  • Table 56: South Asia & Pacific Market Volume (Kilo Tons) Forecast by Application, 2020 to 2035
  • Table 57: Middle East and Africa Market Value (USD Million) Forecast by Country, 2020 to 2035
  • Table 58: Middle East and Africa Market Volume (Kilo Tons) Forecast by Country, 2020 to 2035
  • Table 59: Middle East and Africa Market Value (USD Million) Forecast by Source, 2020 to 2035
  • Table 60: Middle East and Africa Market Volume (Kilo Tons) Forecast by Source, 2020 to 2035
  • Table 61: Middle East and Africa Market Value (USD Million) Forecast by Form, 2020 to 2035
  • Table 62: Middle East and Africa Market Volume (Kilo Tons) Forecast by Form, 2020 to 2035
  • Table 63: Middle East and Africa Market Value (USD Million) Forecast by Application, 2020 to 2035
  • Table 64: Middle East and Africa Market Volume (Kilo Tons) Forecast by Application, 2020 to 2035

List of Figures

  • Figure 1: Global Market Volume (Kilo Tons) Forecast 2020 to 2035
  • Figure 2: Global Market Pricing Analysis
  • Figure 3: Global Market Value (USD Million) Forecast 2020 to 2035
  • Figure 4: Global Market Value Share and BPS Analysis by Source, 2025 and 2035
  • Figure 5: Global Market Y-o-Y Growth Comparison by Source, 2025 to 2035
  • Figure 6: Global Market Attractiveness Analysis by Source
  • Figure 7: Global Market Value Share and BPS Analysis by Form, 2025 and 2035
  • Figure 8: Global Market Y-o-Y Growth Comparison by Form, 2025 to 2035
  • Figure 9: Global Market Attractiveness Analysis by Form
  • Figure 10: Global Market Value Share and BPS Analysis by Application, 2025 and 2035
  • Figure 11: Global Market Y-o-Y Growth Comparison by Application, 2025 to 2035
  • Figure 12: Global Market Attractiveness Analysis by Application
  • Figure 13: Global Market Value (USD Million) Share and BPS Analysis by Region, 2025 and 2035
  • Figure 14: Global Market Y-o-Y Growth Comparison by Region, 2025 to 2035
  • Figure 15: Global Market Attractiveness Analysis by Region
  • Figure 16: North America Market Incremental $ Opportunity, 2025 to 2035
  • Figure 17: Latin America Market Incremental $ Opportunity, 2025 to 2035
  • Figure 18: Western Europe Market Incremental $ Opportunity, 2025 to 2035
  • Figure 19: Eastern Europe Market Incremental $ Opportunity, 2025 to 2035
  • Figure 20: East Asia Market Incremental $ Opportunity, 2025 to 2035
  • Figure 21: South Asia & Pacific Market Incremental $ Opportunity, 2025 to 2035
  • Figure 22: Middle East and Africa Market Incremental $ Opportunity, 2025 to 2035
  • Figure 23: North America Market Value Share and BPS Analysis by Country, 2025 and 2035
  • Figure 24: North America Market Value Share and BPS Analysis by Source, 2025 and 2035
  • Figure 25: North America Market Y-o-Y Growth Comparison by Source, 2025 to 2035
  • Figure 26: North America Market Attractiveness Analysis by Source
  • Figure 27: North America Market Value Share and BPS Analysis by Form, 2025 and 2035
  • Figure 28: North America Market Y-o-Y Growth Comparison by Form, 2025 to 2035
  • Figure 29: North America Market Attractiveness Analysis by Form
  • Figure 30: North America Market Value Share and BPS Analysis by Application, 2025 and 2035
  • Figure 31: North America Market Y-o-Y Growth Comparison by Application, 2025 to 2035
  • Figure 32: North America Market Attractiveness Analysis by Application
  • Figure 33: Latin America Market Value Share and BPS Analysis by Country, 2025 and 2035
  • Figure 34: Latin America Market Value Share and BPS Analysis by Source, 2025 and 2035
  • Figure 35: Latin America Market Y-o-Y Growth Comparison by Source, 2025 to 2035
  • Figure 36: Latin America Market Attractiveness Analysis by Source
  • Figure 37: Latin America Market Value Share and BPS Analysis by Form, 2025 and 2035
  • Figure 38: Latin America Market Y-o-Y Growth Comparison by Form, 2025 to 2035
  • Figure 39: Latin America Market Attractiveness Analysis by Form
  • Figure 40: Latin America Market Value Share and BPS Analysis by Application, 2025 and 2035
  • Figure 41: Latin America Market Y-o-Y Growth Comparison by Application, 2025 to 2035
  • Figure 42: Latin America Market Attractiveness Analysis by Application
  • Figure 43: Western Europe Market Value Share and BPS Analysis by Country, 2025 and 2035
  • Figure 44: Western Europe Market Value Share and BPS Analysis by Source, 2025 and 2035
  • Figure 45: Western Europe Market Y-o-Y Growth Comparison by Source, 2025 to 2035
  • Figure 46: Western Europe Market Attractiveness Analysis by Source
  • Figure 47: Western Europe Market Value Share and BPS Analysis by Form, 2025 and 2035
  • Figure 48: Western Europe Market Y-o-Y Growth Comparison by Form, 2025 to 2035
  • Figure 49: Western Europe Market Attractiveness Analysis by Form
  • Figure 50: Western Europe Market Value Share and BPS Analysis by Application, 2025 and 2035
  • Figure 51: Western Europe Market Y-o-Y Growth Comparison by Application, 2025 to 2035
  • Figure 52: Western Europe Market Attractiveness Analysis by Application
  • Figure 53: Eastern Europe Market Value Share and BPS Analysis by Country, 2025 and 2035
  • Figure 54: Eastern Europe Market Value Share and BPS Analysis by Source, 2025 and 2035
  • Figure 55: Eastern Europe Market Y-o-Y Growth Comparison by Source, 2025 to 2035
  • Figure 56: Eastern Europe Market Attractiveness Analysis by Source
  • Figure 57: Eastern Europe Market Value Share and BPS Analysis by Form, 2025 and 2035
  • Figure 58: Eastern Europe Market Y-o-Y Growth Comparison by Form, 2025 to 2035
  • Figure 59: Eastern Europe Market Attractiveness Analysis by Form
  • Figure 60: Eastern Europe Market Value Share and BPS Analysis by Application, 2025 and 2035
  • Figure 61: Eastern Europe Market Y-o-Y Growth Comparison by Application, 2025 to 2035
  • Figure 62: Eastern Europe Market Attractiveness Analysis by Application
  • Figure 63: East Asia Market Value Share and BPS Analysis by Country, 2025 and 2035
  • Figure 64: East Asia Market Value Share and BPS Analysis by Source, 2025 and 2035
  • Figure 65: East Asia Market Y-o-Y Growth Comparison by Source, 2025 to 2035
  • Figure 66: East Asia Market Attractiveness Analysis by Source
  • Figure 67: East Asia Market Value Share and BPS Analysis by Form, 2025 and 2035
  • Figure 68: East Asia Market Y-o-Y Growth Comparison by Form, 2025 to 2035
  • Figure 69: East Asia Market Attractiveness Analysis by Form
  • Figure 70: East Asia Market Value Share and BPS Analysis by Application, 2025 and 2035
  • Figure 71: East Asia Market Y-o-Y Growth Comparison by Application, 2025 to 2035
  • Figure 72: East Asia Market Attractiveness Analysis by Application
  • Figure 73: South Asia & Pacific Market Value Share and BPS Analysis by Country, 2025 and 2035
  • Figure 74: South Asia & Pacific Market Value Share and BPS Analysis by Source, 2025 and 2035
  • Figure 75: South Asia & Pacific Market Y-o-Y Growth Comparison by Source, 2025 to 2035
  • Figure 76: South Asia & Pacific Market Attractiveness Analysis by Source
  • Figure 77: South Asia & Pacific Market Value Share and BPS Analysis by Form, 2025 and 2035
  • Figure 78: South Asia & Pacific Market Y-o-Y Growth Comparison by Form, 2025 to 2035
  • Figure 79: South Asia & Pacific Market Attractiveness Analysis by Form
  • Figure 80: South Asia & Pacific Market Value Share and BPS Analysis by Application, 2025 and 2035
  • Figure 81: South Asia & Pacific Market Y-o-Y Growth Comparison by Application, 2025 to 2035
  • Figure 82: South Asia & Pacific Market Attractiveness Analysis by Application
  • Figure 83: Middle East and Africa Market Value Share and BPS Analysis by Country, 2025 and 2035
  • Figure 84: Middle East and Africa Market Value Share and BPS Analysis by Source, 2025 and 2035
  • Figure 85: Middle East and Africa Market Y-o-Y Growth Comparison by Source, 2025 to 2035
  • Figure 86: Middle East and Africa Market Attractiveness Analysis by Source
  • Figure 87: Middle East and Africa Market Value Share and BPS Analysis by Form, 2025 and 2035
  • Figure 88: Middle East and Africa Market Y-o-Y Growth Comparison by Form, 2025 to 2035
  • Figure 89: Middle East and Africa Market Attractiveness Analysis by Form
  • Figure 90: Middle East and Africa Market Value Share and BPS Analysis by Application, 2025 and 2035
  • Figure 91: Middle East and Africa Market Y-o-Y Growth Comparison by Application, 2025 to 2035
  • Figure 92: Middle East and Africa Market Attractiveness Analysis by Application
  • Figure 93: Global Market - Tier Structure Analysis
  • Figure 94: Global Market - Company Share Analysis

Frequently Asked Questions

What is the projected size of microbial lipase market in 2025?

The market is valued at USD 653.5 million in 2025.

What is the CAGR of the microbial lipase market from 2025 to 2035?

The market is expected to grow at a CAGR of 6.8% during 2025 to 2035.

What is the projected value of microbial lipase market by 2035?

The market is projected to reach a value of USD 1,266.0 million by 2035.

Which source segment holds the largest share in microbial lipase market?

Fungi-derived species hold the largest market share among sources in 2025, accounting for approximately 48.9% of the market.

Which form segment leads the microbial lipase market?

Powder is the leading form in 2025, holding 58.2% market share.

Explore Similar Insights

Future Market Insights

Microbial Lipase Market