Pulmonary Fibrosis Biomarker Market Size and Share Forecast Outlook (2024 to 2034)

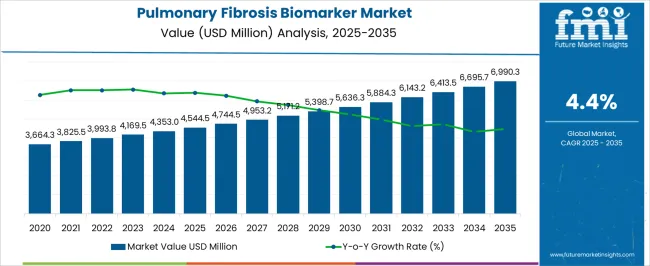
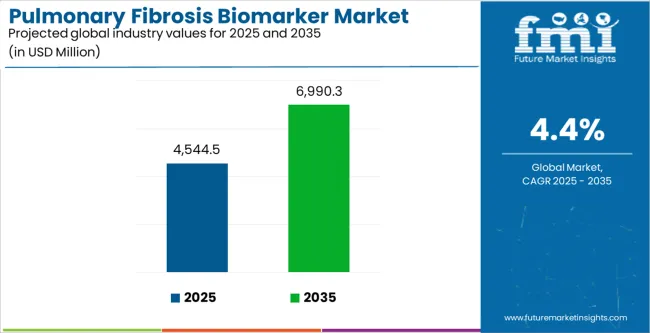
Sales of pulmonary fibrosis biomarkers are expected to accelerate at a CAGR of 4.4% from 2024 to 2034. The pulmonary fibrosis biomarker market is projected to increase from USD 4,353.0 million in 2024 to USD 6,538.4 million by 2034. The market was valued at USD 4,149.0 million in 2023.

Increased developments in pulmonary fibrosis biomarkers, making it easier to find and validate new biomarkers and integrate them into clinical practice, contribute to the market expansion of pulmonary fibrosis biomarkers. The market is witnessing growth due to the application of bioinformatics tools and the development of high-throughput screening techniques.

Attributes Details
Pulmonary Fibrosis Biomarker Market Size (2024) USD 4,353.0 million
Expected Market Size (2034) USD 6,538.4 million
CAGR (2024 to 2034) 4.4%

Forces Driving Growth in the Pulmonary Fibrosis Biomarker Market

  • The pulmonary fibrosis biomarker market is expanding because regulatory frameworks support the development and approval of biomarkers for the diagnosis, prognosis, and treatment monitoring of pulmonary fibrosis.
  • Age-related illnesses like pulmonary fibrosis are prevalent as the world's population ages, which contributes to the demand for pulmonary fibrosis biomarkers that help to manage the disease in older populations.
  • Patient organizations' advocacy efforts stimulate the demand for biomarkers, which are increasing public awareness of pulmonary fibrosis and pushing for better monitoring and diagnostic technologies.
  • Continuous investigation into new biomarkers and their correlation with pulmonary fibrosis broadens the array of choices and propels market expansion of pulmonary fibrosis biomarkers.

Limiting Factors Affecting Pulmonary Fibrosis Biomarker Market Growth

  • The high expense of biomarker discovery, development, and validation and the unpredictability of reimbursement rules hamper investment in research and development.
  • Though great progress has been made, much remains to be understood about the underlying mechanisms of pulmonary fibrosis. This incomplete knowledge makes it challenging to find and validate trustworthy biomarkers.
  • To accurately identify and track pulmonary fibrosis, many of the biomarkers presently studied lack the necessary specificity and sensitivity, resulting in false positives or negatives and lowering their therapeutic usefulness.
  • Biomarker validation and certification comply with strict regulations, which impedes the release of new biomarkers. This impedes the market growth.
Attributes Details
Pulmonary Fibrosis Biomarker Market Value (2018) USD 3,330.6 million
Estimated Market Value for 2023 USD 4,149.0 million
CAGR from 2019 to 2023 4.5%

Growth Avenues in the Pulmonary Fibrosis Biomarker Market

  • The prevalence of pulmonary fibrosis is rising worldwide. It is a progressive illness with a high death rate. Aging populations, changing lifestyles, and environmental concerns are the primary contributors to this trend.
  • Regulatory bodies increasingly acknowledge the significance of biomarkers in medication development and clinical practice. There are opportunities for pulmonary fibrosis biomarker market expansion due to initiatives to expedite the regulatory approval procedure for biomarker-based treatments and diagnostics.
  • In addition to diagnostic businesses, the demand for pulmonary fibrosis biomarkers includes pharmaceutical companies, biotechnology companies, contract research organizations, and academic institutions. This varied ecosystem aids innovation and market expansion of pulmonary fibrosis biomarkers.

Pulmonary Fibrosis Biomarker Market Outlook by Category

Consumer Preference for Imaging Tests

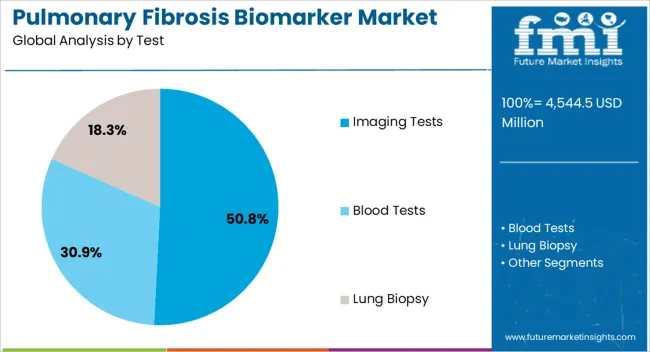
Top Type Segment Share (2024)
Imaging Tests 50.8%
  • The preference for imaging tests continues to rise because imaging facilities are available in different healthcare settings, accelerating the market growth.
  • The capacity of imaging tests to offer real-time information and enable prompt treatment decisions that encourage their increased adoption of pulmonary fibrosis biomarkers.
  • Imaging tests are widely accepted and dominate the market since they are less expensive than invasive alternatives.
  • In contrast to invasive procedures like lung biopsies, imaging tests provide non-invasive assessment, lowering patient discomfort and risk.

Use of Pulmonary Fibrosis Biomarkers for Early Identification and Monitoring of Idiopathic Pulmonary Fibrosis (IPF)

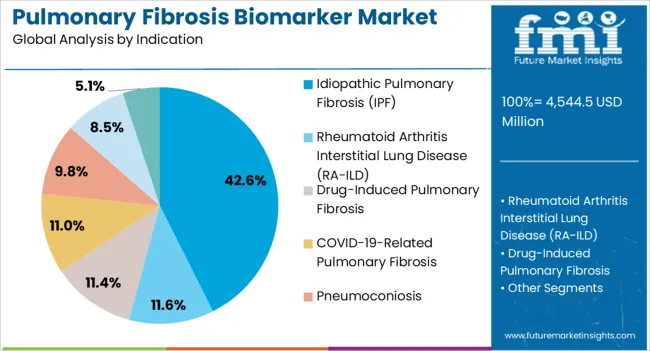
Top Indication Segment Share (2024)
Idiopathic pulmonary fibrosis (IPF) 42.6%
  • Due to the aging population, one of the main risk factors for IPF, there is an increasing demand for pulmonary fibrosis biomarkers for early identification and monitoring.
  • Diagnostic innovations that identify IDF at an early stage, allowing for timely management and mitigation of disease development, are aided by market expansion.
  • The fact that there are few choices for treating idiopathic pulmonary fibrosis highlights the pulmonary fibrosis biomarker demand to enable tailored treatments and enhance patient outcomes.

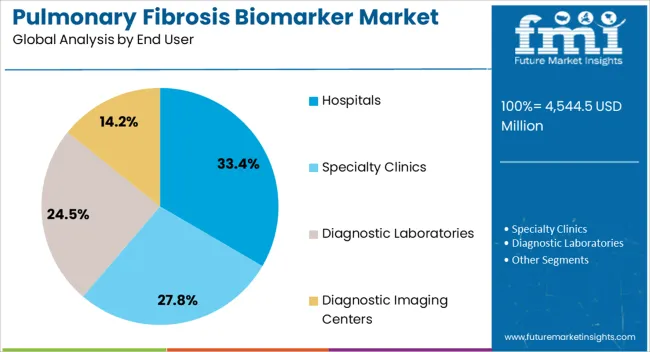
Wider Adoption of Pulmonary Fibrosis Biomarkers in Hospitals

Top End User Segment Share (2024)
Hospitals 33.4%
  • The integration of hospitals with the current healthcare system encourages the widespread adoption of pulmonary fibrosis biomarker testing.
  • Hospitals frequently act as referral hubs, streamlining diagnostic processes and boosting their market share in the pulmonary fibrosis biomarker sector.
  • Hospitals are positioned as major pulmonary fibrosis biomarker market growth catalysts because of the established trust that affects patient compliance with biomarker testing.

Analysis of Key Countries in the Pulmonary Fibrosis Biomarker Market

This section examines the pulmonary fibrosis biomarker markets in several significant economies, such as the United States, Spain, the United Kingdom, India, and China. It also explores different factors that influence pulmonary fibrosis biomarker demand, adoption, and sales across these countries.
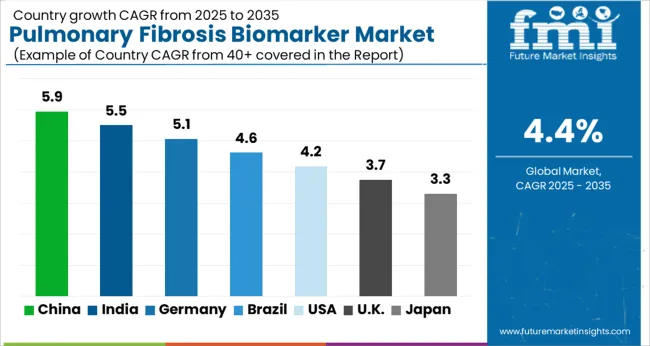
Country CAGR (2024 to 2034)
China 11.4%
India 6.9%
Spain 8.2%
United States 3.5%
Germany 5.5%

Pulmonary Fibrosis Biomarker Industry in China

  • China's leadership in the pulmonary fibrosis biomarker market results from the cooperation between Chinese research institutions and multinational pharmaceutical companies, which promotes a cross-cultural exchange of expertise.
  • China is at the pinnacle of pulmonary fibrosis research due to government initiatives and funding in precision medicine programs that push the adoption of cutting-edge biomarker technology.
  • China's quick advances greatly aid the discovery and validation of novel pulmonary fibrosis biomarkers in machine learning and artificial intelligence.

Pulmonary Fibrosis Biomarker Industry in India

  • The demand for pulmonary fibrosis biomarkers is receiving greater attention in India due to a rise in the prevalence of respiratory disorders and increased knowledge among medical professionals.
  • Governmental programs that encourage domestic research and development enhance India's ability to provide advanced biomarkers adapted to the particular requirements of the regional pulmonary fibrosis patient group.
  • India's economical biomarker research projects support the global endeavor to lower costs and increase the adoption of pulmonary fibrosis diagnostics.

Pulmonary Fibrosis Biomarker Industry in Spain

  • An increasing network of research collaborations encouraging a collaborative approach to biomarker development improves Spain's pulmonary fibrosis biomarker market.
  • Due to its participation in international clinical trials, Spain is positioned to play a key role in the global quest for credible pulmonary fibrosis biomarkers.
  • Spain's stance in the pulmonary fibrosis biomarker landscape is improved by changing reimbursement policies and providing more financing for respiratory research programs.

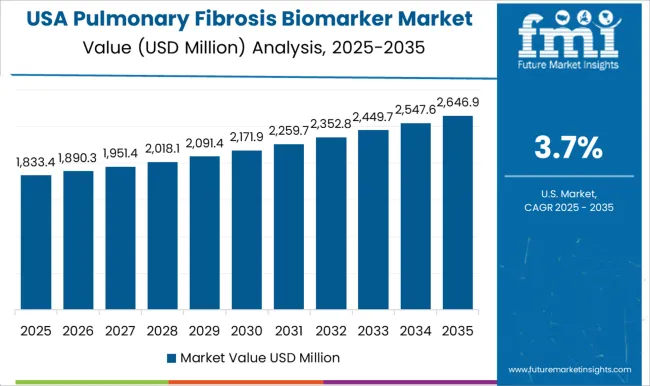
Pulmonary Fibrosis Biomarker Industry in the United States

  • Significant clinical trials and a strong healthcare infrastructure influence the shifting landscape of pulmonary fibrosis biomarker discovery in the United States.
  • The demand for pulmonary fibrosis biomarkers is increasing in the United States due to increased awareness among patients and medical professionals.
  • The United States is positioned as a major market influencer owing to regulatory initiatives like expedited approval processes that accelerate the use of innovative biomarkers.

Pulmonary Fibrosis Biomarker Industry in the United Kingdom

  • Patient organizations and strong advocacy groups shape research priorities and ensure that pulmonary fibrosis biomarkers are relevant in the United Kingdom's healthcare system.
  • The United Kingdom is committed to providing patient-friendly diagnostic solutions, reflected in the collaborative efforts between academia and industry to develop noninvasive biomarkers.
  • The adoption of advanced pulmonary fibrosis diagnostic methods in the United Kingdom has accelerated the National Health Service's (NHS) integration of biomarkers into ordinary clinical practice.

Competitive Landscape of the Pulmonary Fibrosis Biomarker Market

Key pulmonary fibrosis biomarker manufacturers significantly shape the sector's competitive landscape. Known for its dedication to innovation, Biogen welcomes Veracyte, which is one of the significant pulmonary fibrosis biomarker providers, emphasizing cutting-edge diagnostic solutions.

Galapagos NV offers its advantages to the market, while Genentech, a Roche company, adds its pharmaceutical knowledge. Biocartis and Myriad Genetics are essential in pulmonary fibrosis biomarkers since they offer specific solutions.

These key pulmonary fibrosis biomarker vendors work together to enhance research and development, which supports the market's general expansion and development for pulmonary fibrosis biomarkers. Their combined efforts highlight the pulmonary fibrosis biomarker industry's dynamic nature as it continues to tackle the difficulties related to pulmonary fibrosis.

Latest Advancements

  • To provide Oklahomans with the newest diagnostic and therapeutic equipment, O.U. Health, a comprehensive academic health system, and Siemens Healthineers, a leader in medical technology, announced a strategic 10-year value partnership in December 2023.
  • Thermo Fisher Scientific and AstraZeneca collaborated in January 2023 to create a companion diagnostic test for Tagrisso based on solid tissue and blood. With its global presence, Thermo Fisher Scientific can service a wide range of clients and take advantage of expansion prospects worldwide.
  • A deal to buy all of the outstanding shares of Curiosity Diagnostics from Scope Fluidics, S.A., was announced by Bio-Rad Laboratories, Inc. in August 2022. The deal could be worth up to USD 170 million, with roughly USD 100 million going toward cash and another USD 70 million coming from future milestone payments.
  • Biogen Inc. agreed to pay a total of USD 900 million in September 2022 to settle allegations that it gave doctors payments to persuade them to prescribe Biogen drugs, which resulted in the doctors making false claims with Medicare and Medicaid.

Leading Pulmonary Fibrosis Biomarker Vendors

  • Biogen
  • Veracyte
  • Genentech (Roche)
  • Galapagos NV
  • Biocartis
  • Myriad Genetics

Segmentation Analysis of the Pulmonary Fibrosis Biomarker Market

By Test:

  • Blood Tests
    • C-reactive Protein Testing Kits
    • Antibody Testing Kits
      • Antinuclear Antibodies (ANA) Test
      • Anti-CCP antibody testing
    • ESR Tests and CBC
  • Imaging Tests
    • X-rays Scans
    • HRCT Scans
  • Lung Biopsy

By Indication:

  • Idiopathic pulmonary fibrosis (IPF)
  • Rheumatoid Arthritis Interstitial Lung Disease (RA-ILD)
  • Drug-induced pulmonary fibrosis
  • COVID-19-related pulmonary fibrosis
  • Pneumoconiosis
  • Sarcoidosis
  • Others

By End User:

  • Hospitals
  • Specialty Clinics
  • Diagnostic Laboratories
  • Diagnostic Imaging Centers

By Region:

  • North America
  • Latin America
  • East Asia
  • South Asia and Pacific
  • Western Europe
  • Eastern Europe
  • Middle East Asia

Table of Content

  • 1. Executive Summary
  • 2. Market Overview
  • 3. Key Market Trends
  • 4. Value Added Insights
  • 5. Market Background
  • 6. Global Market Demand (in Value or Size in USD Million) Analysis 2018 to 2023 and Forecast, 2024 to 2034
  • 7. Global Market Analysis 2018 to 2023 and Forecast 2024 to 2034, By Test Type
    • 7.1. Blood Tests:
      • 7.1.1. C-Reactive Protein Testing Kits
      • 7.1.2. Antibody Testing Kits
        • 7.1.2.1. Antinuclear Antibodies (ANA) Test
        • 7.1.2.2. Anti-CCP antibody testing
      • 7.1.3. ESR Tests and CBC
    • 7.2. Imaging Tests
      • 7.2.1. X-rays Scans
      • 7.2.2. HRCT Scans
    • 7.3. Lung Biopsy
  • 8. Global Market Analysis 2018 to 2023 and Forecast 2024 to 2034, By Indication
    • 8.1. Idiopathic Pulmonary Fibrosis (IPF)
    • 8.2. Rheumatoid Arthritis Interstitial Lung Disease (RA-ILD)
    • 8.3. Drug-induced Pulmonary Fibrosis
    • 8.4. COVID-19-related Pulmonary Fibrosis
    • 8.5. Pneumoconiosis
    • 8.6. Sarcoidosis
    • 8.7. Others
  • 9. Global Market Analysis 2018 to 2023 and Forecast 2024 to 2034, By End User
    • 9.1. Hospitals
    • 9.2. Specialty Clinics
    • 9.3. Diagnostic Laboratories
    • 9.4. Diagnostic Imaging Centers
  • 10. Global Market Analysis 2018 to 2023 and Forecast 2024 to 2034, By Region
    • 10.1. North America
    • 10.2. Latin America
    • 10.3. East Asia
    • 10.4. South Asia and Pacific
    • 10.5. Western Europe
    • 10.6. Eastern Europe
    • 10.7. Middle East and Africa
  • 11. North America Market Analysis 2018 to 2023 and Forecast 2024 to 2034
  • 12. Latin America Market Analysis 2018 to 2023 and Forecast 2024 to 2034
  • 13. East Asia Market Analysis 2018 to 2023 and Forecast 2024 to 2034
  • 14. South Asia and Pacific Market Analysis 2018 to 2023 and Forecast 2024 to 2034
  • 15. Western Europe Market Analysis 2018 to 2023 and Forecast 2024 to 2034
  • 16. Eastern Europe Market Analysis 2018 to 2023 and Forecast 2024 to 2034
  • 17. Middle East and Africa Market Analysis 2018 to 2023 and Forecast 2024 to 2034
  • 18. Market Structure Analysis
  • 19. Competition Analysis
    • 19.1. Roche Diagnostics
    • 19.2. Siemens Healthineers
    • 19.3. Bio-Rad Laboratories
    • 19.4. Eagle Biosciences, Inc.
    • 19.5. Biogenix Inc. Pvt. Ltd.
    • 19.6. Diagnostic Automation/Cortez Diagnostics Inc.
    • 19.7. BioSupply Ltd.
    • 19.8. Bio-Diagnostics Ltd.
    • 19.9. MERIDIAN BIOSCIENCE
    • 19.10. Weldon Biotech, Inc.
    • 19.11. Getein Biotech, Inc.
    • 19.12. Creative Diagnostics
    • 19.13. Beijing Strong Biotechnologies, Inc.
    • 19.14. Merck KGaA
    • 19.15. CTK Biotech, Inc.
    • 19.16. Personal Diagnostics
    • 19.17. Thermo Fisher Scientific Inc.
  • 20. Assumptions and Acronyms Used
  • 21. Research Methodology

List of Tables

Table 01: Global Market Value (US$ Million) Analysis and Forecast, by Test

Table 03: Global Market Value (US$ Million) Analysis and Forecast 2018 to 2034, by Indication

Table 04: Global Market Value (US$ Million) Analysis and Forecast 2018 to 2034, by End User

Table 05: Global Market Value (US$ Million) Analysis and Forecast 2018 to 2034, by Region

Table 06: North America Market Value (US$ Million) Analysis 2018 to 2023 and Forecast 2024 to 2034, by Country

Table 07: North America Market Value (US$ Million) Analysis and Forecast 2018 to 2034, by Test

Table 08: North America Market Value (US$ Million) Analysis and Forecast 2018 to 2034, by Indication

Table 09: North America Market Value (US$ Million) Analysis and Forecast 2018 to 2034, by End User

Table 10: Latin America Market Value (US$ Million) Analysis 2018 to 2023 and Forecast 2024 to 2034, by Country

Table 11: Latin America Market Value (US$ Million) Analysis and Forecast 2018 to 2034, by Test

Table 12: Latin America Market Value (US$ Million) Analysis and Forecast 2018 to 2034, by Indication

Table 13: Latin America Market Value (US$ Million) Analysis and Forecast 2018 to 2034, by End User

Table 14: East Asia Market Value (US$ Million) Analysis 2018 to 2023 and Forecast 2024 to 2034, by Country

Table 15: East Asia Market Value (US$ Million) Analysis and Forecast 2018 to 2034, by Test

Table 16: East Asia Market Value (US$ Million) Analysis and Forecast 2018 to 2034, by Indication

Table 17: East Asia Market Value (US$ Million) Analysis and Forecast 2018 to 2034, by End User

Table 18: South Asia and Pacific Market Value (US$ Million) Analysis 2018 to 2023 and Forecast 2024 to 2034, by Country

Table 19: South Asia and Pacific Market Value (US$ Million) Analysis and Forecast 2018 to 2034, by Test

Table 20: South Asia and Pacific Market Value (US$ Million) Analysis and Forecast 2018 to 2034, by Indication

Table 21: South Asia and Pacific Market Value (US$ Million) Analysis and Forecast 2018 to 2034, by End User

Table 22: Western Europe Market Value (US$ Million) Analysis 2018 to 2023 and Forecast 2024 to 2034, by Country

Table 23: Western Europe Market Value (US$ Million) Analysis and Forecast 2018 to 2034, by Test

Table 24: Western Europe Market Value (US$ Million) Analysis and Forecast 2018 to 2034, by Indication

Table 25: Western Europe Market Value (US$ Million) Analysis and Forecast 2018 to 2034, by End User

Table 26: Eastern Europe Market Value (US$ Million) Analysis 2018 to 2023 and Forecast 2024 to 2034, by Country

Table 27: Eastern Europe Market Value (US$ Million) Analysis and Forecast 2018 to 2034, by Test

Table 28: Eastern Europe Market Value (US$ Million) Analysis and Forecast 2018 to 2034, by Indication

Table 29: Eastern Europe Market Value (US$ Million) Analysis and Forecast 2018 to 2034, by End User

Table 30: Middle East and Africa Market Value (US$ Million) Analysis 2018 to 2023 and Forecast 2024 to 2034, by Country

Table 31: Middle East and Africa Market Value (US$ Million) Analysis and Forecast 2018 to 2034, by Test

Table 32: Middle East and Africa Market Value (US$ Million) Analysis and Forecast 2018 to 2034, by Indication

Table 33: Middle East and Africa Market Value (US$ Million) Analysis and Forecast 2018 to 2034, by End User

List of Figures

Figure 1: Global Market Value (US$ Million) Analysis, 2018 to 2023

Figure 2: Global Market Forecast and Y-o-Y Growth, 2024 to 2034

Figure 3: Global Market Absolute $ Opportunity (US$ Million) Analysis, 2023 to 2034

Figure 4: Global Market Value Share (%) Analysis 2023 and 2034, by Test

Figure 5: Global Market Y-o-Y Growth (%) Analysis 2024 to 2034, by Test

Figure 6: Global Market Attractiveness Analysis 2024 to 2034, by Test

Figure 7: Global Market Value Share (%) Analysis 2023 and 2034, by Indication

Figure 8: Global Market Y-o-Y Growth (%) Analysis 2024 to 2034, by Indication

Figure 9: Global Market Attractiveness Analysis 2024 to 2034, by Indication

Figure 10: Global Market Value Share (%) Analysis 2023 and 2034, by End User

Figure 11: Global Market Y-o-Y Growth (%) Analysis 2024 to 2034, by End User

Figure 12: Global Market Attractiveness Analysis 2024 to 2034, by End User

Figure 13: Global Market Value Share (%) Analysis 2023 and 2034, by Region

Figure 14: Global Market Y-o-Y Growth (%) Analysis 2024 to 2034, by Region

Figure 15: Global Market Attractiveness Analysis 2024 to 2034, by Region

Figure 16: North America Market Value (US$ Million) Analysis, 2018 to 2023

Figure 17: North America Market Value (US$ Million) Forecast, 2024 to 2034

Figure 18: North America Market Value Share, by Test (2024 E)

Figure 19: North America Market Value Share, by Indication (2024 E)

Figure 20: North America Market Value Share, by End User (2024 E)

Figure 21: North America Market Value Share, by Country (2024 E)

Figure 22: North America Market Attractiveness Analysis by Test, 2024 to 2034

Figure 23: North America Market Attractiveness Analysis by Indication, 2024 to 2034

Figure 24: North America Market Attractiveness Analysis by End User, 2024 to 2034

Figure 25: North America Market Attractiveness Analysis by Country, 2024 to 2034

Figure 26: USA Market Value Proportion Analysis, 2023

Figure 27: Global Vs. USA Growth Comparison, 2024 to 2034

Figure 28: USA Market Share Analysis (%) by Test, 2024 to 2034

Figure 29: USA Market Share Analysis (%) by Indication, 2024 to 2034

Figure 30: USA Market Share Analysis (%) by End User, 2024 to 2034

Figure 31: Canada Market Value Proportion Analysis, 2023

Figure 32: Global Vs. Canada. Growth Comparison, 2024 to 2034

Figure 33: Canada Market Share Analysis (%) by Test, 2024 and 2034

Figure 34: Canada Market Share Analysis (%) by Indication, 2024 to 2034

Figure 35: Canada Market Share Analysis (%) by End User, 2024 to 2034

Figure 36: Mexico Market Value Proportion Analysis, 2023

Figure 37: Global Vs. Mexico Growth Comparison, 2024 to 2034

Figure 38: Mexico Market Share Analysis (%) by Test, 2024 to 2034

Figure 39: Mexico Market Share Analysis (%) by Indication, 2024 to 2034

Figure 40: Mexico Market Share Analysis (%) by End User, 2024 to 2034

Figure 41: Latin America Market Value (US$ Million) Analysis, 2018 to 2023

Figure 42: Latin America Market Value (US$ Million) Forecast, 2024 to 2034

Figure 43: Latin America Market Value Share, by Test (2024 E)

Figure 44: Latin America Market Value Share, by Indication (2024 E)

Figure 45: Latin America Market Value Share, by End User (2024 E)

Figure 46: Latin America Market Value Share, by Country (2024 E)

Figure 47: Latin America Market Attractiveness Analysis by Test, 2024 to 2034

Figure 48: Latin America Market Attractiveness Analysis by Indication, 2024 to 2034

Figure 49: Latin America Market Attractiveness Analysis by End User, 2024 to 2034

Figure 50: Latin America Market Attractiveness Analysis by Country, 2024 to 2034

Figure 51: Brazil Market Value Proportion Analysis, 2023

Figure 52: Global Vs. Brazil. Growth Comparison, 2024 to 2034

Figure 53: Brazil Market Share Analysis (%) by Test, 2024 to 2034

Figure 54: Brazil Market Share Analysis (%) by Indication, 2024 to 2034

Figure 55: Brazil Market Share Analysis (%) by End User, 2024 to 2034

Figure 56: Chile Market Value Proportion Analysis, 2023

Figure 57: Global Vs. Chile Growth Comparison, 2024 to 2034

Figure 58: Chile Market Share Analysis (%) by Test, 2024 to 2034

Figure 59: Chile Market Share Analysis (%) by Indication, 2024 to 2034

Figure 60: Chile Market Share Analysis (%) by End User, 2024 to 2034

Figure 61: East Asia Market Value (US$ Million) Analysis, 2018 to 2023

Figure 62: East Asia Market Value (US$ Million) Forecast, 2024 to 2034

Figure 63: East Asia Market Value Share, by Test (2024 E)

Figure 64: East Asia Market Value Share, by Indication (2024 E)

Figure 65: East Asia Market Value Share, by End User (2024 E)

Figure 66: East Asia Market Value Share, by Country (2024 E)

Figure 67: East Asia Market Attractiveness Analysis by Test, 2024 to 2034

Figure 68: East Asia Market Attractiveness Analysis by Indication, 2024 to 2034

Figure 69: East Asia Market Attractiveness Analysis by End User, 2024 to 2034

Figure 70: East Asia Market Attractiveness Analysis by Country, 2024 to 2034

Figure 71: China Market Value Proportion Analysis, 2023

Figure 72: Global Vs. China Growth Comparison, 2024 to 2034

Figure 73: China Market Share Analysis (%) by Test, 2024 to 2034

Figure 74: China Market Share Analysis (%) by Indication, 2024 to 2034

Figure 75: China Market Share Analysis (%) by End User, 2024 to 2034

Figure 76: Japan Market Value Proportion Analysis, 2023

Figure 77: Global Vs. Japan Growth Comparison, 2024 to 2034

Figure 78: Japan Market Share Analysis (%) by Test, 2024 to 2034

Figure 79: Japan Market Share Analysis (%) by Indication, 2024 to 2034

Figure 80: Japan Market Share Analysis (%) by End User, 2024 to 2034

Figure 81: South Korea Market Value Proportion Analysis, 2023

Figure 82: Global Vs South Korea Growth Comparison, 2024 to 2034

Figure 83: South Korea Market Share Analysis (%) by Test, 2024 to 2034

Figure 84: South Korea Market Share Analysis (%) by Indication, 2023 to 2034

Figure 85: South Korea Market Share Analysis (%) by End User, 2024 to 2034

Figure 86: South Asia and Pacific Market Value (US$ Million) Analysis, 2018 to 2023

Figure 87: South Asia and Pacific Market Value (US$ Million) Forecast, 2024 to 2034

Figure 88: South Asia and Pacific Market Value Share, by Test (2024 E)

Figure 89: South Asia and Pacific Market Value Share, by Indication (2024E)

Figure 90: South Asia and Pacific Market Value Share, by End User (2024 E)

Figure 91: South Asia and Pacific Market Value Share, by Country (2024 E)

Figure 92: South Asia and Pacific Market Attractiveness Analysis by Test, 2024 to 2034

Figure 93: South Asia and Pacific Market Attractiveness Analysis by Indication, 2024 to 2034

Figure 94: South Asia and Pacific Market Attractiveness Analysis by End User, 2024 to 2034

Figure 95: South Asia and Pacific Market Attractiveness Analysis by Country, 2024 to 2034

Figure 96: India Market Value Proportion Analysis, 2023

Figure 97: Global Vs. India Growth Comparison, 2024 to 2034

Figure 98: India Market Share Analysis (%) by Test, 2024 to 2034

Figure 99: India Market Share Analysis (%) by Indication, 2024 to 2034

Figure 100: India Market Share Analysis (%) by End User, 2024 to 2034

Figure 101: ASEAN Countries Market Value Proportion Analysis, 2023

Figure 102: Global Vs. ASEAN Countries Growth Comparison, 2024 to 2034

Figure 103: ASEAN Countries Market Share Analysis (%) by Test, 2024 to 2034

Figure 104: ASEAN Countries Market Share Analysis (%) by Indication, 2024 to 2034

Figure 105: ASEAN Countries Market Share Analysis (%) by End User, 2024 to 2034

Figure 106: Australia and New Zealand Market Value Proportion Analysis, 2023

Figure 107: Global Vs. Australia and New Zealand Growth Comparison, 2024 to 2034

Figure 108: Australia and New Zealand Market Share Analysis (%) by Test, 2023 and2034

Figure 109: Australia and New Zealand Market Share Analysis (%) by Indication, 2024 to 2034

Figure 110: Australia and New Zealand Market Share Analysis (%) by End User, 2023 and2034

Figure 111: Western Europe Market Value (US$ Million) Analysis, 2018 to 2023

Figure 112: Western Europe Market Value (US$ Million) Forecast, 2024 to 2034

Figure 113: Western Europe Market Value Share, by Test (2024 E)

Figure 114: Western Europe Market Value Share, by Indication (2024 E)

Figure 115: Western Europe Market Value Share, by End User (2024 E)

Figure 116: Western Europe Market Value Share, by Country (2024 E)

Figure 117: Western Europe Market Attractiveness Analysis by Test, 2024 to 2034

Figure 118: Western Europe Market Attractiveness Analysis by Indication, 2024 to 2034

Figure 119: Western Europe Market Attractiveness Analysis by End User, 2024 to 2034

Figure 120: Western Europe Market Attractiveness Analysis by Country, 2024 to 2034

Figure 121: UK Market Value Proportion Analysis, 2023

Figure 122: Global Vs. UK Growth Comparison, 2024 to 2034

Figure 123: UK Market Share Analysis (%) by Test, 2024 to 2034

Figure 124: UK Market Share Analysis (%) by Indication, 2024 to 2034

Figure 125: UK Market Share Analysis (%) by End User, 2024 to 2034

Figure 126: Germany Market Value Proportion Analysis, 2023

Figure 127: Global Vs. Germany Growth Comparison, 2024 to 2034

Figure 128: Germany Market Share Analysis (%) by Test, 2024 to 2034

Figure 129: Germany Market Share Analysis (%) by Indication, 2024 to 2034

Figure 130: Germany Market Share Analysis (%) by End User, 2024 to 2034

Figure 131: Italy Market Value Proportion Analysis, 2023

Figure 132: Global Vs. Italy Growth Comparison, 2024 to 2034

Figure 133: Italy Market Share Analysis (%) by Test, 2024 to 2034

Figure 134: Italy Market Share Analysis (%) by Indication, 2024 to 2034

Figure 135: Italy Market Share Analysis (%) by End User, 2024 to 2034

Figure 136: France Market Value Proportion Analysis, 2023

Figure 137: Global Vs France Growth Comparison, 2024 to 2034

Figure 138: France Market Share Analysis (%) by Test, 2024 to 2034

Figure 139: France Market Share Analysis (%) by Indication, 2024 to 2034

Figure 140: France Market Share Analysis (%) by End User, 2024 to 2034

Figure 141: Spain Market Value Proportion Analysis, 2023

Figure 142: Global Vs Spain Growth Comparison, 2024 to 2034

Figure 143: Spain Market Share Analysis (%) by Test, 2024 to 2034

Figure 144: Spain Market Share Analysis (%) by Indication, 2024 to 2034

Figure 145: Spain Market Share Analysis (%) by End User, 2024 to 2034

Figure 146: Nordic Countries Market Value Proportion Analysis, 2023

Figure 147: Global Vs Nordic Countries Growth Comparison, 2024 to 2034

Figure 148: Nordic Countries Market Share Analysis (%) by Test, 2024 to 2034

Figure 149: Nordic Countries Market Share Analysis (%) by Indication, 2024 to 2034

Figure 150: Nordic Countries Market Share Analysis (%) by End User, 2024 to 2034

Figure 151: BENELUX Market Value Proportion Analysis, 2023

Figure 152: Global Vs BENELUX Growth Comparison, 2024 to 2034

Figure 153: BENELUX Market Share Analysis (%) by Test, 2024 to 2034

Figure 154: BENELUX Market Share Analysis (%) by Indication, 2024 to 2034

Figure 155: BENELUX Market Share Analysis (%) by End User, 2024 to 2034

Figure 156: Eastern Europe Market Value (US$ Million) Analysis, 2018 to 2023

Figure 157: Eastern Europe Market Value (US$ Million) Forecast, 2024 to 2034

Figure 158: Eastern Europe Market Value Share, by Test (2024 E)

Figure 159: Eastern Europe Market Value Share, by Indication (2024 E)

Figure 160: Eastern Europe Market Value Share, by End User (2024 E)

Figure 161: Eastern Europe Market Value Share, by Country (2024 E)

Figure 162: Eastern Europe Market Attractiveness Analysis by Test, 2024 to 2034

Figure 163: Eastern Europe Market Attractiveness Analysis by Indication, 2024 to 2034

Figure 164: Eastern Europe Market Attractiveness Analysis by End User, 2024 to 2034

Figure 165: Eastern Europe Market Attractiveness Analysis by Country, 2024 to 2034

Figure 166: Russia Market Value Proportion Analysis, 2023

Figure 167: Global Vs. Russia Growth Comparison, 2024 to 2034

Figure 168: Russia Market Share Analysis (%) by Test, 2024 to 2034

Figure 169: Russia Market Share Analysis (%) by Indication, 2024 to 2034

Figure 170: Russia Market Share Analysis (%) by End User, 2024 to 2034

Figure 171: Hungary Market Value Proportion Analysis, 2023

Figure 172: Global Vs Hungary Growth Comparison, 2024 to 2034

Figure 173: Hungary Market Share Analysis (%) by Test, 2024 to 2034

Figure 174: Hungary Market Share Analysis (%) by Indication, 2024 to 2034

Figure 175: Hungary Market Share Analysis (%) by End User, 2024 to 2034

Figure 176: Poland Market Value Proportion Analysis, 2023

Figure 177: Global Vs Poland Growth Comparison, 2024 to 2034

Figure 178: Poland Market Share Analysis (%) by Test, 2024 to 2034

Figure 179: Poland Market Share Analysis (%) by Indication, 2024 to 2034

Figure 180: Poland Market Share Analysis (%) by End User, 2024 to 2034

Figure 181: Middle East and Africa Market Value (US$ Million) Analysis, 2018 to 2023

Figure 182: Middle East and Africa Market Value (US$ Million) Forecast, 2024 to 2034

Figure 183: Middle East and Africa Market Value Share, by Test (2024 E)

Figure 184: Middle East and Africa Market Value Share, by Indication (2024E)

Figure 185: Middle East and Africa Market Value Share, by End User (2024 E)

Figure 186: Middle East and Africa Market Value Share, by Country (2024 E)

Figure 187: Middle East and Africa Market Attractiveness Analysis by Test, 2024 to 2034

Figure 188: Middle East and Africa Market Attractiveness Analysis by Indication, 2024 to 2034

Figure 189: Middle East and Africa Market Attractiveness Analysis by End User, 2024 to 2034

Figure 190: Middle East and Africa Market Attractiveness Analysis by Country, 2024 to 2034

Figure 191: Saudi Arabia Market Value Proportion Analysis, 2023

Figure 192: Global Vs Saudi Arabia Growth Comparison, 2024 to 2034

Figure 193: Saudi Arabia Market Share Analysis (%) by Test, 2024 to 2034

Figure 194: Saudi Arabia Market Share Analysis (%) by Indication, 2023 and2034

Figure 195: Saudi Arabia Market Share Analysis (%) by End User, 2024 to 2034

Figure 196: Türkiye Market Value Proportion Analysis, 2023

Figure 197: Global Vs. Türkiye Growth Comparison, 2024 to 2034

Figure 198: Türkiye Market Share Analysis (%) by Test, 2024 to 2034

Figure 199: Türkiye Market Share Analysis (%) by Indication, 2024 to 2034

Figure 200: Türkiye Market Share Analysis (%) by End User, 2024 to 2034

Figure 201: South Africa Market Value Proportion Analysis, 2023

Figure 202: Global Vs. South Africa Growth Comparison, 2024 to 2034

Figure 203: South Africa Market Share Analysis (%) by Test, 2024 to 2034

Figure 204: South Africa Market Share Analysis (%) by Indication, 2023 and2034

Figure 205: South Africa Market Share Analysis (%) by End User, 2024 to 2034

Figure 206: Other African Union Market Value Proportion Analysis, 2023

Figure 207: Global Vs Other African Union Growth Comparison, 2024 to 2034

Figure 208: Other African Union Market Share Analysis (%) by Test, 2024 to 2034

Figure 209: Other African Union Market Share Analysis (%) by Indication, 2024 to 2034

Figure 210: Other African Union Market Share Analysis (%) by End User, 2024 to 2034

Frequently Asked Questions

How Big Was the Pulmonary Fibrosis Biomarker Market in 2023?

The pulmonary fibrosis biomarker was valued at USD 4,149.0 million in 2023.

What is the Projected Value of the Pulmonary Fibrosis Biomarker Market by 2034?

The demand for pulmonary fibrosis biomarkers is set to reach a valuation of USD 6,538.4 million by the end of 2034.

What is the Growth Potential of the Pulmonary Fibrosis Biomarker Market?

The market is anticipated to expand at a 4.4% CAGR through 2034.

Which Test Type Segment Contributes to the Pulmonary Fibrosis Biomarker Market?

The imaging tests segment is expected to acquire a market share of 44.9% in 2024.

What is the Estimated Size of the Pulmonary Fibrosis Biomarker Market in 2024?

Sales of pulmonary fibrosis biomarkers are estimated to be valued at USD 4,353.0 million in 2024.

Explore Similar Insights

Future Market Insights

Pulmonary Fibrosis Biomarker Market