Reports

- Global Locations -

Headquarters

Future Market Insights, Inc.

Christiana Corporate, 200
Continental Drive, Suite 401,
Newark, Delaware - 19713,
United States

T: +1-845-579-5705

Americas

Future Market Insights, Inc.

616 Corporate Way, Suite 2-9018,
Valley Cottage, NY 10989, United States

T: +1-347-918-3531

MEA

Future Market Insights

1602-6 Jumeirah Bay X2 Tower, Plot No: JLT-PH2-X2A,
Jumeirah Lakes Towers, Dubai,
United Arab Emirates

Europe

Future Market Insights

3rd Floor, 207 Regent Street,
W1B 3HH London
United Kingdom

T: + 44 (0) 20 8123 9659
D: +44 (0) 20 3287 4268

Asia Pacific

Future Market Insights

IndiaLand Global Tech Park, Unit UG-1, Behind Grand HighStreet, Phase 1, Hinjawadi, MH, Pune – 411057, India

MRI Pulse Oximeters Market Outlook (2022 to 2028)

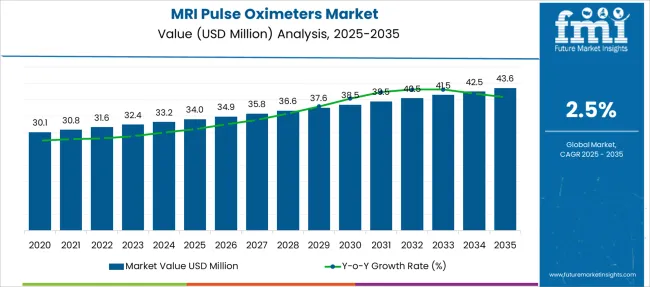
Global consumption of MRI Pulse Oximeters stands at around US$ 31.6 Million in 2022. The MRI Pulse Oximeters Market is predicted to increase at a CAGR of 2.5% to reach a valuation of US$ 36.5 Million by 2028.

Attribute Details
MRI Pulse Oximeters Market Size (2022) US$ 31.6 Million
Sales Forecast (2028) US$ 36.5 Million
Global Market Growth Rate (2022 to 2028) 2.5% CAGR
Share of Top 5 MRI Pulse Oximeter Manufacturers 50%

MRI pulse oximeter sales accounted for around 2.3% share of the global pulse oximeter market in 2021. Significant inventions in the healthcare sector across regions are driving sales of medical devices, and wireless MRI pulse oximeter suppliers are set to gain from this trend.

Don't pay for what you don't need

Customize your report by selecting specific countries or regions and save 30%!

How The Market Progressed Till June 2022?

Particulars Details
H1, 2021 2.35%
H1, 2022 Projected 2.46%
H1, 2022 Outlook 2.36%
BPS Change - H1, 2022 (O) – H1, 2022 (P) (-) 10 ↓
BPS Change – H1, 2022 (O) – H1, 2021 (+) 01 ↑

The comparative analysis and market growth rate of the global MRI pulse oximeters market as studied by Future Market Insights’ will show a negative BPS growth in the H1-2022 outlook as compared to the H1-2022 projected period by 10 BPS.

The market is subject to changes as per macro and industry standards. Factors that affect the market dynamics are MRI pulse oximeters facing strict regulations and accuracy concerns. Moreover, the presence of FDA-approved generic pulse oximeters which are widely accepted due to their cost-effectiveness and low maintenance is further responsible for the observed reduction in the BPS values.

However, a positive BPS growth is expected in H1-2022 over H1- 2021 duration with 01 Basis Point Share (BPS). The reasons for the surge in the market is due to prevalence of chronic diseases, a shift in focus towards advanced radiology research, and constant modification with technological innovations. Additionally, top players are constantly enhancing their product portfolios and collaborating to produce high-end products.

MRI Pulse Oximeters Market

Demand Analysis of MRI Pulse Oximeters (2014 to 2021) Vs. Industry Outlook (2022 to 2028)

Increasing Prevalence of Chronic Diseases Driving Demand for Medical Monitoring Devices

From 2014 to 2021, the global MRI pulse oximeters market witnessed a CAGR of 1.8%.

With the growing population, the prevalence of chronic disease is increasing among all age groups, and people suffering from chronic diseases such as cancer and HIV are more susceptible to infectious diseases. The rate of prevalence of infectious diseases is directly proportional to the demand for high-end medical monitoring devices such as MRI and CT scans.

At present, cancer treatment and cardiac disease treatment are among the prominent segments of the MRI pulse oximeters market. Around 10 million deaths occur across the world each year that can be attributed to cancer. Most medical monitoring device manufacturing companies have 7T capacity MRI machines in their pipelines. Such advancements in the medical diagnostic equipment field are expected to be a key factor that will drive the demand growth for MRI pulse oximeters.

Technological advancements in MRI pulse oximetry, partnerships between leading companies, which are boosting research activities in the radiology field, growing demand for advanced SpO2 measuring techniques, and technological advancements in MRI machines are some of the major factors fueling the growth of the global MRI pulse oximeters market.

Overall, the global market for MRI pulse oximeters is predicted to expand at a CAGR of 2.5% from 2022 to 2028.

Sabyasachi Ghosh
Sabyasachi Ghosh

Principal Consultant

Talk to Analyst

Find your sweet spots for generating winning opportunities in this market.

Key Trends Driving Market Expansion

Continuous Research and development activities Will Create Sales Opportunities for Pulse Oximeter Manufacturers

With a massive shift taking place in the global healthcare sector, Research and Development spending continues to represent a high percentage of market stakeholders’ expenditures. While existing pulse oximeters work efficiently with 5T MRI scanners, developing and introducing products that are compatible with both, 5T and 7T Magnetic Resonance Imaging machines, should be an important strategy for manufacturers.

MRI-compatible pulse oximeters that are designed using non-magnetic components to facilitate the safe and accurate monitoring of patient’s vital signs during MRI scans have garnered considerable traction in the in-depth analysis of illnesses. Apart from using them in connection with congenital heart defects (CHD), MRI pulse oximeters are increasingly being used as a standard diagnostic measure in the fields of anesthetics, intensive care, and emergency care.

Innovations in the manufacturing process of MRI pulse reading devices are resulting in higher demand for multifunctional MRI pulse oximeters. Several companies that have a product portfolio of MRI technology are developing high-quality medical diagnostic equipment. These companies are also trying to meet customer demand and GMP compliance for faster regulatory approval.

  • In 2020, Masimo and Royal Philips renewed their collaboration, with Philips integrating new Masimo assessment capabilities into select IntelliVue MX-series multiparameter monitors to assist physicians in assessing cerebral oximetry and ventilation status.
  • In 2021, Masimo purchased LiDCO, a manufacturer of noninvasive and minimally invasive hemodynamic equipment, bolstering its advanced measuring and patient monitoring capabilities.

Which Restraints are Denting Demand Growth of MRI Pulse Oximeters?

Strict Regulations and Accuracy Concerns Regarding Vital Sign Monitors Hurting Market Growth

MRI diagnosis continues to be associated with high costs, thereby adding to the reluctance of MRI pulse oximetry testing during MRI scans. In addition, MRI pulse oximeters are sensitive and have relatively high maintenance costs as compared to generic pulse oximeters. Strict regulations and accuracy concerns of vital sign monitors are key challenging factors for manufacturers.

Get the data you need at a Fraction of the cost

Personalize your report by choosing insights you need
and save 40%!

Which Region is a Leading Market for MRI Pulse Oximeters?

The emergence of Fiber Optic Pulse Oximeters Keeps the Market Competitive in North America

Heavy investments in Research and Development activities on medical devices and technologies along with favorable reimbursement scenarios in North America are likely to offer lucrative opportunities for MRI pulse reading system market players.

Manufacturers are viewing North America from a target market perspective, considering increasing healthcare expenditure and growing adoption of fiber optic pulse oximeters in the region.

Stakeholders in the market are leveraging new sensor technologies such as fiber optic pulse oximeters to avoid conductive pathways and improve device safety.
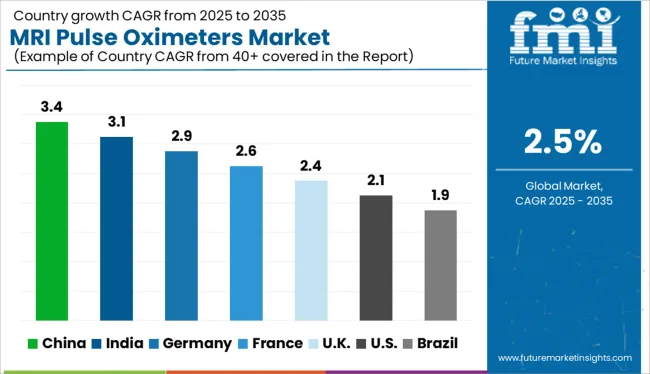
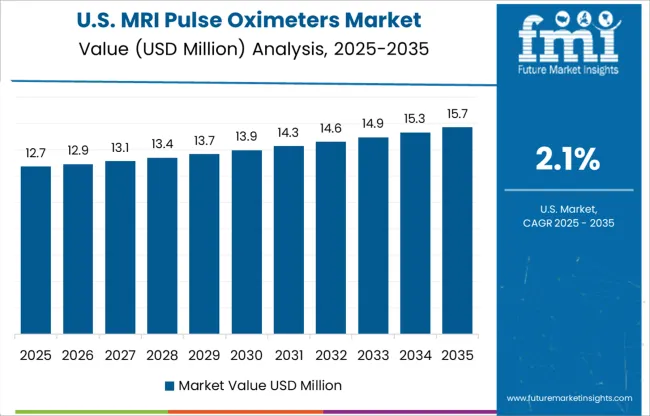
Country-wise Analysis

What are the Growth Prospects of the USA MRI Pulse Oximeters Market?

Technological Advancements Elevating Sales of MRI-Compatible Pulse Oximeters

Leading manufacturers of MRI-compatible pulse oximeters are presently prioritizing Research and Development and new product launches to resonate with the booming adoption of MRI pulse oximeters in the USA

The market in the USA continues to offer greater opportunities due to the strong presence of key stakeholders and the growing adoption of cost-effective alternatives, including MRI-compatible pulse oximeters and wrist-worn pulse oximeters.

Why is China Considered a Lucrative MRI Pulse Oximeter Supplier?

Increasing Government Spending on Healthcare Driving Demand for Multifunctional MRI Pulse Oximeters

Market growth in China is backed by favorable government initiatives for the expansion of the healthcare sector. With high commercial possibilities in China, enterprises are concentrating on expanding their product portfolios, diversifying their business operations, lowering costs, increasing user satisfaction, and improving the dependability of multifunctional MRI pulse oximeters.

The increasing popularity of medical tourism and favorable health insurance policies in China are likely to attract patients towards expensive, yet efficient MRI scan therapy, and subsequently drive the sales of multifunctional MRI pulse oximeters.

Category-wise Insights

Which Type of MRI Pulse Oximeter Enjoys High Sales?

Wireless MRI Pulse Oximeters Extending Traditional Functionality Aspects

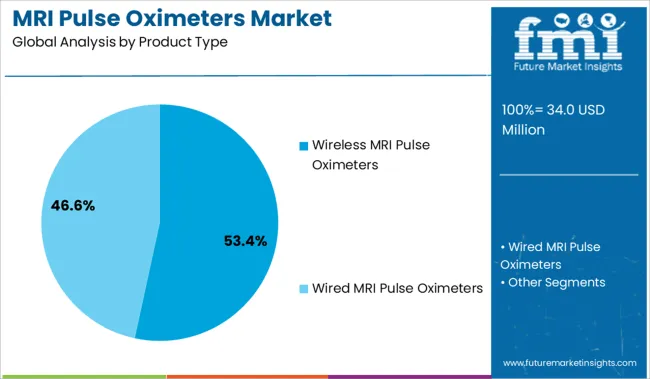
Wireless MRI pulse oximeters are expected to account for around 63.7% of the global market share in 2022.

Aligning with the rapid development of state-of-the-art medical devices and technologies, market players continue to increase the production of wireless MRI pulse oximeters that need not be connected to MRI machines. Operated through infrared (IR) or Bluetooth technology, wireless MRI pulse oximeters have also witnessed higher innovations and investments as compared to wired variants.

Wireless MRI pulse oximeters provide precise SpO2 measurements and are not restricted to MRI environments; hence, manufacturers are specifically focused on this category.

Why are Hospitals Driving the Most Growth in MRI Pulse Oximeters Market?

Growing Demand for Patient Monitoring in Hospitals Fueling Market Expansion

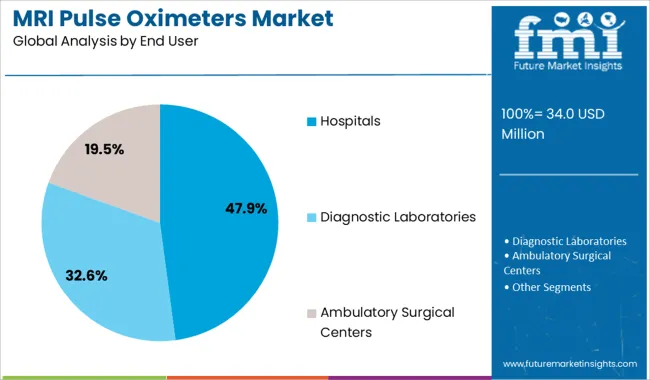
Increasing adoption of MRI pulse oximeters in hospitals and growing patient visits for a complete diagnosis of diseases are driving demand for MRI pulse oximeters in hospitals. The increasing senior population as well as the rising frequency of numerous chronic respiratory disorders are driving the use of monitoring devices such as MRI pulse oximeters in hospitals during the diagnostic and therapy stages.

As current MRI pulse oximeters are organ-specific, requiring different sensors for different organs, manufacturers investing in the development of products that are not organ-specific and provide accurate SpO2 readings equally in all sensor locations are likely to be rewarded in the long run.
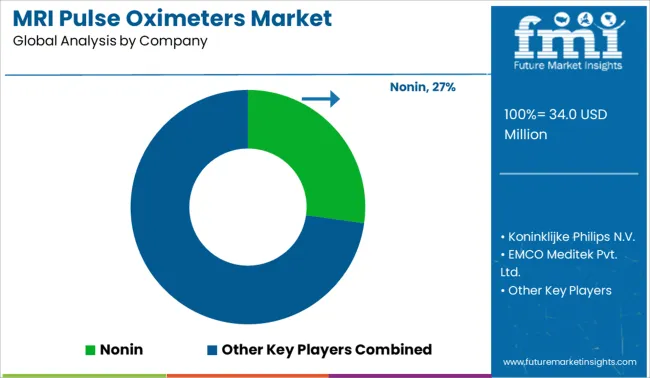
Competitive Landscape

MRI pulse oximeter manufacturers remain focused on meeting the needs for pulse oximetry on infants, pediatrics, and adults in fixed-site as well as mobile MRI units.

  • Masimo launched two health monitoring systems named Rad-97 Pulse-CO Oximeter and SedLine Brain Function Monitoring. These gadgets are mostly targeted toward the Indian market. Clinicians and practitioners in India feel that by using these gadgets, they will be able to better supervise their patients.

MRI Pulse Oximeters Industry Report Scope

Attribute Details
Forecast Period 2022 to 2028
Historical Data Available for 2014 to 2021
Market Analysis Value in US$ Million, Units for Volume
Key Regions Covered
  • North America
  • Latin America
  • Europe
  • East Asia
  • South Asia & Pacific
  • Middle East & Africa (MEA)
Key Countries Covered
  • USA
  • Canada
  • Mexico
  • Brazil
  • Mexico
  • Argentina
  • Germany
  • Italy
  • France
  • United Kingdom
  • Nordic
  • Spain
  • Japan
  • China
  • India
  • Malaysia
  • Thailand
  • Australia
  • GCC Countries
  • South Africa
  • Turkey
Key Market Segments Covered
  • Product Type
  • Modality
  • End User
  • Region
Key Companies Profiled
  • Koninklijke Philips N.V.
  • Nonin
  • IRadimed Corporation
  • EMCO Meditek Pvt. Ltd.
  • MIPM
  • Hamilton Medical
  • General Electric Company
  • Turner Medical
  • Medtronic
  • Zensorium
Pricing Available upon Request

Key Key Segments of MRI Pulse Oximeters Industry Research

MRI Pulse Oximeters Market by Product Type:

  • Wired MRI Pulse Oximeters
  • Wireless MRI Pulse Oximeters

MRI Pulse Oximeters Market by Modality:

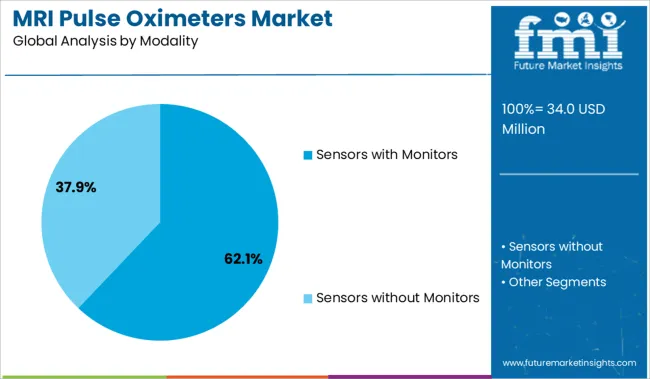
  • Sensors with Monitors
  • Sensors without Monitors

MRI Pulse Oximeters Market by End User:

  • Hospitals
  • Diagnostic Laboratories
  • Ambulatory Surgical Centers

MRI Pulse Oximeters Market by Region:

  • North America
  • Latin America
  • Europe
  • East Asia
  • South Asia & Pacific
  • Middle East & Africa (MEA)

Frequently Asked Questions

What will be the value of the MRI pulse oximeters market during the forecast period?

The global MRI pulse oximeters market is predicted to reach US$ 36.5 Million by 2028.

Which segment is expected to dominate the MRI pulse oximeters market?

Wireless MRI pulse oximeters account for 63.7% share of the global market.

What are the key drivers for MRI pulse oximeters?

Rising cases of chronic diseases and increasing demand for advanced SpO2 measuring techniques are factors driving MRI pulse oximeter sales growth.

Who are the prominent suppliers of MRI pulse oximeters?

Koninklijke Philips N.V., Nonin, IRadimed Corporation, EMCO Meditek Pvt. Ltd., and MIPM are prominent manufacturers of MRI pulse oximeters.

What is the expected growth rate of the global MRI pulse oximeters market?

Global sales of MRI pulse oximeters are projected to register a CAGR of 2.5% from 2022 to 2028.

Table of Content

1. Executive Summary | MRI Pulse Oximeters Market

    1.1. Global Market Outlook

    1.2. Market Analysis

    1.3. Analysis and Recommendations

2. Market Overview

    2.1. Market Coverage / Taxonomy

    2.2. Market Definition / Scope / Limitations

3. Market Background

    3.1. Macro-Economic Factors

    3.2. Forecast Factors - Relevance & Impact

    3.3. Market Dynamics

        3.3.1. Drivers

        3.3.2. Restraints

    3.4. Opportunity

4. Key Success Factors

    4.1. Recent Product Launches

    4.2. Parent Market Analysis

5. Global Market Volume (Units) Analysis 2014 to 2021 and Forecast, 2022 to 2028

    5.1. Historical Market Volume (Units) Analysis, 2014 to 2021

    5.2. Current and Future Market Volume (Units) Projections, 2022 to 2028

    5.3. Y-o-Y Growth Trend Analysis

6. Global Market Pricing Analysis

    6.1. Regional Pricing Analysis By Product Type

    6.2. Pricing Break-up

        6.2.1. Manufacturer-Level Pricing

        6.2.2. Distributor Level Pricing

    6.3. Global Average Pricing Analysis Benchmark

7. Global Market Value (US$ Million) Analysis 2014 to 2021 and Forecast, 2022 to 2028

    7.1. Historical Market Value (US$ Million) Analysis, 2014 to 2021

    7.2. Current and Future Market Value (US$ Million) Projections, 2022 to 2028

        7.2.1. Y-o-Y Growth Trend Analysis

        7.2.2. Absolute $ Opportunity Analysis

8. Global Market Analysis 2014 to 2021 and Forecast 2022 to 2028, by Product Type 

    8.1. Introduction / Key Findings

    8.2. Historical Market Size (US$ Million) Analysis By Product Type, 2014 to 2021

    8.3. Current and Future Market Size (US$ Million) Analysis and Forecast By Product Type, 2022 to 2028

        8.3.1. Wired MRI Pulse Oximeter

        8.3.2. Wireless MRI Pulse Oximeter

    8.4. Market Attractiveness Analysis By Product Type

9. Global Market Analysis 2014 to 2021 and Forecast 2022 to 2028, by Modality

    9.1. Introduction / Key Findings

    9.2. Historical Market Size (US$ Million) Analysis By Modality, 2014 to 2021

    9.3. Current and Future Market Size (US$ Million) Analysis and Forecast By Modality, 2022 to 2028

        9.3.1. with Monitor

        9.3.2. without Monitor

    9.4. Market Attractiveness Analysis By Modality

10. Global Market Analysis 2014 to 2021 and Forecast 2022 to 2028, By End User 

    10.1. Introduction / Key Findings

    10.2. Historical Market Size (US$ Million) Analysis By End User, 2014 to 2021

    10.3. Current and Future Market Size (US$ Million) Analysis and Forecast By End User, 2022 to 2028

        10.3.1. Hospitals

        10.3.2. Diagnostic Laboratories

        10.3.3. Ambulatory Surgical Centers

    10.4. Market Attractiveness Analysis By End User

11. Global Market Analysis 2014 to 2021 and Forecast 2022 to 2028, by Region

    11.1. Introduction

    11.2. Historical Market Size (US$ Million) Analysis By Region, 2014 to 2021

    11.3. Current Market Size (US$ Million) Analysis and Forecast By Region, 2022 to 2028

        11.3.1. North America

        11.3.2. Latin America

        11.3.3. Europe

        11.3.4. South Asia

        11.3.5. East Asia

        11.3.6. Oceania

        11.3.7. Middle East and Africa (MEA)

    11.4. Market Attractiveness Analysis By Region

12. North America Market Analysis 2014 to 2021 and Forecast 2022 to 2028

    12.1. Introduction

    12.2. Historical Market Size (US$ Million) Trend Analysis By Market Taxonomy, 2014 to 2021

    12.3. Market Size (US$ Million) Forecast By Market Taxonomy, 2021 to 2028

        12.3.1. By Country

            12.3.1.1. USA

            12.3.1.2. Canada

        12.3.2. By Product Type

        12.3.3. By Modality

        12.3.4. By End User

    12.4. Market Attractiveness Analysis

    12.5. Key Market Participants - Intensity Mapping

    12.6. Drivers and Restraints - Impact Analysis

13. Latin America Market Analysis 2014 to 2021 and Forecast 2022 to 2028

    13.1. Introduction

    13.2. Historical Market Size (US$ Million) Trend Analysis By Market Taxonomy, 2014 to 2021

    13.3. Market Size (US$ Million) Forecast By Market Taxonomy, 2021 to 2028

        13.3.1. By Country

            13.3.1.1. Brazil

            13.3.1.2. Mexico

            13.3.1.3. Argentina

            13.3.1.4. Rest of Latin America

        13.3.2. By Product Type

        13.3.3. By Modality

        13.3.4. By End User

    13.4. Market Attractiveness Analysis

    13.5. Key Market Participants - Intensity Mapping

    13.6. Drivers and Restraints - Impact Analysis

14. Europe Market Analysis 2014 to 2021 and Forecast 2022 to 2028

    14.1. Introduction

    14.2. Historical Market Size (US$ Million) Trend Analysis By Market Taxonomy, 2014 to 2021

    14.3. Market Size (US$ Million) Forecast By Market Taxonomy, 2021 to 2028

        14.3.1. By Country

            14.3.1.1. Germany

            14.3.1.2. Italy

            14.3.1.3. France

            14.3.1.4. United Kingdom

            14.3.1.5. Spain

            14.3.1.6. BENELUX

            14.3.1.7. Russia

            14.3.1.8. Poland

            14.3.1.9. Rest of Europe

        14.3.2. By Product Type

        14.3.3. By Modality

        14.3.4. By End User

    14.4. Market Attractiveness Analysis

    14.5. Key Market Participants - Intensity Mapping

    14.6. Drivers and Restraints - Impact Analysis

15. South Asia Market Analysis 2014 to 2021 and Forecast 2022 to 2028

    15.1. Introduction

    15.2. Historical Market Size (US$ Million) Trend Analysis By Market Taxonomy, 2014 to 2021

    15.3. Market Size (US$ Million) Forecast By Market Taxonomy, 2021 - 2028

        15.3.1. By Country

            15.3.1.1. India

            15.3.1.2. Thailand

            15.3.1.3. Singapore

            15.3.1.4. Indonesia

            15.3.1.5. Malaysia

            15.3.1.6. Rest of South Asia

        15.3.2. By Product Type

        15.3.3. By Modality

        15.3.4. By End User

    15.4. Market Attractiveness Analysis

    15.5. Key Market Participants - Intensity Mapping

    15.6. Drivers and Restraints - Impact Analysis

16. East Asia Market Analysis 2014 to 2021 and Forecast 2022 to 2028

    16.1. Introduction

    16.2. Historical Market Size (US$ Million) Trend Analysis By Market Taxonomy, 2014 to 2021

    16.3. Market Size (US$ Million) Forecast By Market Taxonomy, 2021 to 2028

        16.3.1. By Country

            16.3.1.1. China

            16.3.1.2. Japan

            16.3.1.3. South Korea

        16.3.2. By Product Type

        16.3.3. By Modality

        16.3.4. By End User

    16.4. Market Attractiveness Analysis

    16.5. Key Market Participants - Intensity Mapping

    16.6. Drivers and Restraints - Impact Analysis

17. Oceania Market Analysis 2014 to 2021 and Forecast 2022 to 2028

    17.1. Introduction

    17.2. Historical Market Size (US$ Million) Trend Analysis By Market Taxonomy, 2014 to 2021

    17.3. Market Size (US$ Million) Forecast By Market Taxonomy, 2021 to 2028

        17.3.1. By Country

            17.3.1.1. Australia

            17.3.1.2. New Zealand

        17.3.2. By Product Type

        17.3.3. By Modality

        17.3.4. By Application

        17.3.5. By End User

    17.4. Market Attractiveness Analysis

    17.5. Key Market Participants - Intensity Mapping

    17.6. Drivers and Restraints - Impact Analysis

18. Middle East and Africa Market Analysis 2014 to 2021 and Forecast 2022 to 2028

    18.1. Introduction

    18.2. Historical Market Size (US$ Million) Trend Analysis By Market Taxonomy, 2014 to 2021

    18.3. Market Size (US$ Million) Forecast By Market Taxonomy, 2021 to 2028

        18.3.1. By Country

            18.3.1.1. GCC Countries

            18.3.1.2. South Africa

            18.3.1.3. Rest of Middle East and Africa

        18.3.2. By Product Type

        18.3.3. By Modality

        18.3.4. By Application

        18.3.5. By End User

    18.4. Market Attractiveness Analysis

    18.5. Key Market Participants - Intensity Mapping

    18.6. Drivers and Restraints - Impact Analysis

19. Emerging Countries Market Analysis 2014 to 2021 and Forecast 2022 to 2028

    19.1. Introduction

        19.1.1. Market Value Proportion Analysis, By Key Countries

        19.1.2. Global Vs. Country Growth Comparison

    19.2. China Market Analysis

        19.2.1. Introduction

        19.2.2. Pricing Analysis

        19.2.3. PEST Analysis

        19.2.4. Market Value Proportion Analysis by Market Taxonomy

        19.2.5. Market Value (US$ Million) Analysis and Forecast by Market Taxonomy

            19.2.5.1. By Product Type

            19.2.5.2. By Modality

            19.2.5.3. By Application

            19.2.5.4. By End User

        19.2.6. China Market - Competition Landscape

    19.3. India Market Analysis

        19.3.1. Introduction

        19.3.2. Pricing Analysis

        19.3.3. PEST Analysis

        19.3.4. Market Value Proportion Analysis by Market Taxonomy

        19.3.5. Market and Value (US$ Million) Analysis and Forecast by Market Taxonomy

            19.3.5.1. By Product Type

            19.3.5.2. By Modality

            19.3.5.3. By Application

            19.3.5.4. By End User

        19.3.6. India Market - Competition Landscape

    19.4. Brazil Market Analysis

        19.4.1. Introduction

        19.4.2. Pricing Analysis

        19.4.3. PEST Analysis

        19.4.4. Market Value Proportion Analysis by Market Taxonomy

        19.4.5. Market Value (US$ Million) Analysis and Forecast by Market Taxonomy

            19.4.5.1. By Product Type

            19.4.5.2. By Modality

            19.4.5.3. By Application

            19.4.5.4. By End User

        19.4.6. Brazil Market - Competition Landscape

20. Market Structure Analysis

    20.1. Market Analysis by Tier of Companies

    20.2. Market Share Analysis of Top Players

21. Competition Analysis

    21.1. Competition Dashboard

    21.2. Competition Benchmarking

    21.3. Competition Deep Dive

        21.3.1. Nonin

            21.3.1.1. Overview

            21.3.1.2. Product Portfolio

            21.3.1.3. Profitability by Market Segments (Product/Channel/Region)

            21.3.1.4. Sales Footprint

            21.3.1.5. Strategy Overview

                21.3.1.5.1. Marketing Strategy

                21.3.1.5.2. Product Strategy

                21.3.1.5.3. Channel Strategy

        21.3.2. Koninklijke Philips N.V.

            21.3.2.1. Overview

            21.3.2.2. Product Portfolio

            21.3.2.3. Profitability by Market Segments (Product/Channel/Region)

            21.3.2.4. Sales Footprint

            21.3.2.5. Strategy Overview

                21.3.2.5.1. Marketing Strategy

                21.3.2.5.2. Product Strategy

                21.3.2.5.3. Channel Strategy

        21.3.3. EMCO Meditek Pvt. Ltd.

            21.3.3.1. Overview

            21.3.3.2. Product Portfolio

            21.3.3.3. Profitability by Market Segments (Product/Channel/Region)

            21.3.3.4. Sales Footprint

            21.3.3.5. Strategy Overview

                21.3.3.5.1. Marketing Strategy

                21.3.3.5.2. Product Strategy

                21.3.3.5.3. Channel Strategy

        21.3.4. IRadimed Corporation

            21.3.4.1. Overview

            21.3.4.2. Product Portfolio

            21.3.4.3. Profitability by Market Segments (Product/Channel/Region)

            21.3.4.4. Sales Footprint

            21.3.4.5. Strategy Overview

                21.3.4.5.1. Marketing Strategy

                21.3.4.5.2. Product Strategy

                21.3.4.5.3. Channel Strategy

        21.3.5. MIPM

            21.3.5.1. Overview

            21.3.5.2. Product Portfolio

            21.3.5.3. Profitability by Market Segments (Product/Channel/Region)

            21.3.5.4. Sales Footprint

            21.3.5.5. Strategy Overview

                21.3.5.5.1. Marketing Strategy

                21.3.5.5.2. Product Strategy

                21.3.5.5.3. Channel Strategy

22. Assumptions and Acronyms Used

23. Research Methodology

Don't pay for what you don't need

Customize your report by selecting specific countries or regions and save 30%!

List of Tables

Table 01: Global Market Volume (‘000 units) Analysis and Opportunity Assessment 2014 to 2028, By Product Type

Table 02: Global Market Value (US$ Million) Analysis and Opportunity Assessment 2014 to 2028, By Product Type

Table 03: Global Market Value (US$ Million) Analysis and Opportunity Assessment 2014 to 2028, By Modality

Table 04: Global Market Value (US$ Million) Analysis- and Opportunity Assessment 2014 to 2028, By End User

Table 05: Global Market Value (US$ Million) Analysis and Opportunity Assessment 2014 to 2028, By Region

Table 06: Global Market Volume(‘000 units) Analysis and Opportunity Assessment 2014 to 2028, By Region

Table 07: North America Market Value (US$ Million) Analysis 2014 to 2021 and Forecast 2022 to 2028, By Country

Table 08: Global Market Volume (‘000 units) Analysis and Opportunity Assessment 2014 to 2028, By Product Type

Table 09: North America Market Value (US$ Million) Analysis 2014 to 2021 and Forecast 2022 to 2028, By Product Type

Table 10: North America Market Volume (‘000 Units) Analysis 2014 to 2021 and Forecast 2022 to 2028, By Device Type

Table 11: North America Market Value (US$ Million) Analysis 2014 to 2021 and Forecast 2022 to 2028, By End User

Table 12: Latin America Market Value (US$ Million) Analysis 2014 to 2021 and Forecast 2022 to 2028, By Country

Table 13: Global Market Volume (‘000 units) Analysis and Opportunity Assessment 2014 to 2028, By Product Type

Table 14: Latin America Market Value (US$ Million) Analysis 2014 to 2021 and Forecast 2022 to 2028, By Product Type

Table 15: Latin America Market Value (US$ Million) Analysis 2014 to 2021 and Forecast 2022 to 2028, By Modality

Table 16: Latin America Market Value (US$ Million) Analysis 2014 to 2021 and Forecast 2022 to 2028, By End User

Table 17: Europe Market Value (US$ Million) Analysis 2014 to 2021 and Forecast 2022 to 2028, By Country

Table 18: Global Market Volume (‘000 units) Analysis and Opportunity Assessment 2014 to 2028, By Product Type

Table 19: Europe Market Value (US$ Million) Analysis 2014 to 2021 and Forecast 2022 to 2028, By Product Type

Table 20: Europe Market Value (US$ Million) Analysis 2014 to 2021 and Forecast 2022 to 2028, By Modality

Table 21: Europe Market Value (US$ Million) Analysis 2014 to 2021 and Forecast 2022 to 2028, By End User

Table 22: South Asia Market Value (US$ Million) Analysis 2014 to 2021 and Forecast 2022 to 2028, By Country

Table 23: Global Market Volume (‘000 units) Analysis and Opportunity Assessment 2014 to 2028, By Product Type

Table 24: South Asia Market Value (US$ Million) Analysis 2014 to 2021 and Forecast 2022 to 2028, By Product Type

Table 25: South Asia Market Value (US$ Million) Analysis 2014 to 2021 and Forecast 2022 to 2028, By Modality

Table 26: South Asia Market Value (US$ Million) Analysis 2014 to 2021 and Forecast 2022 to 2028, By End User

Table 27: East Asia Market Value (US$ Million) Analysis 2014 to 2021 and Forecast 2022 to 2028, By Country

Table 28: Global Market Volume (‘000 units) Analysis and Opportunity Assessment 2014 to 2028, By Product Type

Table 29: East Asia Market Value (US$ Million) Analysis 2014 to 2021 and Forecast 2022 to 2028, By Product Type

Table 30: East Asia Market Volume (‘000 Units) Analysis 2014 to 2021 and Forecast 2022 to 2028, By Device Type

Table 31: East Asia Market Value (US$ Million) Analysis 2014 to 2021 and Forecast 2022 to 2028, By End User

Table 32: Oceania Market Value (US$ Million) Analysis 2014 to 2021 and Forecast 2022 to 2028, By Country

Table 33: Global Market Volume (‘000 units) Analysis and Opportunity Assessment 2014 to 2028, By Product Type

Table 34: Oceania Market Value (US$ Million) Analysis 2014 to 2021 and Forecast 2022 to 2028, By Product Type

Table 35: Oceania Market Value (US$ Million) Analysis 2014 to 2021 and Forecast 2022 to 2028, By Modality

Table 36: Oceania Market Value (US$ Million) Analysis 2014 to 2021 and Forecast 2022 to 2028, By End User

Table 37: MEA Market Value (US$ Million) Analysis 2014 to 2021 and Forecast 2022 to 2028, By Country

Table 38: Global Market Volume (‘000 units) Analysis and Opportunity Assessment 2014 to 2028, By Product Type

Table 39: Market Value (US$ Million) Analysis 2014 to 2021 and Forecast 2022 to 2028, By Product Type

Table 40: MEA Market Value (US$ Million) Analysis 2014 to 2021 and Forecast 2022 to 2028, By Modality

Table 41: MEA Market Value (US$ Million) Analysis 2014 to 2021 and Forecast 2022 to 2028, By End User

Table 42: China Market Value (US$ Million) Analysis 2014 to 2021 and Forecast 2022 to 2028, By Product Type

Table 43: China Market Value (US$ Million) Analysis 2014 to 2021 and Forecast 2022 to 2028, By Modality

Table 44: China Market Value (US$ Million) Analysis 2014 to 2021 and Forecast 2022 to 2028, By End User

Table 45: India Market Value (US$ Million) Analysis 2014 to 2021 and Forecast 2022 to 2028, By Product Type

Table 46: India Market Value (US$ Million) Analysis 2014 to 2021 and Forecast 2022 to 2028, By Modality

Table 47: India Market Value (US$ Million) Analysis 2014 to 2021 and Forecast 2022 to 2028, By End User

Table 48: Brazil Market Value (US$ Million) Analysis 2014 to 2021 and Forecast 2022 to 2028, By Product Type

Table 49: Brazil Market Value (US$ Million) Analysis 2014 to 2021 and Forecast 2022 to 2028, By Modality

Table 50: Brazil Market Value (US$ Million) Analysis 2014 to 2021 and Forecast 2022 to 2028, By End User
Sabyasachi Ghosh
Sabyasachi Ghosh

Principal Consultant

Talk to Analyst

Find your sweet spots for generating winning opportunities in this market.

List of Charts

Figure 01: Global Market Volume Analysis (‘000 Units), 2014 to 2021

Figure 02: Global Market Volume Forecast (‘000 Units), 2022 to 2028

Figure 03: Wired, Pricing Analysis per unit (US$), By Region, 2022

Figure 04: Global Pulse Oximeters Market Overview

Figure 05: Wired, Pricing Analysis per unit (US$), By Region, 2028

Figure 06: Wireless, Pricing Analysis per unit (US$), By Region, 2022

Figure 07: Wireless, Pricing Analysis per unit (US$), By Region, 2028

Figure 08: Global Market Value Analysis (US$ Million), 2014 to 2021

Figure 09: Global Market Value Forecast (US$ Million), 2022 to 2028

Figure 10: Global Market Absolute $ Opportunity, 2022 to 2028

Figure 11: Global Market Share Analysis (%), By Product Type, 2022 & 2028

Figure 12: Global Market Y-o-Y Analysis (%), By Product Type, 2022 to 2028

Figure 13: Global Market Attractiveness Analysis By Product Type, 2022 to 2028

Figure 14: Global Market Share Analysis (%), By Modality, 2022 & 2028

Figure 15: Global Market Y-o-Y Analysis (%), By Modality, 2022 to 2028

Figure 16: Global Market Attractiveness Analysis by Modality, 2022 to 2028

Figure 17: Global Market Share Analysis (%), By End User, 2021 & 2028

Figure 18: Global Market Y-o-Y Analysis (%), By End User, 2022 to 2028

Figure 19: Global Market Attractiveness Analysis by End User, 2022 to 2028

Figure 20: Global Market Share Analysis (%), By Region, 2022 & 2028

Figure 21: Global Market Y-o-Y Analysis (%), By Region, 2022 to 2028

Figure 22: Global Market Attractiveness Analysis by Region, 2022 to 2028

Figure 23: North America Market Value Share, By Product Type (2019E)

Figure 24: North America Market Value Share, By Modality (2022 E)

Figure 25: North America Market Value Share, By End User (2022 E)

Figure 26: North America Market Value Share, By Country (2022 E)

Figure 27: North America Market Value Analysis (US$ Million), 2014 to 2021

Figure 28: North America Market Value Forecast (US$ Million), 2022 to 2028

Figure 29: North America Market Attractiveness Analysis By Product Type, 2022 to 2028

Figure 30: North America Market Attractiveness Analysis by Modality, 2022 to 2028

Figure 31: North America Market Attractiveness Analysis by End User, 2022 to 2028

Figure 32: North America Market Attractiveness Analysis by Country, 2022 to 2028

Figure 33: Latin America Market Value Share, By Product Type (2019E)

Figure 34: Latin America Market Value Share, By Modality (2022 E)

Figure 35: Latin America Market Value Share, By End User (2022 E)

Figure 36: Latin America Market Value Share, By Country (2022 E)

Figure 37: Latin America Market Value Analysis (US$ Million), 2014 to 2021

Figure 38: Latin America Market Value Forecast (US$ Million), 2022 to 2028

Figure 39: Latin America Market Attractiveness Analysis By Product Type, 2022 to 2028

Figure 40: Latin America Market Attractiveness Analysis by Modality, 2022 to 2028

Figure 41: Latin America Market Attractiveness Analysis by End User, 2022 to 2028

Figure 42: Latin America Market Attractiveness Analysis by Country, 2022 to 2028

Figure 43: Europe Market Value Share, By Product Type (2019E)

Figure 44: Europe Market Value Share, By Modality (2022 E)

Figure 45: Europe Market Value Share, By End User (2022 E)

Figure 46: Europe Market Value Share, By Country (2022 E)

Figure 47: Europe Market Value Analysis (US$ Million), 2014 to 2021

Figure 48: Europe Market Value Forecast (US$ Million), 2022 to 2028

Figure 49: Europe Market Attractiveness Analysis By Product Type, 2022 to 2028

Figure 50: Europe Market Attractiveness Analysis by Modality, 2022 to 2028

Figure 51: Europe Market Attractiveness Analysis by End User, 2022 to 2028

Figure 52: Europe Market Attractiveness Analysis by Country, 2022 to 2028

Figure 53: South Asia Market Value Share, By Product Type (2019E)

Figure 54: South Asia Market Value Share, By Modality (2022 E)

Figure 55: South Asia Market Value Share, By End User (2022 E)

Figure 56: South Asia Market Value Share, By Country (2022 E)

Figure 57: South Asia Market Value Analysis (US$ Million), 2014 to 2021

Figure 58: South Asia Market Value Forecast (US$ Million), 2022 to 2028

Figure 59: South Asia Market Attractiveness Analysis By Product Type, 2022 to 2028

Figure 60: South Asia Market Attractiveness Analysis by Modality, 2022 to 2028

Figure 61: South Asia Market Attractiveness Analysis by End User, 2022 to 2028

Figure 62: South Asia Market Attractiveness Analysis by Country, 2022 to 2028

Figure 63: East Asia Market Value Share, By Product Type (2019E)

Figure 64: East Asia Market Value Share, By Modality (2022 E)

Figure 65: East Asia Market Value Share, By End User (2022 E)

Figure 66: East Asia Market Value Share, By Country (2022 E)

Figure 67: East Asia Market Value Analysis (US$ Million), 2013 to 2017

Figure 68: East Asia Market Value Forecast (US$ Million), 2022 to 2028

Figure 69: East Asia Market Attractiveness Analysis By Product Type, 2022 to 2028

Figure 70: East Asia Market Attractiveness Analysis by Modality, 2022 to 2028

Figure 71: East Asia Market Attractiveness Analysis by End User, 2022 to 2028

Figure 72: East Asia Market Attractiveness Analysis by Country, 2022 to 2028

Figure 73: Oceania Market Value Share, By Product Type (2019E)

Figure 74: Oceania Market Value Share, By Modality (2022 E)

Figure 75: Oceania Market Value Share, By End User (2022 E)

Figure 76: Oceania Market Value Share, By Country (2022 E)

Figure 77: Oceania Market Value Analysis (US$ Million), 2014 to 2021

Figure 78: Oceania Market Value Forecast (US$ Million), 2022 to 2028

Figure 79: Oceania Market Attractiveness Analysis By Product Type, 2022 to 2028

Figure 80: Oceania Market Attractiveness Analysis by Modality, 2022 to 2028

Figure 81: Oceania Market Attractiveness Analysis by End User, 2022 to 2028

Figure 82: Oceania Market Attractiveness Analysis by Country, 2022 to 2028

Figure 83: MEA Market Value Share, By Product Type (2019E)

Figure 84: MEA Market Value Share, By Modality (2022 E)

Figure 85: MEA Market Value Share, By End User (2022 E)

Figure 86: MEA Market Value Share, By Country (2022 E)

Figure 87: MEA Market Value Analysis (US$ Million), 2014 to 2021

Figure 88: MEA Market Value Forecast (US$ Million), 2022 to 2028

Figure 89: MEA Market Attractiveness Analysis By Product Type, 2022 to 2028

Figure 90: MEA Market Attractiveness Analysis by Modality, 2022 to 2028

Figure 91: MEA Market Attractiveness Analysis by End User, 2022 to 2028

Figure 92: MEA Market Attractiveness Analysis by Country, 2022 to 2028

Figure 93: Global Market Value Proportion Analysis, By Emerging Countries, 2021

Figure 94: Market, Global Vs. Country Growth Y-o-Y (%) Comparison, 2022 to 2028

Figure 95: China Market Value Analysis (US$ Million), 2014 to 2021

Figure 96: China Market Value Forecast (US$ Million), 2022 to 2028

Figure 97: India Market Value Analysis (US$ Million), 2014 to 2021

Figure 98: India Market Value Forecast (US$ Million), 2022 to 2028

Figure 99: Brazil Market Value Analysis (US$ Million), 2014 to 2021

Figure 100: Brazil Market Value Forecast (US$ Million), 2022 to 2028

Figure 101: Global Market: Company Share Analysis (2021)

Recommendations

Healthcare

Smart Pulse Oximeters Market

Published : December 2022

Healthcare

MRI-Compatible IV Infusion Pump Systems Market

Published : September 2022

Healthcare

MRI Guided Neurosurgical Ablation Market

Published : July 2022

Explore Healthcare Insights

View Reports

MRI Pulse Oximeters Market