The MRI Compatible Patient Monitoring Systems Market is estimated to be valued at USD 4.3 billion in 2025 and is projected to reach USD 6.4 billion by 2035, registering a compound annual growth rate (CAGR) of 4.0% over the forecast period.
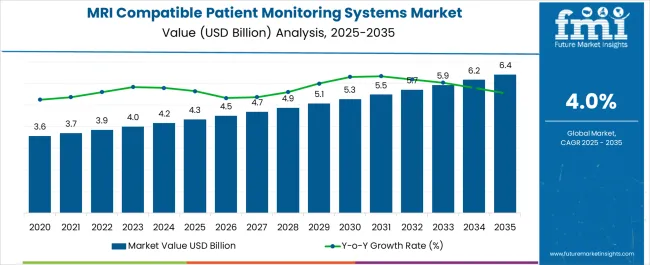
| Metric | Value |
|---|---|
| MRI Compatible Patient Monitoring Systems Market Estimated Value in (2025 E) | USD 4.3 billion |
| MRI Compatible Patient Monitoring Systems Market Forecast Value in (2035 F) | USD 6.4 billion |
| Forecast CAGR (2025 to 2035) | 4.0% |
The MRI compatible patient monitoring systems market is advancing steadily due to increasing MRI procedure volumes, growing emphasis on patient safety, and technological improvements that allow continuous physiological monitoring in high-magnetic environments. Healthcare providers are prioritizing uninterrupted monitoring to avoid patient movement or repositioning during imaging, which can otherwise lead to repeated scans and delayed diagnoses.
Investments in non-ferromagnetic components, enhanced shielding, and wireless data transmission have enabled real-time vital tracking without electromagnetic interference. Clinical adoption is further supported by evolving imaging protocols in critical care and neurology, where patient instability necessitates full-scan monitoring.
Favorable regulatory policies encouraging safety-compliant imaging equipment and hospital infrastructure modernization are further reinforcing demand. As multi-parametric data becomes essential for real-time diagnostics and AI-assisted analysis, the integration of MRI-safe monitoring solutions is expected to grow across tertiary care facilities and outpatient diagnostic centers.
The market is segmented by Product Type, Modality Type, Application, and End Use and region. By Product Type, the market is divided into Non-magnetic Devices and Magnetic Devices. In terms of Modality Type, the market is classified into Portable and Non-portable. Based on Application, the market is segmented into Multi-parameter Monitoring, Blood Glucose Monitoring, EEG and ECG Monitoring, Capnography Monitoring, Spirometer Monitoring, Sleep Apnea Monitoring, Pulse Oximeter Monitoring, Foetal Doppler Monitoring, Weight Monitoring, Temperature Monitoring, and Others. By End Use, the market is divided into Hospitals, Ambulatory Surgical Centres, Diagnostics Centres, Emergency Medical Services, and Others. Regionally, the market is classified into North America, Latin America, Western Europe, Eastern Europe, Balkan & Baltic Countries, Russia & Belarus, Central Asia, East Asia, South Asia & Pacific, and the Middle East & Africa.
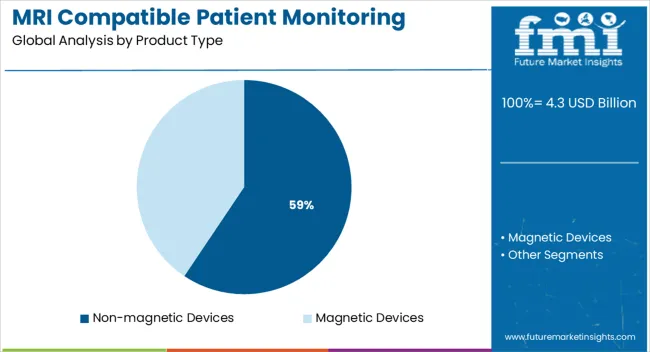
Non-magnetic devices are projected to capture 59.4% of the total revenue in the MRI compatible patient monitoring systems market by 2025, establishing themselves as the dominant product type. Their leadership is attributed to the essential requirement of zero magnetic interference within MRI suites, where patient safety and image clarity are critical.
These systems utilize fiber-optic sensors, advanced polymer casings, and specialized shielding materials that comply with international MRI safety standards. Their use ensures uninterrupted physiological data acquisition particularly ECG, respiration rate, and oxygen saturation—during imaging, eliminating the need to disconnect and reconnect patients.
Clinical preference for such devices is reinforced by risk mitigation in high-acuity cases and compliance with safety certifications such as ASTM and IEC. As MRI scan durations and complexity increase, demand for stable, non-magnetic monitoring systems is expected to remain elevated across radiology and surgical departments.
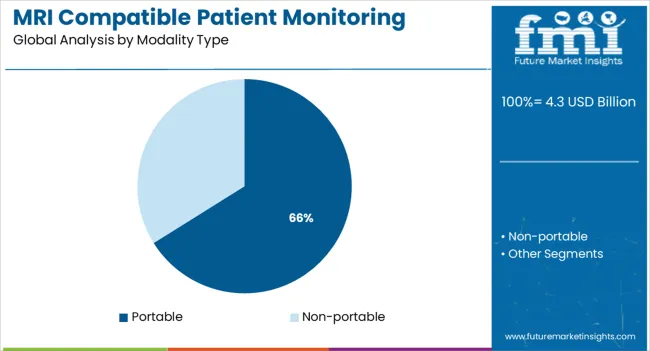
Portable systems are anticipated to lead with 66.1% revenue share in 2025 within the modality type segment. Their dominance is underpinned by rising demand for flexible, space-efficient solutions in MRI suites with limited footprint or mobile imaging units.
These compact monitors offer plug-and-play functionality and battery operation, allowing seamless transport alongside patients from ICU to MRI without disrupting data flow. The ability to standardize monitoring workflows across different hospital zones using a single device is improving adoption rates.
Moreover, portable systems reduce patient handling time, a critical parameter in emergency diagnostics and trauma cases. With healthcare institutions prioritizing throughput, workflow optimization, and infection control, MRI-compatible portable monitors are increasingly preferred over stationary alternatives for both adult and pediatric patients.
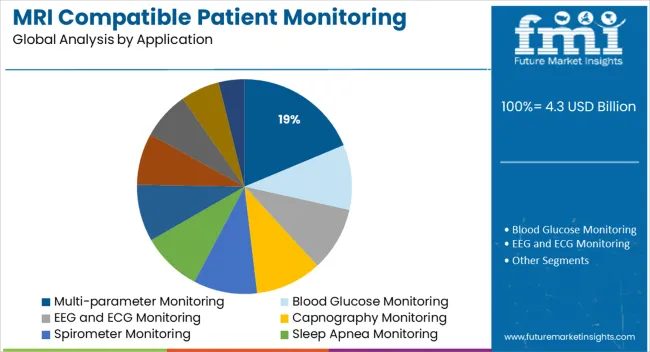
Multi-parameter monitoring is expected to hold an 18.7% share of the MRI compatible patient monitoring systems market in 2025, making it the largest application segment. This segment’s expansion is being driven by growing clinical need to track multiple vitals—such as ECG, SpO2, EtCO2, and invasive blood pressure—simultaneously during imaging of high-risk patients.
Such monitoring enables real-time adjustments in anesthesia, sedation, or ventilation protocols without interrupting the scan. Multi-parameter systems are built with MRI-conditional hardware and software, providing uninterrupted signal quality and compatibility with MRI sequences.
Adoption is further supported by complex imaging protocols in cardiology, neurology, and oncology where patient condition may deteriorate without early detection. Hospitals are standardizing multi-parameter setups to ensure comprehensive data collection while complying with MRI environment safety standards.
Drivers:
Restraints:
It is anticipated that mixed results with MRI screening may hinder the growth of the global MRI compatible patient monitoring systems market. For instance, in November 2020, researchers at Utrecht University Medical Center, The Netherlands, published a study finding that the rate of interval cancers was reduced by half in patients with dense breast tissue when mammography was complemented with magnetic resonance imaging (MRI). However, there was a significant rate of recall for additional imaging.
Some factors will limit the growth of the MRI compatible patient monitoring system market in the future. These factors include the risk associated with MRI scans, the strict regulatory requirements for approving devices, and the high cost of devices. An MRI examination takes a considerable amount of time, and critically ill patients and children are sometimes sedated during the procedure.
Medical conditions like respiratory depression and hypoxemia can sometimes result from these scans. According to the Safety Committee of the Society for Magnetic Resonance Imaging, MRI procedures should be physiologically monitored and performed only by a qualified professional.
Opportunities:
There may be ample growth opportunities for players in the MRI compatible patient monitoring system market in several unexplored markets in emerging economies. By monitoring the patient's vital signs, these systems help to avoid any emergencies during the scan. Among the vital signs that can be monitored with these systems are electrocardiography, pulse oximetry, and invasive blood pressure (IBP).
Further, these systems can be used to monitor pediatric patients, patients who are mentally ill, and critically ill patients, as well as patients with compromised physiologic functions. In this way, the players may be able to expand their product portfolios as the number of applications for these systems grows.
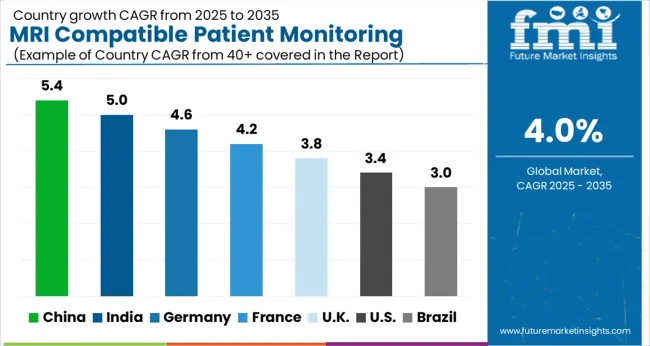
With a market share of 35.2% in 2025, North America is expected to dominate the MRI compatible patient monitoring systems market. As a result of an increasing geriatric population, lifestyle-associated diseases, and the adoption of technologically advanced devices, North America may dominate the global MRI compatible patient monitoring system market in the years to come.
As medical infrastructure and reimbursement facilities develop along with technological advancements, the North American MRI compatible patient monitoring systems market is expected to register significant growth over the forecast period.
The North American MRI compatible patient monitoring system market size is expected to grow due to high healthcare spending and rising chronic disease prevalence.
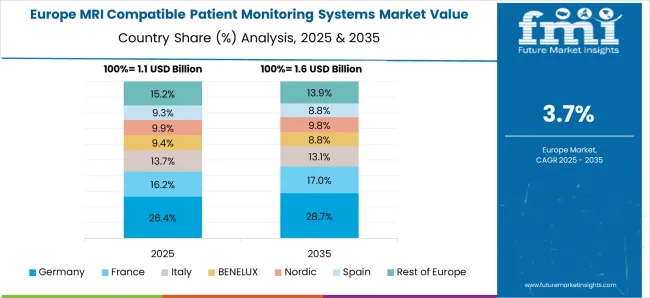
Europe is expected to contribute modestly to the market, as well as a healthy growth rate, with MRI compatible patient monitoring systems occupying 31.9% of the market in 2025.
With an increase in elderly people and growing awareness about MRI compatible patient monitoring systems, the European MRI compatible patient monitoring systems market is expected to grow. In fact, 47% of the four million deaths there each year are caused by cardiovascular diseases, according to the European Society of Cardiology, a non-profit medical organization.
In developing economies, favorable government policies for start-up companies like medical device manufacturers and new manufacturing facilities support capacity expansion by leading manufacturers.
The Butterfly iQ, created by Butterfly Network, is a portable, handheld ultrasound imaging device with a built-in battery and wireless charging that can perform scans for more than two hours. Butterfly Network was founded in 2011.
Additionally, it enables the organization, searching, and access of cloud-based studies via mobile or web. Several prominent investors have contributed to the raising of USD 350 million raised by this start-up, triggering new trends in the market for MRI-compatible patient monitoring systems.
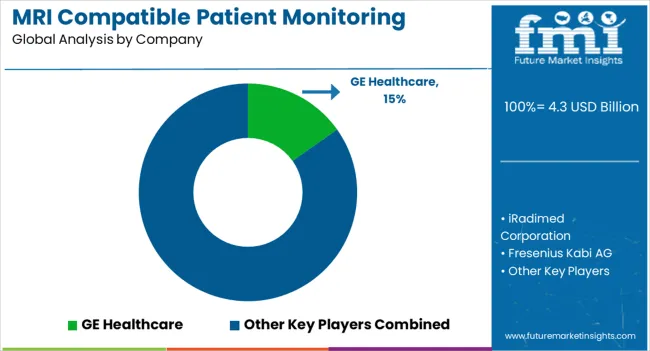
MRI Compatible Patient Monitoring Systems Market: Key Contracts/ Agreements/ Acquisitions/ Recent Developments
To increase the adoption and usage of MRI machines in the field of medical imaging, key players are developing machines with high field strength. Aside from expansions of their regional and service portfolios, these players are also undertaking mergers and acquisitions.
| Report Attribute | Details |
|---|---|
| Growth Rate | CAGR of 4% from 2025 to 2035 |
| Base Year for Estimation | 2025 |
| Historical Data | 2020 to 2024 |
| Forecast Period | 2025 to 2035 |
| Quantitative Units | Revenue in USD Million and CAGR from 2025 to 2035 |
| Report Coverage | Revenue Forecast, Volume Forecast, Company Ranking, Competitive Landscape, Growth Factors, Trends, and Pricing Analysis |
| Segments Covered |
Product Type, Modality Type, Application, End Use, Region |
| Regions Covered |
North America; Latin America; The Asia Pacific; Middle East and Africa(MEA); Europe |
| Key Countries Profiled | USA, Canada, Brazil, Argentina, Germany, United Kingdom, France, Spain, Italy, Nordics, BENELUX, Australia & New Zealand, China, India, GCC Countries, South Africa |
| Key Companies Profiled |
Arcomed AG; PULSION Medical Systems SE; LiDCO Group PLC; CAS Medical Systems; Deltex Medical Group PLC; Philips Medical Systems; GE Healthcare; Draeger Medical, Inc.; Schwarzer Cardiotek GmbH; Tensys Medical, Inc. |
| Customization | Available Upon Request |
The global mri compatible patient monitoring systems market is estimated to be valued at USD 4.3 billion in 2025.
The market size for the mri compatible patient monitoring systems market is projected to reach USD 6.4 billion by 2035.
The mri compatible patient monitoring systems market is expected to grow at a 4.0% CAGR between 2025 and 2035.
The key product types in mri compatible patient monitoring systems market are non-magnetic devices and magnetic devices.
In terms of modality type, portable segment to command 66.1% share in the mri compatible patient monitoring systems market in 2025.


Full Research Suite comprises of:
Market outlook & trends analysis
Interviews & case studies
Strategic recommendations
Vendor profiles & capabilities analysis
5-year forecasts
8 regions and 60+ country-level data splits
Market segment data splits
12 months of continuous data updates
DELIVERED AS:
PDF EXCEL ONLINE
MRI-Guided Cardiac Ablation Market Size and Share Forecast Outlook 2025 to 2035
MRI-based Quantitative Biomarkers Market Analysis - Size, Share, and Forecast Outlook 2025 to 2035
MRI Pulse Oximeters Market Size and Share Forecast Outlook 2025 to 2035
MRI Transport Market Size and Share Forecast Outlook 2025 to 2035
MRI-Safe CRT Devices Market Size and Share Forecast Outlook 2025 to 2035
MRI Guided Neurosurgical Ablation Market Insights - Demand & Growth 2025 to 2035
MRI Safe Biopsy Needle Market
MRI Safe Defibrillator Market
MRI-Safe Neurostimulation Systems Market Growth - Trends & Forecast 2025 to 2035
MRI Compatible Biopsy Devices Market
MRI-Compatible IV Infusion Pump Systems Market Growth – Trends & Forecast 2025-2035
Memristor Market Size and Share Forecast Outlook 2025 to 2035
Breast MRI Screening Market Size and Share Forecast Outlook 2025 to 2035
Portable MRI Market Analysis - Size, Share & Forecast 2025 to 2035
Preclinical MRI Equipment Market Size and Share Forecast Outlook 2025 to 2035
Magnetic Resonance Imaging (MRI) Contrast Agents Market Size and Share Forecast Outlook 2025 to 2035
Magnetic Resonance Imaging (MRI) Market Trends - Size, Share & Forecast 2025 to 2035
Biocompatible Materials Market Size and Share Forecast Outlook 2025 to 2035
Biocompatible Polymers Market Trend Analysis Based on Product, Polymer, Application, and Region 2025 to 2035
Blood Compatible Nanocoating Market Size and Share Forecast Outlook 2025 to 2035

Thank you!
You will receive an email from our Business Development Manager. Please be sure to check your SPAM/JUNK folder too.
Chat With
MaRIA