Pulse Flours Market
Market Insights on Pulse Flours covering sales outlook, demand forecast & up-to-date key trends
Pulse Flours Market By Product Type (Chickpea, Lentils, Pea, Beans), Application (Bakery and Confectionery, Extruded products, Beverages), Distribution Channel (Food Chain Services, Modern Trade, Convenience Store, Departmental Store) & Region - Forecast to 2021 - 2031
Pulse Flours Market Overview
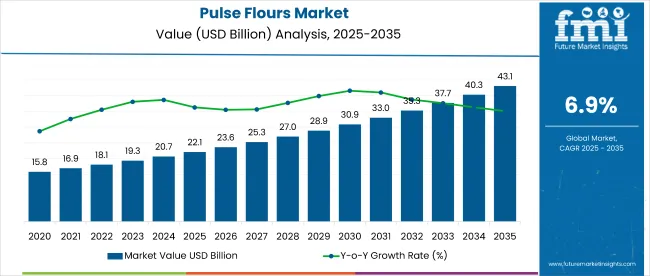
[250 Pages Report] The global pulse flours market will hold around 0.9% of the global flours market in 2021. Demand for pulse flours is expected to reach US$ 17,079.8 Mn in 2021, according to the latest Future Market Insights (FMI) study. The market value is expected to reach US$ 47,201.8 Mn by 2031, exhibiting growth at healthy CAGR of 10.7% for 2021-31.
The need for gluten-free flour and a healthier alternative to conventionally accessible meals is predicted to drive the pulse flours industry. Texture, emulsifiers, protein components, and other consumer applications are only a few examples. The high vitamin and protein content of pulse flour is expected to help the industry expand further into metropolitan areas, as the working class is more prone to prefer healthier products than other demographics.
Let us know your requirement to get
100% FREE customization
Key Points Covered in Pulse Flours Market Study
- Market estimates and forecast 2015-2031
- Key drivers and restraints impacting market growth
- Segment-wise, Country-wise, and Region-wise Analysis
- Competition Mapping and Benchmarking
- Brand share and Market Share Analysis
- Key Product Innovations and Regulatory Climate
- COVID-19 Impact on Pulse Flours Market and How to Navigate
- Recommendation on Key Winning Strategies
Pulse Flours Market Outlook 2016-2020 in Comparison to 2021-2031 Growth Forecast
As per Future Market Insights (FMI), the global Pulse Flours market grew at a steady CAGR of 8.8% between 2016 and 2020.
Owing to properties such as low-fat, high fiber content and low glycemic content demand for pulse flour is expected to increase in the near future. As compared to wheat or rice flour, the product offers significant health benefits. Therefore, pulse flours are being increasingly used in various blends and mixes of food products with high nutritional and protein content.
At the same time, increasing demand for gluten-free food items is reflecting favorably of the global pulse flour market. In order to improve product quality, manufacturers are heavily investing in R&D programs. This is also leading to development of novel pulse flour variants that can be used in a range of food applications.
Companies manufacturing pulse flours are also stepping up effort to improve the refining techniques, particularly for new variants. The aforementioned mentioned factors are expected to new opportunities for pulse flours during the assessment period and the market is predicted to grow at a CAGR of 10.7% between 2021 and 2031.
Growing Use of Pulse Flour in New Nutrition and Protein Blends
The focus is on enhancing flour and making it more functional, nutritious, and high in protein. As a result, producers are including goods like pulse flours in their offerings.
Furthermore, combining a small amount of these functional flours with other types of wheat flour can boost protein and other nutrient content. Manufacturers are also concentrating on the development of gluten-free flour mixes that not only have nutritional benefits but also have a distinct sensory appeal.
Find your sweet spots for generating winning opportunities in this market.
Talk to AnalystLong Cultural Legacy of Pulse Enabling Quick Adoption
Pulses have been important both culturally and historically, as reflected in modern cooking styles present all around the world. For centuries, domesticated pulse has been popular to all peoples, with no dictation of religion, culture or race. The United Nations (UN) celebrated 2016 as the International Year of Pulses.
An International Year designation provides a unique opportunity to increase awareness and to appreciate the role of chickpeas, beans, lentils and other pulses in feeding the world. Such initiatives are aligned with the efforts to encourage stakeholders to enhance awareness about pulse production and consumption around the world.
Global Consumption of Pulses Remains Relatively Low Compared to Other Crops
Although the global production of has consistently increased but it is far lesser when compared with other crops such as wheat, rice, maize and soya. Consumption of pulses has remained moderate in both developing and developed countries whereas consumption of meat and dairy products has increased substantially and trend is expected to continue in the years to follow.
According to the Food and Agricultural Organization of the UN, no major changes are foreseen in per capita consumption of pulses, with the world average remaining at around 7 kg/person/year. This is partly attributed to the changing consumer preference and diet patterns.
As countries become richer, populations are shifting from vegetable proteins to more expensive protein sources like dairy and meat. Nonetheless, this scenario does not indicate any possibilities of drop in demand or surplus of pulses.

An unified Market Research Subscription Platform, built for today’s disparate research needs.
Country-wise Insights
Demand for Pulse Flours is Rapidly Increasing in the US
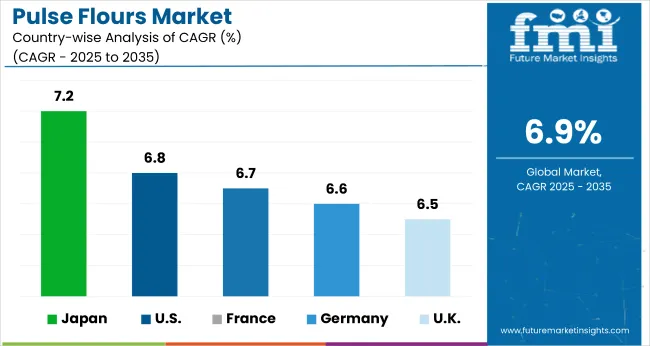
According to FMI’s analysis, US is forecast to grow at a CAGR of 10.3%. Due to the consistency in consumer spending, the food and beverage business in North America has remained steady. Changes to the Food Safety Modernization Act (FSMA) in the US could imply that food safety rules in the United States will be more focused on preventing food contamination rather than responding to claims of food adulteration.
Consumers in the US and Canada have been increasingly conscious of the ingredients used by manufacturers as their awareness of the significance of food in health and well-being has grown. Due to the aforementioned considerations, demand for pulse flours is rapidly increasing in the US.
Chickpeas, beans, and peas are among the most popular pulses in the US. Pulses are also popular among consumers as they are seen as a good source of fibre and protein, which is increasing demand for pulse flours in the US.
Brazil and Chile are expected to Present Lucrative Opportunities for Market Players
According to FMI’s analysis, Brazil and Chile together hold market share of more than 45% of the Latin American market. Consumption of pulses is relatively high in LATAM countries. Pulses were found in the ancient culinary in the region and is their influence in still visible in many of the Latin America dishes.
Countries such as Brazil and Chile are expected to present lucrative opportunities for market players as these countries have a higher pulse consuming population compared some of the other countries in the region. Factors as such are expected to support the growth of the market Latin America during the assessment period.
Europe Pulse Flours Market Outlook
The most popular pulse crops grown in Europe are beans, peas, and sweet lupines which are grown on respectively 660.000, 335.000 and 50.000 hectares. It has been observed that demand for new food product with pulse ingredients in gaining traction in the region. In EU, yield of such crops has consistently improved over the past decades.
Advancement in seed genetics and agricultural techniques has been the two major factors driving the pulse production in the region. Meanwhile increase awareness about the health benefits of high-value pulse based products is expected to propel if the demand for pulse flour in EU.
Opportunities in Japanese Pulse Flours Market
According to FMI’s analysis, Japan is forecast to grow at a CAGR of 6.9%. Japan, being a developed country, has remained a valuable market for food and beverage producers, particularly those involved in the processing of grains and vegetables. Japan continues to rely on foreign imports to meet its food and beverage needs, which creates a multitude of opportunities for international businesses.
Global manufacturers are concentrating their efforts on gaining greater access to the Japanese market. Pulses are mostly consumed as processed food in Japan. Pulses can also be found in foods such as snacks, dairy products, and baked goods. This is a primary driving force in the Japanese pulse flours market.
APEJ is likely to continue to be the Fastest Growing Market for Pulse Flours
Asia Pacific excluding Japan (APEJ) continues to be one of the most important markets for food and beverage producers around the world. The world's leading food producers, importers, and exporters all call the region home. There are plenty of opportunities since the region is home to some of the world's most populous countries. New solutions will be required to meet the rising and changing needs of such a huge consumer base.
As a result, APEJ is likely to continue to be the largest market for pulse flour. This is partly owing to the increased consumption of pulses in various APEJ regions. India is regarded as the world's top producer and importer of pulses. Asians consume a variety of pulses as part of their basic diet. Furthermore, consumers are becoming more interested in innovative food products containing pulse components.
Category-wise Insights
Rise in Demand for Chickpeas in GCC Countries
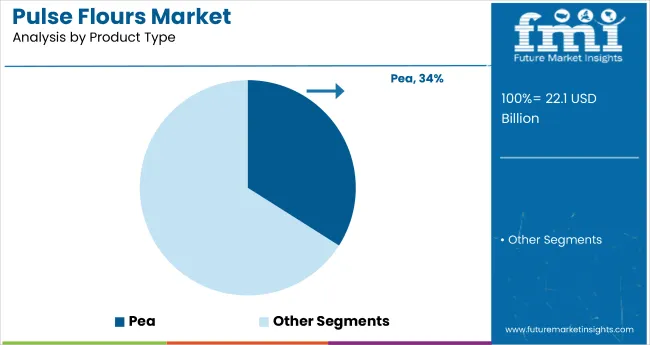
FMI forecasts the chickpea pulse flour segment to be valued at US$ 5,811.0 Mn in 2021. Pulses such as chickpeas and peas are used in many the local cuisines in the Middle East. Apart from the traditional usage, these pulse also feature in hummus, tajines, soups, and curries.
Moreover, a lot of other products have pulses in them with a view to boost the nutritional content. In the forthcoming years, pulse flour is expected find greater opportunities in the countries such as the UAE, Saudi Arabia and Qatar.
The Bakery items sub-section to Account for the highest percentage of the Food Segment
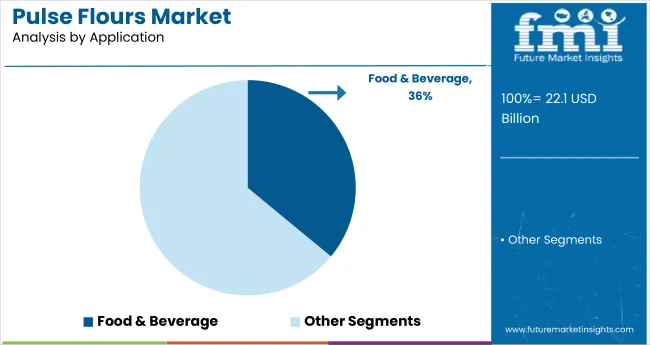
Due to rising demand for nutritious and gluten-free foods, the food segment accounted for the biggest market share overall. This increased demand for natural and organic ingredients from a greater segment of the health-conscious population motivates manufacturers to forego pricey ingredient systems in favor of developing novel flour-based systems for use in extruded food products.
Pulse flours are substituted for other agricultural products such as wheat, corn, soy, and other conventional components in a variety of food products to boost the nutritious content of the final product. This is one of the elements driving the pulse flours market in the food industry. Pulse flours were extremely important in the food processing business. The bakery items sub-section accounted for the highest percentage of the food segment.
Market Opportunities
Innovation in Processing to Increase Product Quality
Manufacturers are working hard to create techniques that will allow pulse flours used in food to maintain their optimal nutritious quality. In addition, manufacturers are implementing new technology to increase commercial capacity for value-added pulse ingredients while maintaining quality.
Instant noodles, spaghetti, extruded snacks, and morning cereals are just a few of the categories where such advancements are allowing the business to explore new possibilities.
Manufacturers and food companies have been progressively interacting and forming partnerships in order to uncover new application areas in recent years. In addition, more focus is being placed on identifying and determining functional quality and important nutrition properties of pulse-based products.
Scope of Report
Attribute |
Details |
Forecast Period |
2021-2031 |
Historical Data Available for |
2016-2020 |
Market Analysis |
USD Million for Value |
Key Countries Covered |
US, Canada, Germany, U.K., France, Italy, Spain, Russia, China, Japan, South Korea, India, Thailand, Malaysia, Indonesia, Australia, New Zealand, GCC Countries, Turkey, Northern Africa, and South Africa |
Key Segments Covered |
Product Type, Application, Distribution Channel, and Region |
Key Companies Profiled |
|
Report Coverage |
Market Forecast, Company Share Analysis, Competition Intelligence, DROT Analysis, Market Dynamics and Challenges, and Strategic Growth Initiatives |
Customization & Pricing |
Available upon Request |
Pulse Flours Market by Category
By Product Type :
- Chickpea
- Lentils
- Pea
- Beans
- Other Product Types
By Application :
- Bakery and Confectionery
- Extruded products
- Beverages
- Animal Feed
- Dairy Products
- Other Applications
By Distribution Channel :
- Food Chain Services
- Modern Trade
- Convenience Store
- Departmental Store
- Online Store
- Other Distribution Channel
By Region :
- North America
- Latin America
- Europe
- Japan
- APEJ
- MEA
Frequently Asked Questions
Pulses are the edible seeds of legumes including canned or dried beans, chickpeas, lentils, lupin (also known as lupini) beans, and a variety of peas.
If pulses are given enough sunlight, they will dry in a day. Now Heat a skillet over low heat and roast all of these pulses for 5 to 6 minutes, or until they are completely dry and crunchy. Flavour can be detected.
Powders manufactured from the fractions of high-quality lentils, peas, chickpeas, and faba beans make up pulse ingredients. AGT Foods has a technical staff with the knowledge to help producers develop new food products and improve formulas, in addition to our line of healthy pulse ingredients.
The Sweet Lupin Bean is an ancient pulse that is high in protein and fibre, as well as having a wide range of food processing applications. Sweet Lupin Flour is the superfood of wheat, ancient grain, and gluten-free flours for its better digestion and accessible nutrients.
1. Market Overview
1.1. Market Coverage / Taxonomy
1.2. Market Definition / Scope / Limitations
2. The Massive Impact of the Crisis
2.1. Global Pulse Flours Market Forecast Scenario Comparison of Annual Growth Rates for short Term (2021-2025) and Long Term (2026-2031)
2.1.1. Optimistic Scenario
2.1.2. Likely Scenario
2.1.3. Pessimistic Scenario
2.2. Key Factors Impacting the Market
Note: Market Assessment shall be Provided for Likely Scenario
3. Market Dynamics
3.1. Drivers
3.1.1. Supply Side Drivers
3.1.2. Demand Side drivers
3.1.3. Economic Side Drivers
3.2. Restraints
3.3. Opportunity
3.4. Market trends By Region
3.5. Product Launches
3.6. Product Claims & Nutritional Information Scan by Buyers
3.7. Macro-Economic Factors
3.8. Forecast Factors - Relevance & Impact
3.9. Consumers Survey Analysis
4. Key Regulations
4.1. Packaging & Labelling Regulations
4.2. Certifications and Certifying Agency Overview
4.3. Import/Export Policies
5. Value Chain Analysis
5.1. Operating margins at each node of supply chain
5.2. List of Active Market Participants
5.2.1. Raw Material Suppliers
5.2.2. Product Manufacturers
5.2.3. Key Brands
6. Global Pulse Flours Market Demand Analysis 2016-2020 and Forecast, 2021-2031
6.1. Historical Market Volume (Metric Tons) Analysis, 2016-2020
6.2. Current and Future Market Volume (Metric Tons) Projections, 2021-2031
6.3. Y-o-Y Growth Trend Analysis
7. Global Pulse Flours Market - Pricing Analysis
7.1. Regional Pricing Analysis (US$/Metric Tons) By Product Type (2016,2021,2031)
7.1.1. Chickpea
7.1.2. Lentils
7.1.3. Pea
7.1.4. Beans
7.1.5. Other Product Types
7.2. Pricing Break-up (2016,2021,2031)
7.2.1. Producer Level Pricing
7.2.2. Distributor Level Pricing
7.2.3. Retailer Level Pricing
8. Global Pulse Flours Market Demand (Size in US$ Mn) Analysis 2016-2020 and Forecast, 2021-2031
8.1. Historical Market Value (US$ Mn) Analysis, 2016-2020
8.2. Current and Future Market Value (US$ Mn) Projections, 2021-2031
8.2.1. Y-o-Y Growth Trend Analysis
8.2.2. Absolute $ Opportunity Analysis
9. Global Pulse Flours Market Analysis 2016-2020 and Forecast 2021-2031, By Product Type
9.1. Introduction / Key Findings
9.2. Historical Market Size (US$ Mn) and Volume Analysis By Product Type, 2016 - 2020
9.3. Current and Future Market Size (US$ Mn) and Volume Analysis and Forecast By Product Type, 2021-2031
9.3.1. Wild
9.3.2. Cultivated
9.4. Market Attractiveness Analysis By Product Type
10. Global Pulse Flours Market Analysis 2016-2020 and Forecast 2021-2031, By Application
10.1. Introduction / Key Findings
10.2. Historical Market Size (US$ Mn) and Volume Analysis By Application, 2016 - 2020
10.3. Current and Future Market Size (US$ Mn) and Volume Analysis and Forecast By Application 2021-2031
10.3.1. Powder
10.3.2. Raw
10.3.3. Extract
10.4. Market Attractiveness Analysis By Application
11. Global Pulse Flours Market Analysis 2016-2020 and Forecast 2021-2031, By Distribution Channel
11.1. Introduction / Key Findings
11.2. Historical Market Size (US$ Mn) and Volume Analysis By Distribution Channel, 2016 - 2020
11.3. Current and Future Market Size (US$ Mn) and Volume Analysis and Forecast By Distribution Channel 2021-2031
11.3.1. Personal Care Products
11.3.2. Dietary Supplements
11.3.3. Food & Beverages
11.3.4. Pharmaceutical Products
11.4. Market Attractiveness Analysis By Distribution Channel
12. Global Pulse Flours Market Analysis 2016-2020 and Forecast 2021-2031, By Region
12.1. Introduction
12.2. Historical Market Size (US$ Mn) and Volume Analysis By Region, 2016 - 2020
12.3. Current Market Size (US$ Mn) and Volume Analysis and Forecast By Region, 2021-2031
12.3.1. North America
12.3.2. Latin America
12.3.3. Europe
12.3.4. Japan
12.3.5. APEJ
12.3.6. MEA
12.4. Market Attractiveness Analysis By Region
13. North America Pulse Flours Market Analysis 2016-2020 and Forecast 2021-2031
13.1. Introduction
13.2. Historical Market Size (US$ Mn) and Volume Trend Analysis By Market Taxonomy, 2016 - 2020
13.3. Market Size (US$ Mn) and Volume Forecast By Market Taxonomy, 2021 - 2031
13.3.1. By Country
13.3.1.1. U.S.
13.3.1.2. Canada
13.3.2. By Product Type
13.3.3. By Distribution Channel
13.3.4. By Application
13.4. Market Attractiveness Analysis
13.4.1. By Product Type
13.4.2. By Distribution Channel
13.4.3. By Application
13.5. Market Trends
13.6. Key Market Participants - Intensity Mapping
13.7. Drivers and Restraints - Impact Analysis
14. Latin America Pulse Flours Market Analysis 2016-2020 and Forecast 2021-2031
14.1. Introduction
14.2. Historical Market Size (US$ Mn) and Volume Trend Analysis By Market Taxonomy, 2016 - 2020
14.3. Market Size (US$ Mn) and Volume Forecast By Market Taxonomy, 2021 - 2031
14.3.1. By Country
14.3.1.1. Brazil
14.3.1.2. Mexico
14.3.1.3. Argentina
14.3.1.4. Rest of Latin America
14.3.2. By Product Type
14.3.3. By Distribution Channel
14.3.4. By Application
14.4. Market Attractiveness Analysis
14.4.1. By Product Type
14.4.2. By Distribution Channel
14.4.3. By Application
14.5. Market Attractiveness Analysis
14.6. Market Trends
14.7. Key Market Participants - Intensity Mapping
14.8. Drivers and Restraints - Impact Analysis
15. Europe Pulse Flours Market Analysis 2016-2020 and Forecast 2021-2031
15.1. Introduction
15.2. Historical Market Size (US$ Mn) and Volume Trend Analysis By Market Taxonomy, 2016 - 2020
15.3. Market Size (US$ Mn) and Volume Forecast By Market Taxonomy, 2021 - 2031
15.3.1. By Country
15.3.1.1. Germany
15.3.1.2. UK
15.3.1.3. France
15.3.1.4. Italy
15.3.1.5. Nordic
15.3.1.6. Rest of Europe
15.3.2. By Source
15.3.3. By Distribution Channel
15.3.4. By Application
15.4. Market Attractiveness Analysis
15.4.1. By Product Type
15.4.2. By Distribution Channel
15.4.3. By Application
15.5. Market Attractiveness Analysis
15.6. Market Trends
15.7. Key Market Participants - Intensity Mapping
15.8. Drivers and Restraints - Impact Analysis
16. Japan Pulse Flours Market Analysis 2016-2020 and Forecast 2021-2031
16.1. Introduction
16.2. Historical Market Size (US$ Mn) and Volume Trend Analysis By Market Taxonomy, 2016 - 2020
16.3. Market Size (US$ Mn) and Volume Forecast By Market Taxonomy, 2021 - 2031
16.3.1. By Product Type
16.3.2. By Distribution Channel
16.3.3. By Application
16.4. Market Attractiveness Analysis
16.4.1. By Product Type
16.4.2. By Distribution Channel
16.4.3. By Application
16.5. Market Attractiveness Analysis
16.6. Market Trends
16.7. Key Market Participants - Intensity Mapping
16.8. Drivers and Restraints - Impact Analysis
17. APAC excl. Japan Pulse Flours Market Analysis 2016-2020 and Forecast 2021-2031
17.1. Introduction
17.2. Historical Market Size (US$ Mn) and Volume Trend Analysis By Market Taxonomy, 2016 - 2020
17.3. Market Size (US$ Mn) and Volume Forecast By Market Taxonomy, 2021 - 2031
17.3.1. By Country
17.3.1.1. China
17.3.1.2. India
17.3.1.3. Thailand
17.3.1.4. Singapore
17.3.1.5. Australia
17.3.1.6. Rest of APEJ
17.3.2. By Product Type
17.3.3. By Distribution Channel
17.3.4. By Application
17.4. Market Attractiveness Analysis
17.4.1. By Product Type
17.4.2. By Distribution Channel
17.4.3. By Application
17.5. Market Attractiveness Analysis
17.6. Market Trends
17.7. Key Market Participants - Intensity Mapping
17.8. Drivers and Restraints - Impact Analysis
18. Middle East and Africa Pulse Flours Market Analysis 2016-2020 and Forecast 2021-2031
18.1. Introduction
18.2. Historical Market Size (US$ Mn) and Volume Trend Analysis By Market Taxonomy, 2016 - 2020
18.3. Market Size (US$ Mn) and Volume Forecast By Market Taxonomy, 2021 - 2031
18.3.1. By Country
18.3.1.1. GCC Countries
18.3.1.2. South Africa
18.3.1.3. Rest of MEA
18.3.2. By Product Type
18.3.3. By Distribution Channel
18.3.4. By Application
18.4. Market Attractiveness Analysis
18.4.1. By Product Type
18.4.2. By Distribution Channel
18.4.3. By Application
18.5. Market Attractiveness Analysis
18.6. Market Trends
18.7. Key Market Participants - Intensity Mapping
18.8. Drivers and Restraints - Impact Analysis
19. Key Countries Pulse Flours Market Analysis 2016–2020 and Forecast 2021–2031
19.1. U.S.
19.1.1. Introduction
19.1.2. Market Value Analysis 2016–2020 and Forecast 2021–2031
19.1.2.1. By Product Type
19.1.2.2. By Distribution Channel
19.1.2.3. By Application
19.2. Canada
19.2.1. Market Value Analysis 2016–2020 and Forecast 2021–2031
19.2.1.1. By Product Type
19.2.1.2. By Distribution Channel
19.2.1.3. By Application
19.2.2. Market Value Analysis 2016–2020 and Forecast 2021–2031
19.2.2.1. By Product Type
19.2.2.2. By Distribution Channel
19.2.2.3. By Application
19.3. Mexico
19.3.1. Market Value Analysis 2016–2020 and Forecast 2021–2031
19.3.1.1. By Product Type
19.3.1.2. By Distribution Channel
19.3.1.3. By Application
19.4. Brazil
19.4.1. Market Value Analysis 2016–2020 and Forecast 2021–2031
19.4.1.1. By Product Type
19.4.1.2. By Distribution Channel
19.4.1.3. By Application
19.5. Argentina
19.5.1. Market Value Analysis 2016–2020 and Forecast 2021–2031
19.5.1.1. By Product Type
19.5.1.2. By Distribution Channel
19.5.1.3. By Application
19.6. Germany
19.6.1. Market Value Analysis 2016–2020 and Forecast 2021–2031
19.6.1.1. By Product Type
19.6.1.2. By Distribution Channel
19.6.1.3. By Application
19.7. UK
19.7.1. Market Value Analysis 2016–2020 and Forecast 2021–2031
19.7.1.1. By Product Type
19.7.1.2. By Distribution Channel
19.7.1.3. By Application
19.8. France
19.8.1. Market Value Analysis 2016–2020 and Forecast 2021–2031
19.8.1.1. By Product Type
19.8.1.2. By Distribution Channel
19.8.1.3. By Application
19.9. Italy
19.9.1. Market Value Analysis 2016–2020 and Forecast 2021–2031
19.9.1.1. By Product Type
19.9.1.2. By Distribution Channel
19.9.1.3. By Application
19.10. Nordic
19.10.1. Market Value Analysis 2016–2020 and Forecast 2021–2031
19.10.1.1. By Product Type
19.10.1.2. By Distribution Channel
19.10.1.3. By Application
19.11. China
19.11.1. Market Value Analysis 2016–2020 and Forecast 2021–2031
19.11.1.1. By Product Type
19.11.1.2. By Distribution Channel
19.11.1.3. By Application
19.12. Japan
19.12.1. Market Value Analysis 2016–2020 and Forecast 2021–2031
19.12.1.1. By Product Type
19.12.1.2. By Distribution Channel
19.12.1.3. By Application
19.13. Thailand
19.13.1. Market Value Analysis 2016–2020 and Forecast 2021–2031
19.13.1.1. By Product Type
19.13.1.2. By Distribution Channel
19.13.1.3. By Application
19.14. India
19.14.1. Market Value Analysis 2016–2020 and Forecast 2021–2031
19.14.1.1. By Product Type
19.14.1.2. By Distribution Channel
19.14.1.3. By Application
19.15. Singapore
19.15.1. Market Value Analysis 2016–2020 and Forecast 2021–2031
19.15.1.1. By Product Type
19.15.1.2. By Distribution Channel
19.15.1.3. By Application
19.16. Australia
19.16.1. Market Value Analysis 2016–2020 and Forecast 2021–2031
19.16.1.1. By Product Type
19.16.1.2. By Distribution Channel
19.16.1.3. By Application
19.17. South Africa
19.17.1. Market Value Analysis 2016–2020 and Forecast 2021–2031
19.17.1.1. By Product Type
19.17.1.2. By Distribution Channel
19.17.1.3. By Application
20. Market Structure Analysis
20.1. Market Analysis by Tier of Companies
20.2. Company Share Analysis of Top Players
20.3. Market Presence Analysis
21. Competition Analysis
21.1. Competition Dashboard
21.2. Competition Deep Dive (Tentative List)
21.2.1. Archer Daniels Midland Company
21.2.1.1. Overview
21.2.1.2. Product Portfolio
21.2.1.3. Profitability by Market Segments (Product/Channel/Region)
21.2.1.4. Sales Footprint
21.2.1.5. Strategy Overview
21.2.1.5.1. Marketing Strategy
21.2.1.5.2. Product Strategy
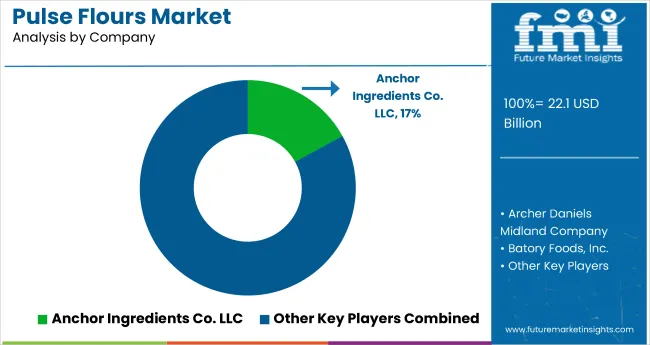
21.2.2. Anchor Ingredients Co. Llc.
21.2.2.1. Overview
21.2.2.2. Product Portfolio
21.2.2.3. Profitability by Market Segments (Product/Channel/Region)
21.2.2.4. Sales Footprint
21.2.2.5. Strategy Overview
21.2.2.5.1. Marketing Strategy
21.2.2.5.2. Product Strategy
21.2.3. Batory Foods, Inc.
21.2.3.1. Overview
21.2.3.2. Product Portfolio
21.2.3.3. Profitability by Market Segments (Product/Channel/Region)
21.2.3.4. Sales Footprint
21.2.3.5. Strategy Overview
21.2.3.5.1. Marketing Strategy
21.2.3.5.2. Product Strategy
21.2.4. Bean Growers Australia Limited
21.2.4.1. Overview
21.2.4.2. Product Portfolio
21.2.4.3. Profitability by Market Segments (Product/Channel/Region)
21.2.4.4. Sales Footprint
21.2.4.5. Strategy Overview
21.2.4.5.1. Marketing Strategy
21.2.4.5.2. Product Strategy
21.2.5. Best Cooking Pulses Inc.
21.2.5.1. Overview
21.2.5.2. Product Portfolio
21.2.5.3. Profitability by Market Segments (Product/Channel/Region)
21.2.5.4. Sales Footprint
21.2.5.5. Strategy Overview
21.2.5.5.1. Marketing Strategy
21.2.5.5.2. Product Strategy
21.2.6. Blue Ribbon Grain & Pulses Pty Ltd
21.2.6.1. Overview
21.2.6.2. Product Portfolio
21.2.6.3. Profitability by Market Segments (Product/Channel/Region)
21.2.6.4. Sales Footprint
21.2.6.5. Strategy Overview
21.2.6.5.1. Marketing Strategy
21.2.6.5.2. Product Strategy
21.2.7. CanMar Grain Products
21.2.7.1. Overview
21.2.7.2. Product Portfolio
21.2.7.3. Profitability by Market Segments (Product/Channel/Region)
21.2.7.4. Sales Footprint
21.2.7.5. Strategy Overview
21.2.7.5.1. Marketing Strategy
21.2.7.5.2. Product Strategy
21.2.8. Diefenbaker Spice & Pulse
21.2.8.1. Overview
21.2.8.2. Product Portfolio
21.2.8.3. Profitability by Market Segments (Product/Channel/Region)
21.2.8.4. Sales Footprint
21.2.8.5. Strategy Overview
21.2.8.5.1. Marketing Strategy
21.2.8.5.2. Product Strategy
21.2.9. Ehl Ingredients Limited
21.2.9.1. Overview
21.2.9.2. Product Portfolio
21.2.9.3. Profitability by Market Segments (Product/Channel/Region)
21.2.9.4. Sales Footprint
21.2.9.5. Strategy Overview
21.2.9.5.1. Marketing Strategy
21.2.9.5.2. Product Strategy
21.2.10. Great Western Grain Company Ltd
21.2.10.1. Overview
21.2.10.2. Product Portfolio
21.2.10.3. Profitability by Market Segments (Product/Channel/Region)
21.2.10.4. Sales Footprint
21.2.10.5. Strategy Overview
21.2.10.5.1. Marketing Strategy
21.2.10.5.2. Product Strategy
21.2.11. Ingredion Incorporated
21.2.11.1. Overview
21.2.11.2. Product Portfolio
21.2.11.3. Profitability by Market Segments (Product/Channel/Region)
21.2.11.4. Sales Footprint
21.2.11.5. Strategy Overview
21.2.11.5.1. Marketing Strategy
21.2.11.5.2. Product Strategy
21.2.12. Parakh Agro Industries Limited
21.2.12.1. Overview
21.2.12.2. Product Portfolio
21.2.12.3. Profitability by Market Segments (Product/Channel/Region)
21.2.12.4. Sales Footprint
21.2.12.5. Strategy Overview
21.2.12.5.1. Marketing Strategy
21.2.12.5.2. Product Strategy
21.2.13. SunOpta, Inc.
21.2.13.1. Overview
21.2.13.2. Product Portfolio
21.2.13.3. Profitability by Market Segments (Product/Channel/Region)
21.2.13.4. Sales Footprint
21.2.13.5. Strategy Overview
21.2.13.5.1. Marketing Strategy
21.2.13.5.2. Product Strategy
21.2.14. The Scoular Company
21.2.14.1. Overview
21.2.14.2. Product Portfolio
21.2.14.3. Profitability by Market Segments (Product/Channel/Region)
21.2.14.4. Sales Footprint
21.2.14.5. Strategy Overview
21.2.14.5.1. Marketing Strategy
21.2.14.5.2. Product Strategy
21.2.15. Other Players (On Additional Requests)
21.2.15.1. Overview
21.2.15.2. Product Portfolio
21.2.15.3. Profitability by Market Segments (Product/Channel/Region)
21.2.15.4. Sales Footprint
21.2.15.5. Strategy Overview
21.2.15.5.1. Marketing Strategy
21.2.15.5.2. Product Strategy
22. Assumptions and Acronyms Used
23. Research Methodology
Let us know your requirement to get
100% FREE customization
Table 01: Global Pulse Flour Market Value (US$ Mn), 2016-2020
Table 02: Global Pulse Flour Market Value (US$ Mn), 2021-2031
Table 03: Global Pulse Flour Market Value (US$ Mn) and Y-o-Y, 2021-2031
Table 04: Global Chickpea Segment Value (US$ Mn), By Region 2016-2020
Table 05: Global Chickpea Segment Value (US$ Mn), By Region 2021-2031
Table 06: Global Chickpea Segment Market Share, By Region 2016-2020
Table 07: Global Chickpea Segment Market Share, By Region 2021-2031
Table 08: Global Chickpea Segment Y-o-Y, By Region 2021-2031
Table 09: Global Lentils Segment Value (US$ Mn), By Region 2016-2020
Table 10: Global Lentils Segment Value (US$ Mn), By Region 2021-2031
Table 11: Global Lentils Segment Market Share, By Region 2016-2020
Table 12: Global Lentils Segment Market Share, By Region 2021-2031
Table 13: Global Lentils Segment Y-o-Y, By Region 2021-2031
Table 14: Global Pea Segment Value (US$ Mn), By Region 2016-2020
Table 15: Global Pea Segment Value (US$ Mn), By Region 2021-2031
Table 16: Global Pea Segment Market Share, By Region 2016-2020
Table 17: Global Pea Segment Market Share, By Region 2021-2031
Table 18: Global Pea Segment Y-o-Y, By Region 2021-2031
Table 19: Global Beans Segment Value (US$ Mn), By Region 2016-2020
Table 20: Global Beans Segment Value (US$ Mn), By Region 2021-2031
Table 21: Global Beans Segment Market Share, By Region 2016-2020
Table 22: Global Beans Segment Market Share, By Region 2021-2031
Table 23: Global Beans Segment Y-o-Y, By Region 2021-2031
Table 24: Global Other Product Types Segment Value (US$ Mn), By Region 2016-2020
Table 25: Global Other Product Types Segment Value (US$ Mn), By Region 2021-2031
Table 26: Global Other Product Types Segment Market Share, By Region 2016-2020
Table 27: Global Other Product Types Segment Market Share, By Region 2021-2031
Table 28: Global Other Product Types Segment Y-o-Y, By Region 2021-2031
Table 29: Global Food Chain Services Segment Value (US$ Mn), By Region 2016-2020
Table 30: Global Food Chain Services Segment Value (US$ Mn), By Region 2021-2031
Table 31: Global Food Chain Services Segment Market Share, By Region 2016-2020
Table 32: Global Food Chain Services Segment Market Share, By Region 2021-2031
Table 33: Global Food Chain Services Segment Y-o-Y, By Region 2021-2031
Table 34: Global Modern Trade Segment Value (US$ Mn), By Region 2016-2020
Table 35: Global Modern Trade Segment Value (US$ Mn), By Region 2021-2031
Table 36: Global Modern Trade Segment Market Share, By Region 2016-2020
Table 37: Global Modern Trade Segment Market Share, By Region 2021-2031
Table 38: Global Modern Trade Segment Y-o-Y, By Region 2021-2031
Table 39: Global Convenience Store Segment Value (US$ Mn), By Region 2016-2020
Table 40: Global Convenience Store Segment Value (US$ Mn), By Region 2021-2031
Table 41: Global Convenience Store Segment Market Share, By Region 2016-2020
Table 42: Global Convenience Store Segment Market Share, By Region 2021-2031
Table 43: Global Convenience Store Segment Y-o-Y, By Region 2021-2031
Table 44: Global Departmental Store Segment Value (US$ Mn), By Region 2016-2020
Table 45: Global Departmental Store Segment Value (US$ Mn), By Region 2021-2031
Table 46: Global Departmental Store Segment Market Share, By Region 2016-2020
Table 47: Global Departmental Store Segment Market Share, By Region 2021-2031
Table 48: Global Departmental Store Segment Y-o-Y, By Region 2021-2031
Table 49: Global Online Store Segment Value (US$ Mn), By Region 2016-2020
Table 50: Global Online Store Segment Value (US$ Mn), By Region 2021-2031
Table 51: Global Online Store Segment Market Share, By Region 2016-2020
Table 52: Global Online Store Segment Market Share, By Region 2021-2031
Table 53: Global Online Store Segment Y-o-Y, By Region 2021-2031
Table 54: Global Other Distribution Channel Segment Value (US$ Mn), By Region 2016-2020
Table 55: Global Other Distribution Channel Segment Value (US$ Mn), By Region 2021-2031
Table 56: Global Other Distribution Channel Segment Market Share, By Region 2016-2020
Table 57: Global Other Distribution Channel Segment Market Share, By Region 2021-2031
Table 58: Global Other Distribution Channel Segment Y-o-Y, By Region 2021-2031
Table 59: Global Bakery and Confectionery Segment Value (US$ Mn), By Region 2016-2020
Table 60: Global Bakery and Confectionery Segment Value (US$ Mn), By Region 2021-2031
Table 61: Global Bakery and Confectionery Segment Market Share, By Region 2016-2020
Table 62: Global Bakery and Confectionery Segment Market Share, By Region 2021-2031
Table 63: Global Bakery and Confectionery Segment Y-o-Y, By Region 2021-2031
Table 64: Global Extruded products Segment Value (US$ Mn), By Region 2016-2020
Table 65: Global Extruded products Segment Value (US$ Mn), By Region 2021-2031
Table 66: Global Extruded products Segment Market Share, By Region 2016-2020
Table 67: Global Extruded products Segment Market Share, By Region 2021-2031
Table 68: Global Extruded products Segment Y-o-Y, By Region 2021-2031
Table 69: Global Beverages Segment Value (US$ Mn), By Region 2016-2020
Table 70: Global Beverages Segment Value (US$ Mn), By Region 2021-2031
Table 71: Global Beverages Segment Market Share, By Region 2016-2020
Table 72: Global Beverages Segment Market Share, By Region 2021-2031
Table 73: Global Beverages Segment Y-o-Y, By Region 2021-2031
Table 74: Global Animal Feed Segment Value (US$ Mn), By Region 2016-2020
Table 75: Global Animal Feed Segment Value (US$ Mn), By Region 2021-2031
Table 76: Global Animal Feed Segment Market Share, By Region 2016-2020
Table 77: Global Animal Feed Segment Market Share, By Region 2021-2031
Table 78: Global Animal Feed Segment Y-o-Y, By Region 2021-2031
Table 79: Global Dairy Products Segment Value (US$ Mn), By Region 2016-2020
Table 80: Global Dairy Products Segment Value (US$ Mn), By Region 2021-2031
Table 81: Global Dairy Products Segment Market Share, By Region 2016-2020
Table 82: Global Dairy Products Segment Market Share, By Region 2021-2031
Table 83: Global Dairy Products Segment Y-o-Y, By Region 2021-2031
Table 84: Global Other Applications Segment Value (US$ Mn), By Region 2016-2020
Table 85: Global Other Applications Segment Value (US$ Mn), By Region 2021-2031
Table 86: Global Other Applications Segment Market Share, By Region 2016-2020
Table 87: Global Other Applications Segment Market Share, By Region 2021-2031
Table 88: Global Other Applications Segment Y-o-Y, By Region 2021-2031
Table 89: North America Pulse Flour Market Value (US$ Mn), By Country 2016-2020
Table 90: North America Pulse Flour Market Value (US$ Mn), By Country 2021-2031
Table 91: North America Pulse Flour Market Value (US$ Mn), By Product Type 2016-2020
Table 92: North America Pulse Flour Market Value (US$ Mn), By Product Type 2021-2031
Table 93: North America Pulse Flour Market Value (US$ Mn), By Distribution Channel 2016-2020
Table 94: North America Pulse Flour Market Value (US$ Mn), By Distribution Channel 2021-2031
Table 95: North America Pulse Flour Market Value (US$ Mn), By Application 2016-2020
Table 96: North America Pulse Flour Market Value (US$ Mn), By Application 2021-2031
Table 97: Latin America Pulse Flour Market Value (US$ Mn), By Country 2016-2020
Table 98: Latin America Pulse Flour Market Value (US$ Mn), By Country 2021-2031
Table 99: Latin America Pulse Flour Market Value (US$ Mn), By Product Type 2016-2020
Table 100: Latin America Pulse Flour Market Value (US$ Mn), By Product Type 2021-2031
Table 101: Latin America Pulse Flour Market Value (US$ Mn), By Distribution Channel 2016-2020
Table 102: Latin America Pulse Flour Market Value (US$ Mn), By Distribution Channel 2021-2031
Table 103: Latin America Pulse Flour Market Value (US$ Mn), By Application 2016-2020
Table 104: Latin America Pulse Flour Market Value (US$ Mn), By Application 2021-2031
Table 105: Europe Pulse Flour Market Value (US$ Mn), By Country 2016-2020
Table 106: Europe Pulse Flour Market Value (US$ Mn), By Country 2021-2031
Table 107: Europe Pulse Flour Market Value (US$ Mn), By Product Type 2016-2020
Table 108: Europe Pulse Flour Market Value (US$ Mn), By Product Type 2021-2031
Table 109: Europe Pulse Flour Market Value (US$ Mn), By Distribution Channel 2016-2020
Table 110: Europe Pulse Flour Market Value (US$ Mn), By Distribution Channel 2021-2031
Table 111: Europe Pulse Flour Market Value (US$ Mn), By Application 2016-2020
Table 112: Europe Pulse Flour Market Value (US$ Mn), By Application 2021-2031
Table 113: Japan Pulse Flour Market Value (US$ Mn), By Country 2016-2020
Table 114: Japan Pulse Flour Market Value (US$ Mn), By Country 2021-2031
Table 115: Japan Pulse Flour Market Value (US$ Mn), By Product Type 2016-2020
Table 116: Japan Pulse Flour Market Value (US$ Mn), By Product Type 2021-2031
Table 117: Japan Pulse Flour Market Value (US$ Mn), By Distribution Channel 2016-2020
Table 118: Japan Pulse Flour Market Value (US$ Mn), By Distribution Channel 2021-2031
Table 119: Japan Pulse Flour Market Value (US$ Mn), By Application 2016-2020
Table 120: Japan Pulse Flour Market Value (US$ Mn), By Application 2021-2031
Table 121: APEJ Pulse Flour Market Value (US$ Mn), By Country 2016-2020
Table 122: APEJ Pulse Flour Market Value (US$ Mn), By Country 2021-2031
Table 123: APEJ Pulse Flour Market Value (US$ Mn), By Product Type 2016-2020
Table 124: APEJ Pulse Flour Market Value (US$ Mn), By Product Type 2021-2031
Table 125: APEJ Pulse Flour Market Value (US$ Mn), By Distribution Channel 2016-2020
Table 126: APEJ Pulse Flour Market Value (US$ Mn), By Distribution Channel 2021-2031
Table 127: APEJ Pulse Flour Market Value (US$ Mn), By Application 2016-2020
Table 128: APEJ Pulse Flour Market Value (US$ Mn), By Application 2021-2031
Table 129: MEA Pulse Flour Market Value (US$ Mn), By Country 2016-2020
Table 130: MEA Pulse Flour Market Value (US$ Mn), By Country 2021-2031
Table 131: MEA Pulse Flour Market Value (US$ Mn), By Product Type 2016-2020
Table 132: MEA Pulse Flour Market Value (US$ Mn), By Product Type 2021-2031
Table 133: MEA Pulse Flour Market Value (US$ Mn), By Distribution Channel 2016-2020
Table 134: MEA Pulse Flour Market Value (US$ Mn), By Distribution Channel 2021-2031
Table 135: MEA Pulse Flour Market Value (US$ Mn), By Application 2016-2020
Table 136: MEA Pulse Flour Market Value (US$ Mn), By Application 2021-2031
Find your sweet spots for generating winning opportunities in this market.
Talk to AnalystFigure 01: Global Pulse Flour Market Value (US$ Mn), 2016-2020
Figure 02: Global Pulse Flour Market Value (US$ Mn) Forecast, 2021-2031
Figure 03: Global Pulse Flour Market Value (US$ Mn) and Y-o-Y, 2021-2031
Figure 04: Global Chickpea Segment Market Value (US$ Mn) By Region, 2016-2020
Figure 05: Global Chickpea Segment Market Value (US$ Mn) By Region, 2021-2031
Figure 06: Global Chickpea Segment Y-o-Y Growth Rate, By Region, 2021-2031
Figure 07: Global Lentils Segment Market Value (US$ Mn) By Region, 2016-2020
Figure 08: Global Lentils Segment Market Value (US$ Mn) By Region, 2021-2031
Figure 09: Global Lentils Segment Y-o-Y Growth Rate, By Region, 2021-2031
Figure 10: Global Pea Segment Market Value (US$ Mn) By Region, 2016-2020
Figure 11: Global Pea Segment Market Value (US$ Mn) By Region, 2021-2031
Figure 12: Global Pea Segment Y-o-Y Growth Rate, By Region, 2021-2031
Figure 13: Global Beans Segment Market Value (US$ Mn) By Region, 2016-2020
Figure 14: Global Beans Segment Market Value (US$ Mn) By Region, 2021-2031
Figure 15: Global Beans Segment Y-o-Y Growth Rate, By Region, 2021-2031
Figure 16: Global Other Product Types Segment Market Value (US$ Mn) By Region, 2016-2020
Figure 17: Global Other Product Types Segment Market Value (US$ Mn) By Region, 2021-2031
Figure 18: Global Other Product Types Segment Y-o-Y Growth Rate, By Region, 2021-2031
Figure 19: Global Food Chain Services Segment Market Value (US$ Mn) By Region, 2016-2020
Figure 20: Global Food Chain Services Segment Market Value (US$ Mn) By Region, 2021-2031
Figure 21: Global Food Chain Services Segment Y-o-Y Growth Rate, By Region, 2021-2031
Figure 22: Global Modern Trade Segment Market Value (US$ Mn) By Region, 2016-2020
Figure 23: Global Modern Trade Segment Market Value (US$ Mn) By Region, 2021-2031
Figure 24: Global Modern Trade Segment Y-o-Y Growth Rate, By Region, 2021-2031
Figure 25: Global Convenience Store Segment Market Value (US$ Mn) By Region, 2016-2020
Figure 26: Global Convenience Store Segment Market Value (US$ Mn) By Region, 2021-2031
Figure 27: Global Convenience Store Segment Y-o-Y Growth Rate, By Region, 2021-2031
Figure 28: Global Departmental Store Segment Market Value (US$ Mn) By Region, 2016-2020
Figure 29: Global Departmental Store Segment Market Value (US$ Mn) By Region, 2021-2031
Figure 30: Global Departmental Store Segment Y-o-Y Growth Rate, By Region, 2021-2031
Figure 31: Global Online Store Segment Market Value (US$ Mn) By Region, 2016-2020
Figure 32: Global Online Store Segment Market Value (US$ Mn) By Region, 2021-2031
Figure 33: Global Online Store Segment Y-o-Y Growth Rate, By Region, 2021-2031
Figure 34: Global Other Distribution Channel Segment Market Value (US$ Mn) By Region, 2016-2020
Figure 35: Global Other Distribution Channel Segment Market Value (US$ Mn) By Region, 2021-2031
Figure 36: Global Other Distribution Channel Segment Y-o-Y Growth Rate, By Region, 2021-2031
Figure 37: Global Bakery and Confectionery Segment Market Value (US$ Mn) By Region, 2016-2020
Figure 38: Global Bakery and Confectionery Segment Market Value (US$ Mn) By Region, 2021-2031
Figure 39: Global Bakery and Confectionery Segment Y-o-Y Growth Rate, By Region, 2021-2031
Figure 40: Global Extruded products Segment Market Value (US$ Mn) By Region, 2016-2020
Figure 41: Global Extruded products Segment Market Value (US$ Mn) By Region, 2021-2031
Figure 42: Global Extruded products Segment Y-o-Y Growth Rate, By Region, 2021-2031
Figure 43: Global Beverages Segment Market Value (US$ Mn) By Region, 2016-2020
Figure 44: Global Beverages Segment Market Value (US$ Mn) By Region, 2021-2031
Figure 45: Global Beverages Segment Y-o-Y Growth Rate, By Region, 2021-2031
Figure 46: Global Animal Feed Segment Market Value (US$ Mn) By Region, 2016-2020
Figure 47: Global Animal Feed Segment Market Value (US$ Mn) By Region, 2021-2031
Figure 48: Global Animal Feed Segment Y-o-Y Growth Rate, By Region, 2021-2031
Figure 49: Global Dairy Products Segment Market Value (US$ Mn) By Region, 2016-2020
Figure 50: Global Dairy Products Segment Market Value (US$ Mn) By Region, 2021-2031
Figure 51: Global Dairy Products Segment Y-o-Y Growth Rate, By Region, 2021-2031
Figure 52: Global Other Applications Segment Market Value (US$ Mn) By Region, 2016-2020
Figure 53: Global Other Applications Segment Market Value (US$ Mn) By Region, 2021-2031
Figure 54: Global Other Applications Segment Y-o-Y Growth Rate, By Region, 2021-2031
Figure 55: North America Pulse Flour Market Value (US$ Mn), By Country 2016-2020
Figure 56: North America Pulse Flour Market Value (US$ Mn), By Country 2021-2031
Figure 57: North America Pulse Flour Market Value (US$ Mn), By Product Type 2016-2020
Figure 58: North America Pulse Flour Market Value (US$ Mn), By Product Type 2021-2031
Figure 59: North America Pulse Flour Market Value (US$ Mn), By Distribution Channel 2016-2020
Figure 60: North America Pulse Flour Market Value (US$ Mn), By Distribution Channel 2021-2031
Figure 61: North America Pulse Flour Market Value (US$ Mn), By Application 2016-2020
Figure 62: North America Pulse Flour Market Value (US$ Mn), By Application 2021-2031
Figure 63: Latin America Pulse Flour Market Value (US$ Mn), By Country 2016-2020
Figure 64: Latin America Pulse Flour Market Value (US$ Mn), By Country 2021-2031
Figure 65: Latin America Pulse Flour Market Value (US$ Mn), By Product Type 2016-2020
Figure 66: Latin America Pulse Flour Market Value (US$ Mn), By Product Type 2021-2031
Figure 67: Latin America Pulse Flour Market Value (US$ Mn), By Distribution Channel 2016-2020
Figure 68: Latin America Pulse Flour Market Value (US$ Mn), By Distribution Channel 2021-2031
Figure 69: Latin America Pulse Flour Market Value (US$ Mn), By Application 2016-2020
Figure 70: Latin America Pulse Flour Market Value (US$ Mn), By Application 2021-2031
Figure 71: Europe Pulse Flour Market Value (US$ Mn), By Country 2016-2020
Figure 72: Europe Pulse Flour Market Value (US$ Mn), By Country 2021-2031
Figure 73: Europe Pulse Flour Market Value (US$ Mn), By Product Type 2016-2020
Figure 74: Europe Pulse Flour Market Value (US$ Mn), By Product Type 2021-2031
Figure 75: Europe Pulse Flour Market Value (US$ Mn), By Distribution Channel 2016-2020
Figure 76: Europe Pulse Flour Market Value (US$ Mn), By Distribution Channel 2021-2031
Figure 77: Europe Pulse Flour Market Value (US$ Mn), By Application 2016-2020
Figure 78: Europe Pulse Flour Market Value (US$ Mn), By Application 2021-2031
Figure 79: Japan Pulse Flour Market Value (US$ Mn), By Country 2016-2020
Figure 80: Japan Pulse Flour Market Value (US$ Mn), By Country 2021-2031
Figure 81: Japan Pulse Flour Market Value (US$ Mn), By Product Type 2016-2020
Figure 82: Japan Pulse Flour Market Value (US$ Mn), By Product Type 2021-2031
Figure 83: Japan Pulse Flour Market Value (US$ Mn), By Application 2016-2020
Figure 84: Japan Pulse Flour Market Value (US$ Mn), By Distribution Channel 2021-2031
Figure 85: Japan Pulse Flour Market Value (US$ Mn), By Application 2016-2020
Figure 86: Japan Pulse Flour Market Value (US$ Mn), By Application 2021-2031
Figure 87: APEJ Pulse Flour Market Value (US$ Mn), By Country 2016-2020
Figure 88: APEJ Pulse Flour Market Value (US$ Mn), By Country 2021-2031
Figure 89: APEJ Pulse Flour Market Value (US$ Mn), By Product Type 2016-2020
Figure 90: APEJ Pulse Flour Market Value (US$ Mn), By Product Type 2021-2031
Figure 91: APEJ Pulse Flour Market Value (US$ Mn), By Distribution Channel 2016-2020
Figure 92: APEJ Pulse Flour Market Value (US$ Mn), By Distribution Channel 2021-2031
Figure 93: APEJ Pulse Flour Market Value (US$ Mn), By Application 2016-2020
Figure 94: APEJ Pulse Flour Market Value (US$ Mn), By Application 2021-2031
Figure 95: MEA Pulse Flour Market Value (US$ Mn), By Country 2016-2020
Figure 96: MEA Pulse Flour Market Value (US$ Mn), By Country 2021-2031
Figure 97: MEA Pulse Flour Market Value (US$ Mn), By Product Type 2016-2020
Figure 98: MEA Pulse Flour Market Value (US$ Mn), By Product Type 2021-2031
Figure 99: MEA Pulse Flour Market Value (US$ Mn), By Distribution Channel 2016-2020
Figure 100: MEA Pulse Flour Market Value (US$ Mn), By Distribution Channel 2021-2031
Figure 101: MEA Pulse Flour Market Value (US$ Mn), By Application 2016-2020
Figure 102: MEA Pulse Flour Market Value (US$ Mn), By Application 2021-2031
Need specific information?
Request CustomizationExplore Food and Beverage Insights
View Reports