Reports

- Global Locations -

Headquarters

Future Market Insights, Inc.

Christiana Corporate, 200
Continental Drive, Suite 401,
Newark, Delaware - 19713,
United States

T: +1-845-579-5705

Americas

Future Market Insights, Inc.

616 Corporate Way, Suite 2-9018,
Valley Cottage, NY 10989, United States

T: +1-347-918-3531

MEA

Future Market Insights

1602-6 Jumeirah Bay X2 Tower, Plot No: JLT-PH2-X2A,
Jumeirah Lakes Towers, Dubai,
United Arab Emirates

Europe

Future Market Insights

3rd Floor, 207 Regent Street,
W1B 3HH London
United Kingdom

T: + 44 (0) 20 8123 9659
D: +44 (0) 20 3287 4268

Asia Pacific

Future Market Insights

IndiaLand Global Tech Park, Unit UG-1, Behind Grand HighStreet, Phase 1, Hinjawadi, MH, Pune – 411057, India

Pulse Width Modulation Controllers Market Outlook (2022 to 2032)

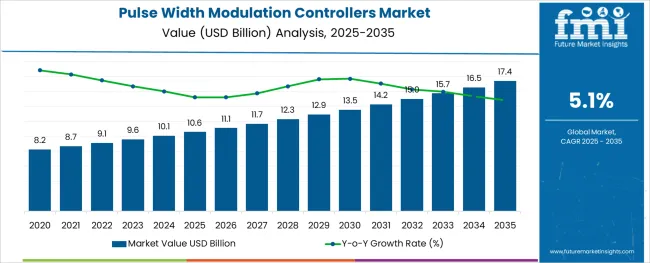
The global pulse width modulation controllers market is anticipated to be valued at US$ 9.1 Billion in 2022. The pulse width modulation controllers market share is forecasted to grow at a CAGR of 5.1% from 2022 to 2032 and reach a valuation of US$ 15 Billion by 2032.

Report Attribute Details
Pulse Width Modulation Controllers Market Value (2022) US$ 9.1 Billion
Pulse Width Modulation Controllers Market Anticipated Value (2032) US$ 15 Billion
Pulse Width Modulation Controllers Projected Growth Rate (2032) 5.1%

The high power handling capability of PWM devices makes them ideal during power supplies, which is likely to increase the demand for pulse width modulation controllers in industrial setups. Moreover, its capacity to provide an efficiency of up to 90% has also increased the demand for pulse width modulation controllers for domestic purposes as well.

Due to its noise reduction capabilities, various industries deploying PWM controllers are expected to surge the pulse width modulation controllers market trends. Additionally, the sales of pulse width modulation controllers are likely to escalate due to their improved speed control and reduced power loss.

Unlike other solar charges controllers, such as pulse position modulation (PPM), the adoption of pulse width modulation controllers does not require synchronization between transmitter and receiver. This ability to separate a signal during demodulation and noise separation is anticipated to grow the demand for pulse width modulation controllers. Moreover, the pulse width modulation controllers market growth is expected to boost due to the minimal heat required to operate the devices.

Don't pay for what you don't need

Customize your report by selecting specific countries or regions and save 30%!

What are the Key Aspects of the Pulse Width Modulation Controllers Market?

The advantage of enabling optimum solutions for systems that utilize distributed power architectures is likely to surge the adoption of pulse width modulation controllers. Likewise, the ability to use higher frequencies such as 50-100 kHz is expected to bolster the pulse width modulation controllers’ market share.

The longer battery life and extremely low power consumption of PWM controllers are anticipated to expand the pulse width modulation controllers' market size. This is owing to its ability to self-regulate its battery conditions and recharging requirements.

The ability to control temperature effects, as well as regulate voltage drops in solar panels by efficiently using solar array energy, meets consumer demands and is expected to increase the sales of pulse width modulation controllers in the coming days.

Pulse width modulation controllers market growth is expected to boost owing to the capacity of PWMs to provide point-of-load regulation in networking and industrial power supplies to various devices such as servers, workstations, telecom/datacom, microprocessor-based equipment, portable battery-powered devices, and wireless infrastructure products.

PWM techniques further enable greater efficiency of DC motors that require control of the power supplied to them and are expected to boost the demand for pulse width modulation controllers for managing and overcoming inertial loads and internal motor resistance. Also, devices equipped with smart communication technology and other technological developments, such as auto night detection capabilities and smart sensor technology, are anticipated to surge the demand for pulse width modulation controllers as well.

The low cost of manufacturing is expected to increase the adoption of pulse width modulation controllers for analog devices as the demand for analog devices increases. The pulse width modulation controllers’ market share is likely to escalate owing to the reduced requirement to switch filters.

What are the factors that hinder the Pulse Width Modulation Controllers Market Growth?

Long-term return on investments for the PWM controllers, as well as its high implementation cost, are likely to curb the sales of pulse width modulation controllers for some more years. The PWM systems require a semiconductor device that has low turn ON and turn OFF times. This is expected to increase the cost and hinder the demand for pulse width modulation controllers for a wider mass.

The complexity of the circuit may not protect the controllers during voltage spikes. This is also speculated to hamper the pulse width modulation controllers’ market growth. Further, the inability of the PWM controllers to regulate radio frequency interferences and the requirement of large bandwidth to use in communication which increases the expenses, are predicted to obstruct the adoption of pulse width modulation controllers.

Sudip Saha
Sudip Saha

Principal Consultant

Talk to Analyst

Find your sweet spots for generating winning opportunities in this market.

What are the Possibilities that will expand the Pulse Width Modulation Controllers Market?

Globalization and technological breakthroughs of PWM controllers present lucrative opportunities for market investors and are anticipated to increase the sales of pulse-width modulation controllers. Ever-increasing demand from data centers and communication base stations for PWM devices is expected to accelerate the adoption of pulse width modulation controllers further.

Research and development activities for the improvement of PWM controllers, along with the growing consumption of smart devices in developing countries and skilled manpower, are anticipated to drive the demand for pulse width modulation controllers.
How will the North America Pulse Width Modulation Controllers Market Grow?

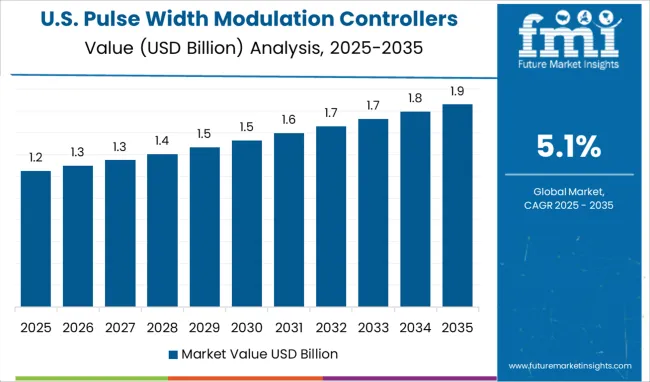
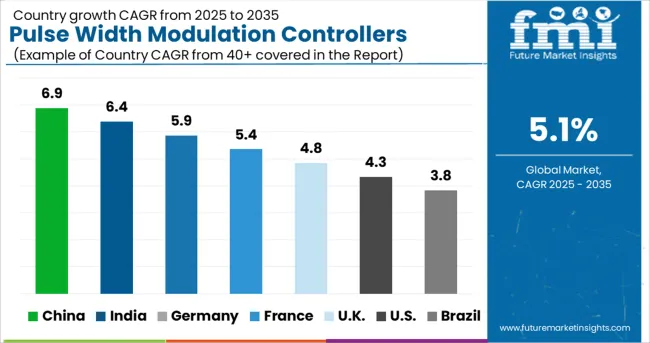
North America is the leading pulse width modulation controllers market share, with a share of 34.5% in 2022.

This is owing to the rapid development of the economy and advanced production technology. Moreover, the saturation of the analog devices market, as well as other smart devices in the market of this region, is expected to increase the demand for pulse width modulation controllers. The US is anticipated to surge the adoption of pulse width modulation controllers and witness substantial growth due to its flourishing solar energy industry as well.

Get the data you need at a Fraction of the cost

Personalize your report by choosing insights you need
and save 40%!

How is the Performance of the Asia-Pacific Pulse Width Modulation Controllers Market?

The Asia-Pacific is a rapidly growing pulse width modulation controller market with a revenue share of 35.8%.

China contributes to the majority of the revenue share, with the presence and expansion of commercial offices. Furthermore, the sales of pulse width modulation controllers in this region are expected to increase due to the rising electricity demand-supply gap in other developing economies. Moreover, the expansion of infrastructure and industrialization in the Asia Pacific countries is projected to remain the major driving factor for the pulse width modulation controller’s market growth.
What is the Growth Outlook for the Europe Pulse Width Modulation Controllers Market?

Europe contributes a revenue share of 23.9% and is also a positively growing pulse width modulation controllers market.

The advanced production technology and rapid development of analog devices in this region are expected to expand the global pulse width modulation controllers’ market size. Furthermore, the pulse width modulation controllers’ market share in Europe is likely to accelerate owing to the demand for clean electricity, as well as the increasing number of industrial-scale projects.

How is the Start-up Ecosystem in the Pulse Width Modulation Controllers Market?

Start-up companies are coming up with innovative strategies for PWM controllers for higher converter efficiency and lowering the design costs of these devices, which in turn - lowers the cost of purchasing PWM controllers and is anticipated to increase the sales of pulse width modulation controllers in the coming days.

New players in the pulse width modulation controllers’ market share cater to consumer demands and use research and development activities to improve market trends. They strive to expand production and create PWM controllers that support both isolated and non-isolated AC-DC and DC-DC switch mode power supplies based on the most popular topologies in both single-ended and double-ended configurations for mid to high-power SMPS.
What is the Competitive Landscape of the Pulse Width Modulation Controllers Market?

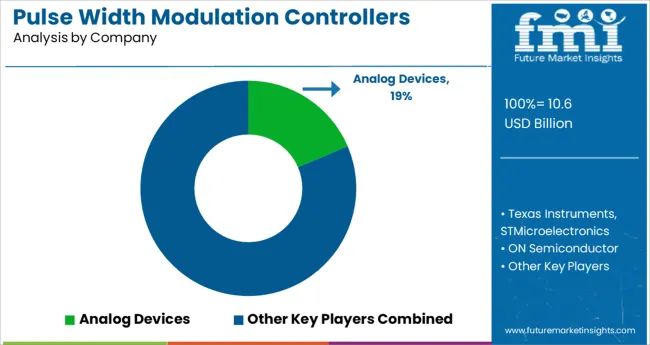
Some of the key participants of the pulse width modulation controllers market are Analog Devices (Linear Technology), Texas Instruments, STMicroelectronics, ON Semiconductor, Microchip Technology, Maxim Integrated, Infineon Technology, Vishay, Diodes Incorporated, Renesas Electronics, Semtech, Active-Semi, Schneider Electric, Sungrow, Wenzhou Xihe Electric Co. Ltd., Sunforge LLC, Luminous India, KATEK Memmingen GmbH, Victron Energy, Outback Power Inc., Xantrex Technologies, Gena Sun LLC, Studer Innotec, Steca Electronic GmbH, Simplex America Inc., Shenzhen Shuori New Energy Technology Co. Ltd., Phocas, Microtek, etc.

Curbing voltage fluctuations and still maintaining the encoding of a pulsing signal is an area in which key pulse width modulation controllers market players are investing when it comes to the adoption of pulse width modulation controllers.

Some of the recent developments in the pulse width modulation controllers market are:

  • In April 2021, Sungrow launched a new hybrid three-phase inverter and a high-voltage lithium iron phosphate battery energy storage system primarily for residential applications.
  • In June 2021, Sineng unveiled a new large-current inverter with a voltage rating of 1,500 V which is compatible with solar modules, to provide a rated power of 320 kW and a maximum power of 352 kW.
  • In June 2021, Growatt launched a 1,100 V string inverter solution consisting of 10 independent maximum power point tracking (MPPT) inputs, with MPPT voltage varying from 180-1,000 V.

Report Scope

Report Attribute Details
Growth Rate CAGR of 5.1% from 2022 to 2032
The base year for estimation 2021
Historical data 2016 to 2021
Forecast period 2022 to 2032
Quantitative units Revenue in US$ Million and CAGR from 2022 to 2032
Report Coverage Revenue forecast, volume forecast, company ranking, competitive landscape, growth factors, and trends, Pricing Analysis,
Segments Covered
  • Type
  • Application
  • Region
Regional scope North America; Western Europe, Eastern Europe, Middle East, Africa, ASEAN, South Asia, Rest of Asia, Australia, and New Zealand
Country scope United States of America; Canada; Mexico; Germany; United Kingdom; France; Italy; Spain; Russia; Belgium; Poland; Czech Republic; China; India; Japan; Australia; Brazil; Argentina; Colombia; Saudi Arabia; UAE; Iran; South Africa
Key companies profiled Analog Devices (Linear Technology), Texas Instruments, STMicroelectronics, ON Semiconductor, Microchip Technology, Maxim Integrated, Infineon Technology, Vishay, Diodes Incorporated, Renesas Electronics, Semtech, Active-Semi, Schneider Electric, Sungrow, Wenzhou Xihe Electric Co. Ltd., Sunforge LLC, Luminous India, KATEK Memmingen GmbH, Victron Energy, Outback Power Inc., Xantrex Technologies, Gena Sun LLC, Studer Innotec, Steca Electronic GmbH, Simplex America Inc., Shenzhen Shuori New Energy Technology Co. Ltd., Phocas, Microtek, etc.
Customization scope Free report customization (equivalent to up to 8 analysts' working days) with purchase. Addition or alteration to country, regional & segment scope.
Pricing and purchase options Avail customized purchase options to meet your exact research needs.

Key Segments Profiled in the Pulse Width Modulation Controllers Market Survey

By Type:

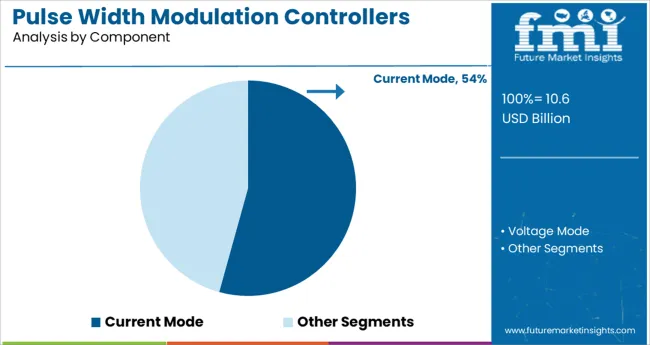
  • Current Mode
  • Voltage Mode

By Application:

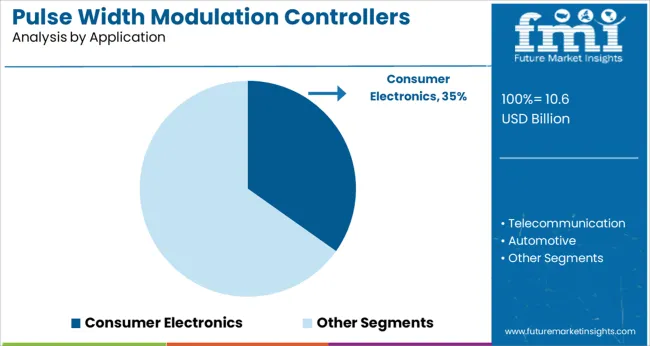
  • Consumer Electronics
  • Telecommunication
  • Automotive
  • Industrial

By Region:

  • North America
  • Latin America
  • Europe
  • Asia Pacific
  • Middle East and Africa

Frequently Asked Questions

What is the Growth Outlook for Pulse Width Modulation Controllers Market?

The PWM controllers market is likely to grow at 5.1% through 2032.

Which is the Best Region for the Pulse Width Modulation Controllers Market?

North America region contributes to more than 40% of the PWM controllers’ market.

What is the Current Size of the Pulse Width Modulation Controllers Market?

The PWM controllers market is currently valued at about US$ 9.1 Billion.

What is the Future Prediction for the Pulse Width Modulation Controllers Market?

The PWM controllers market is projected to reach US$ 15 Billion by 2032

Table of Content

1. Executive Summary | Pulse Width Modulation Controllers Market

    1.1. Global Market Outlook

    1.2. Demand-side Trends

    1.3. Supply-side Trends

    1.4. Technology Roadmap Analysis

    1.5. Analysis and Recommendations

2. Market Overview

    2.1. Market Coverage / Taxonomy

    2.2. Market Definition / Scope / Limitations

3. Market Background

    3.1. Market Dynamics

        3.1.1. Drivers

        3.1.2. Restraints

        3.1.3. Opportunity

        3.1.4. Trends

    3.2. Scenario Forecast

        3.2.1. Demand in Optimistic Scenario

        3.2.2. Demand in Likely Scenario

        3.2.3. Demand in Conservative Scenario

    3.3. Opportunity Map Analysis

    3.4. Investment Feasibility Matrix

    3.5. PESTLE and Porter’s Analysis

    3.6. Regulatory Landscape

        3.6.1. By Key Regions

        3.6.2. By Key Countries

    3.7. Regional Parent Market Outlook

4. Global Market Analysis 2017 to 2021 and Forecast, 2022 to 2032

    4.1. Historical Market Size Value (US$ Million) Analysis, 2017 to 2021

    4.2. Current and Future Market Size Value (US$ Million) Projections, 2022 to 2032

        4.2.1. Y-o-Y Growth Trend Analysis

        4.2.2. Absolute Opportunity Analysis

5. Global Market Analysis 2017 to 2021 and Forecast 2022 to 2032, By Component

    5.1. Introduction / Key Findings

    5.2. Historical Market Size Value (US$ Million) Analysis By Component, 2017 to 2021

    5.3. Current and Future Market Size Value (US$ Million) Analysis and Forecast By Component, 2022 to 2032

        5.3.1. Current Mode

        5.3.2. Voltage Mode

    5.4. Y-o-Y Growth Trend Analysis By Component, 2017 to 2021

    5.5. Absolute Opportunity Analysis By Component, 2022 to 2032

6. Global Market Analysis 2017 to 2021 and Forecast 2022 to 2032, By Application

    6.1. Introduction / Key Findings

    6.2. Historical Market Size Value (US$ Million) Analysis By Application, 2017 to 2021

    6.3. Current and Future Market Size Value (US$ Million) Analysis and Forecast By Application, 2022 to 2032

        6.3.1. Consumer Electronics

        6.3.2. Telecommunication

        6.3.3. Automotive

        6.3.4. Industrial

    6.4. Y-o-Y Growth Trend Analysis By Application, 2017 to 2021

    6.5. Absolute Opportunity Analysis By Application, 2022 to 2032

7. Global Market Analysis 2017 to 2021 and Forecast 2022 to 2032, By Region

    7.1. Introduction

    7.2. Historical Market Size Value (US$ Million) Analysis By Region, 2017 to 2021

    7.3. Current Market Size Value (US$ Million) Analysis and Forecast By Region, 2022 to 2032

        7.3.1. North America

        7.3.2. Latin America

        7.3.3. Europe

        7.3.4. Asia Pacific

        7.3.5. Middle East and Africa

    7.4. Market Attractiveness Analysis By Region

8. North America Market Analysis 2017 to 2021 and Forecast 2022 to 2032, By Country

    8.1. Historical Market Size Value (US$ Million) Trend Analysis By Market Taxonomy, 2017 to 2021

    8.2. Market Size Value (US$ Million) Forecast By Market Taxonomy, 2022 to 2032

        8.2.1. By Country

            8.2.1.1. United States of America

            8.2.1.2. Canada

        8.2.2. By Component

        8.2.3. By Application

    8.3. Market Attractiveness Analysis

        8.3.1. By Country

        8.3.2. By Component

        8.3.3. By Application

    8.4. Key Takeaways

9. Latin America Market Analysis 2017 to 2021 and Forecast 2022 to 2032, By Country

    9.1. Historical Market Size Value (US$ Million) Trend Analysis By Market Taxonomy, 2017 to 2021

    9.2. Market Size Value (US$ Million) Forecast By Market Taxonomy, 2022 to 2032

        9.2.1. By Country

            9.2.1.1. Brazil

            9.2.1.2. Mexico

            9.2.1.3. Rest of Latin America

        9.2.2. By Component

        9.2.3. By Application

    9.3. Market Attractiveness Analysis

        9.3.1. By Country

        9.3.2. By Component

        9.3.3. By Application

    9.4. Key Takeaways

10. Europe Market Analysis 2017 to 2021 and Forecast 2022 to 2032, By Country

    10.1. Historical Market Size Value (US$ Million) Trend Analysis By Market Taxonomy, 2017 to 2021

    10.2. Market Size Value (US$ Million) Forecast By Market Taxonomy, 2022 to 2032

        10.2.1. By Country

            10.2.1.1. Germany

            10.2.1.2. United Kingdom

            10.2.1.3. France

            10.2.1.4. Spain

            10.2.1.5. Italy

            10.2.1.6. Rest of Europe

        10.2.2. By Component

        10.2.3. By Application

    10.3. Market Attractiveness Analysis

        10.3.1. By Country

        10.3.2. By Component

        10.3.3. By Application

    10.4. Key Takeaways

11. Asia Pacific Market Analysis 2017 to 2021 and Forecast 2022 to 2032, By Country

    11.1. Historical Market Size Value (US$ Million) Trend Analysis By Market Taxonomy, 2017 to 2021

    11.2. Market Size Value (US$ Million) Forecast By Market Taxonomy, 2022 to 2032

        11.2.1. By Country

            11.2.1.1. China

            11.2.1.2. Japan

            11.2.1.3. South Korea

            11.2.1.4. India

            11.2.1.5. Malaysia

            11.2.1.6. Singapore

            11.2.1.7. Australia

            11.2.1.8. New Zealand

            11.2.1.9. Rest of Asia-Pacific (APAC)

        11.2.2. By Component

        11.2.3. By Application

    11.3. Market Attractiveness Analysis

        11.3.1. By Country

        11.3.2. By Component

        11.3.3. By Application

    11.4. Key Takeaways

12. Middle East and Africa Market Analysis 2017 to 2021 and Forecast 2022 to 2032, By Country

    12.1. Historical Market Size Value (US$ Million) Trend Analysis By Market Taxonomy, 2017 to 2021

    12.2. Market Size Value (US$ Million) Forecast By Market Taxonomy, 2022 to 2032

        12.2.1. By Country

            12.2.1.1. GCC Countries

            12.2.1.2. South Africa

            12.2.1.3. Israel

            12.2.1.4. Rest of Middle East and Africa

        12.2.2. By Component

        12.2.3. By Application

    12.3. Market Attractiveness Analysis

        12.3.1. By Country

        12.3.2. By Component

        12.3.3. By Application

    12.4. Key Takeaways

13. Key Countries Market Analysis

    13.1. United States of America

        13.1.1. Pricing Analysis

        13.1.2. Market Share Analysis, 2021

            13.1.2.1. By Component

            13.1.2.2. By Application

    13.2. Canada

        13.2.1. Pricing Analysis

        13.2.2. Market Share Analysis, 2021

            13.2.2.1. By Component

            13.2.2.2. By Application

    13.3. Brazil

        13.3.1. Pricing Analysis

        13.3.2. Market Share Analysis, 2021

            13.3.2.1. By Component

            13.3.2.2. By Application

    13.4. Mexico

        13.4.1. Pricing Analysis

        13.4.2. Market Share Analysis, 2021

            13.4.2.1. By Component

            13.4.2.2. By Application

    13.5. Germany

        13.5.1. Pricing Analysis

        13.5.2. Market Share Analysis, 2021

            13.5.2.1. By Component

            13.5.2.2. By Application

    13.6. United Kingdom

        13.6.1. Pricing Analysis

        13.6.2. Market Share Analysis, 2021

            13.6.2.1. By Component

            13.6.2.2. By Application

    13.7. France

        13.7.1. Pricing Analysis

        13.7.2. Market Share Analysis, 2021

            13.7.2.1. By Component

            13.7.2.2. By Application

    13.8. Spain

        13.8.1. Pricing Analysis

        13.8.2. Market Share Analysis, 2021

            13.8.2.1. By Component

            13.8.2.2. By Application

    13.9. Italy

        13.9.1. Pricing Analysis

        13.9.2. Market Share Analysis, 2021

            13.9.2.1. By Component

            13.9.2.2. By Application

    13.10. China

        13.10.1. Pricing Analysis

        13.10.2. Market Share Analysis, 2021

            13.10.2.1. By Component

            13.10.2.2. By Application

    13.11. Japan

        13.11.1. Pricing Analysis

        13.11.2. Market Share Analysis, 2021

            13.11.2.1. By Component

            13.11.2.2. By Application

    13.12. South Korea

        13.12.1. Pricing Analysis

        13.12.2. Market Share Analysis, 2021

            13.12.2.1. By Component

            13.12.2.2. By Application

    13.13. Malaysia

        13.13.1. Pricing Analysis

        13.13.2. Market Share Analysis, 2021

            13.13.2.1. By Component

            13.13.2.2. By Application

    13.14. Singapore

        13.14.1. Pricing Analysis

        13.14.2. Market Share Analysis, 2021

            13.14.2.1. By Component

            13.14.2.2. By Application

    13.15. Australia

        13.15.1. Pricing Analysis

        13.15.2. Market Share Analysis, 2021

            13.15.2.1. By Component

            13.15.2.2. By Application

    13.16. New Zealand

        13.16.1. Pricing Analysis

        13.16.2. Market Share Analysis, 2021

            13.16.2.1. By Component

            13.16.2.2. By Application

    13.17. GCC Countries

        13.17.1. Pricing Analysis

        13.17.2. Market Share Analysis, 2021

            13.17.2.1. By Component

            13.17.2.2. By Application

    13.18. South Africa

        13.18.1. Pricing Analysis

        13.18.2. Market Share Analysis, 2021

            13.18.2.1. By Component

            13.18.2.2. By Application

    13.19. Israel

        13.19.1. Pricing Analysis

        13.19.2. Market Share Analysis, 2021

            13.19.2.1. By Component

            13.19.2.2. By Application

14. Market Structure Analysis

    14.1. Competition Dashboard

    14.2. Competition Benchmarking

    14.3. Market Share Analysis of Top Players

        14.3.1. By Regional

        14.3.2. By Component

        14.3.3. By Application

15. Competition Analysis

    15.1. Competition Deep Dive

        15.1.1. Analog Devices

            15.1.1.1. Overview

            15.1.1.2. Product Portfolio

            15.1.1.3. Profitability by Market Segments

            15.1.1.4. Sales Footprint

            15.1.1.5. Strategy Overview

                15.1.1.5.1. Marketing Strategy

        15.1.2. Texas Instruments, STMicroelectronics

            15.1.2.1. Overview

            15.1.2.2. Product Portfolio

            15.1.2.3. Profitability by Market Segments

            15.1.2.4. Sales Footprint

            15.1.2.5. Strategy Overview

                15.1.2.5.1. Marketing Strategy

        15.1.3. ON Semiconductor

            15.1.3.1. Overview

            15.1.3.2. Product Portfolio

            15.1.3.3. Profitability by Market Segments

            15.1.3.4. Sales Footprint

            15.1.3.5. Strategy Overview

                15.1.3.5.1. Marketing Strategy

        15.1.4. Microchip Technology

            15.1.4.1. Overview

            15.1.4.2. Product Portfolio

            15.1.4.3. Profitability by Market Segments

            15.1.4.4. Sales Footprint

            15.1.4.5. Strategy Overview

                15.1.4.5.1. Marketing Strategy

        15.1.5. Maxim Integrated

            15.1.5.1. Overview

            15.1.5.2. Product Portfolio

            15.1.5.3. Profitability by Market Segments

            15.1.5.4. Sales Footprint

            15.1.5.5. Strategy Overview

                15.1.5.5.1. Marketing Strategy

        15.1.6. Infineon Technology

            15.1.6.1. Overview

            15.1.6.2. Product Portfolio

            15.1.6.3. Profitability by Market Segments

            15.1.6.4. Sales Footprint

            15.1.6.5. Strategy Overview

                15.1.6.5.1. Marketing Strategy

        15.1.7. Vishay

            15.1.7.1. Overview

            15.1.7.2. Product Portfolio

            15.1.7.3. Profitability by Market Segments

            15.1.7.4. Sales Footprint

            15.1.7.5. Strategy Overview

                15.1.7.5.1. Marketing Strategy

        15.1.8. Diodes Incorporated

            15.1.8.1. Overview

            15.1.8.2. Product Portfolio

            15.1.8.3. Profitability by Market Segments

            15.1.8.4. Sales Footprint

            15.1.8.5. Strategy Overview

                15.1.8.5.1. Marketing Strategy

        15.1.9. Renesas Electronics

            15.1.9.1. Overview

            15.1.9.2. Product Portfolio

            15.1.9.3. Profitability by Market Segments

            15.1.9.4. Sales Footprint

            15.1.9.5. Strategy Overview

                15.1.9.5.1. Marketing Strategy

        15.1.10. Semtech

            15.1.10.1. Overview

            15.1.10.2. Product Portfolio

            15.1.10.3. Profitability by Market Segments

            15.1.10.4. Sales Footprint

            15.1.10.5. Strategy Overview

                15.1.10.5.1. Marketing Strategy

        15.1.11. Active-Semi

            15.1.11.1. Overview

            15.1.11.2. Product Portfolio

            15.1.11.3. Profitability by Market Segments

            15.1.11.4. Sales Footprint

            15.1.11.5. Strategy Overview

                15.1.11.5.1. Marketing Strategy

16. Assumptions & Acronyms Used

17. Research Methodology

Don't pay for what you don't need

Customize your report by selecting specific countries or regions and save 30%!

List of Tables

Table 1: Global Market Value (US$ Million) Forecast by Region, 2017 to 2032

Table 2: Global Market Value (US$ Million) Forecast by Component, 2017 to 2032

Table 3: Global Market Value (US$ Million) Forecast by Application, 2017 to 2032

Table 4: North America Market Value (US$ Million) Forecast by Country, 2017 to 2032

Table 5: North America Market Value (US$ Million) Forecast by Component, 2017 to 2032

Table 6: North America Market Value (US$ Million) Forecast by Application, 2017 to 2032

Table 7: Latin America Market Value (US$ Million) Forecast by Country, 2017 to 2032

Table 8: Latin America Market Value (US$ Million) Forecast by Component, 2017 to 2032

Table 9: Latin America Market Value (US$ Million) Forecast by Application, 2017 to 2032

Table 10: Europe Market Value (US$ Million) Forecast by Country, 2017 to 2032

Table 11: Europe Market Value (US$ Million) Forecast by Component, 2017 to 2032

Table 12: Europe Market Value (US$ Million) Forecast by Application, 2017 to 2032

Table 13: Asia Pacific Market Value (US$ Million) Forecast by Country, 2017 to 2032

Table 14: Asia Pacific Market Value (US$ Million) Forecast by Component, 2017 to 2032

Table 15: Asia Pacific Market Value (US$ Million) Forecast by Application, 2017 to 2032

Table 16: Middle East and Africa Market Value (US$ Million) Forecast by Country, 2017 to 2032

Table 17: Middle East and Africa Market Value (US$ Million) Forecast by Component, 2017 to 2032

Table 18: Middle East and Africa Market Value (US$ Million) Forecast by Application, 2017 to 2032
Sudip Saha
Sudip Saha

Principal Consultant

Talk to Analyst

Find your sweet spots for generating winning opportunities in this market.

List of Charts

Figure 1: Global Market Value (US$ Million) by Component, 2022 to 2032

Figure 2: Global Market Value (US$ Million) by Application, 2022 to 2032

Figure 3: Global Market Value (US$ Million) by Region, 2022 to 2032

Figure 4: Global Market Value (US$ Million) Analysis by Region, 2017 to 2032

Figure 5: Global Market Value Share (%) and BPS Analysis by Region, 2022 to 2032

Figure 6: Global Market Y-o-Y Growth (%) Projections by Region, 2022 to 2032

Figure 7: Global Market Value (US$ Million) Analysis by Component, 2017 to 2032

Figure 8: Global Market Value Share (%) and BPS Analysis by Component, 2022 to 2032

Figure 9: Global Market Y-o-Y Growth (%) Projections by Component, 2022 to 2032

Figure 10: Global Market Value (US$ Million) Analysis by Application, 2017 to 2032

Figure 11: Global Market Value Share (%) and BPS Analysis by Application, 2022 to 2032

Figure 12: Global Market Y-o-Y Growth (%) Projections by Application, 2022 to 2032

Figure 13: Global Market Attractiveness by Component, 2022 to 2032

Figure 14: Global Market Attractiveness by Application, 2022 to 2032

Figure 15: Global Market Attractiveness by Region, 2022 to 2032

Figure 16: North America Market Value (US$ Million) by Component, 2022 to 2032

Figure 17: North America Market Value (US$ Million) by Application, 2022 to 2032

Figure 18: North America Market Value (US$ Million) by Country, 2022 to 2032

Figure 19: North America Market Value (US$ Million) Analysis by Country, 2017 to 2032

Figure 20: North America Market Value Share (%) and BPS Analysis by Country, 2022 to 2032

Figure 21: North America Market Y-o-Y Growth (%) Projections by Country, 2022 to 2032

Figure 22: North America Market Value (US$ Million) Analysis by Component, 2017 to 2032

Figure 23: North America Market Value Share (%) and BPS Analysis by Component, 2022 to 2032

Figure 24: North America Market Y-o-Y Growth (%) Projections by Component, 2022 to 2032

Figure 25: North America Market Value (US$ Million) Analysis by Application, 2017 to 2032

Figure 26: North America Market Value Share (%) and BPS Analysis by Application, 2022 to 2032

Figure 27: North America Market Y-o-Y Growth (%) Projections by Application, 2022 to 2032

Figure 28: North America Market Attractiveness by Component, 2022 to 2032

Figure 29: North America Market Attractiveness by Application, 2022 to 2032

Figure 30: North America Market Attractiveness by Country, 2022 to 2032

Figure 31: Latin America Market Value (US$ Million) by Component, 2022 to 2032

Figure 32: Latin America Market Value (US$ Million) by Application, 2022 to 2032

Figure 33: Latin America Market Value (US$ Million) by Country, 2022 to 2032

Figure 34: Latin America Market Value (US$ Million) Analysis by Country, 2017 to 2032

Figure 35: Latin America Market Value Share (%) and BPS Analysis by Country, 2022 to 2032

Figure 36: Latin America Market Y-o-Y Growth (%) Projections by Country, 2022 to 2032

Figure 37: Latin America Market Value (US$ Million) Analysis by Component, 2017 to 2032

Figure 38: Latin America Market Value Share (%) and BPS Analysis by Component, 2022 to 2032

Figure 39: Latin America Market Y-o-Y Growth (%) Projections by Component, 2022 to 2032

Figure 40: Latin America Market Value (US$ Million) Analysis by Application, 2017 to 2032

Figure 41: Latin America Market Value Share (%) and BPS Analysis by Application, 2022 to 2032

Figure 42: Latin America Market Y-o-Y Growth (%) Projections by Application, 2022 to 2032

Figure 43: Latin America Market Attractiveness by Component, 2022 to 2032

Figure 44: Latin America Market Attractiveness by Application, 2022 to 2032

Figure 45: Latin America Market Attractiveness by Country, 2022 to 2032

Figure 46: Europe Market Value (US$ Million) by Component, 2022 to 2032

Figure 47: Europe Market Value (US$ Million) by Application, 2022 to 2032

Figure 48: Europe Market Value (US$ Million) by Country, 2022 to 2032

Figure 49: Europe Market Value (US$ Million) Analysis by Country, 2017 to 2032

Figure 50: Europe Market Value Share (%) and BPS Analysis by Country, 2022 to 2032

Figure 51: Europe Market Y-o-Y Growth (%) Projections by Country, 2022 to 2032

Figure 52: Europe Market Value (US$ Million) Analysis by Component, 2017 to 2032

Figure 53: Europe Market Value Share (%) and BPS Analysis by Component, 2022 to 2032

Figure 54: Europe Market Y-o-Y Growth (%) Projections by Component, 2022 to 2032

Figure 55: Europe Market Value (US$ Million) Analysis by Application, 2017 to 2032

Figure 56: Europe Market Value Share (%) and BPS Analysis by Application, 2022 to 2032

Figure 57: Europe Market Y-o-Y Growth (%) Projections by Application, 2022 to 2032

Figure 58: Europe Market Attractiveness by Component, 2022 to 2032

Figure 59: Europe Market Attractiveness by Application, 2022 to 2032

Figure 60: Europe Market Attractiveness by Country, 2022 to 2032

Figure 61: Asia Pacific Market Value (US$ Million) by Component, 2022 to 2032

Figure 62: Asia Pacific Market Value (US$ Million) by Application, 2022 to 2032

Figure 63: Asia Pacific Market Value (US$ Million) by Country, 2022 to 2032

Figure 64: Asia Pacific Market Value (US$ Million) Analysis by Country, 2017 to 2032

Figure 65: Asia Pacific Market Value Share (%) and BPS Analysis by Country, 2022 to 2032

Figure 66: Asia Pacific Market Y-o-Y Growth (%) Projections by Country, 2022 to 2032

Figure 67: Asia Pacific Market Value (US$ Million) Analysis by Component, 2017 to 2032

Figure 68: Asia Pacific Market Value Share (%) and BPS Analysis by Component, 2022 to 2032

Figure 69: Asia Pacific Market Y-o-Y Growth (%) Projections by Component, 2022 to 2032

Figure 70: Asia Pacific Market Value (US$ Million) Analysis by Application, 2017 to 2032

Figure 71: Asia Pacific Market Value Share (%) and BPS Analysis by Application, 2022 to 2032

Figure 72: Asia Pacific Market Y-o-Y Growth (%) Projections by Application, 2022 to 2032

Figure 73: Asia Pacific Market Attractiveness by Component, 2022 to 2032

Figure 74: Asia Pacific Market Attractiveness by Application, 2022 to 2032

Figure 75: Asia Pacific Market Attractiveness by Country, 2022 to 2032

Figure 76: Middle East and Africa Market Value (US$ Million) by Component, 2022 to 2032

Figure 77: Middle East and Africa Market Value (US$ Million) by Application, 2022 to 2032

Figure 78: Middle East and Africa Market Value (US$ Million) by Country, 2022 to 2032

Figure 79: Middle East and Africa Market Value (US$ Million) Analysis by Country, 2017 to 2032

Figure 80: Middle East and Africa Market Value Share (%) and BPS Analysis by Country, 2022 to 2032

Figure 81: Middle East and Africa Market Y-o-Y Growth (%) Projections by Country, 2022 to 2032

Figure 82: Middle East and Africa Market Value (US$ Million) Analysis by Component, 2017 to 2032

Figure 83: Middle East and Africa Market Value Share (%) and BPS Analysis by Component, 2022 to 2032

Figure 84: Middle East and Africa Market Y-o-Y Growth (%) Projections by Component, 2022 to 2032

Figure 85: Middle East and Africa Market Value (US$ Million) Analysis by Application, 2017 to 2032

Figure 86: Middle East and Africa Market Value Share (%) and BPS Analysis by Application, 2022 to 2032

Figure 87: Middle East and Africa Market Y-o-Y Growth (%) Projections by Application, 2022 to 2032

Figure 88: Middle East and Africa Market Attractiveness by Component, 2022 to 2032

Figure 89: Middle East and Africa Market Attractiveness by Application, 2022 to 2032

Figure 90: Middle East and Africa Market Attractiveness by Country, 2022 to 2032

Recommendations

Technology

Application Delivery Controllers Market

Published : July 2023

Healthcare

Smart Pulse Oximeters Market

Published : December 2022

Healthcare

Non-invasive Pulse Wave Tonometer Market

Published : October 2022

Explore Technology Insights

View Reports

Pulse Width Modulation Controllers Market