Mouse Elevated Cross Maze Market Forecast and Outlook (2025-2035)

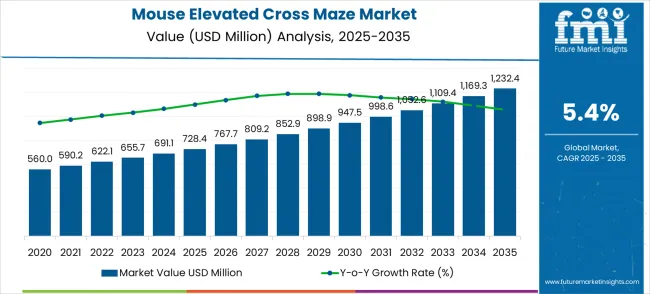
The mouse elevated cross maze market is expected to expand from USD 728.4 million in 2025 to USD 1,232.4 million by 2035, advancing at a CAGR of 5.4%. During this period, market share distribution is likely to shift due to technological innovations, regional adoption patterns, and the emergence of new competitors. Established players with advanced product portfolios, including automated tracking systems, high-precision sensors, and data integration software, are positioned to gain a larger share. Their focus on enhancing accuracy, reproducibility, and ease of use strengthens their position in preclinical research, neurobehavioral studies, and pharmaceutical testing.
Quick Stats for Mouse Elevated Cross Maze Market

  • Mouse Elevated Cross Maze Market Value (2025): USD 728.4 million
  • Mouse Elevated Cross Maze Market Forecast Value (2035): USD 1,232.4 million
  • Mouse Elevated Cross Maze Market Forecast CAGR: 5.4%
  • Leading Application in Mouse Elevated Cross Maze Market: Stress and Anxiety Model Construction (59% Share)
  • Key Growth Regions in Mouse Elevated Cross Maze Market: Asia Pacific, North America, and Europe
  • Key Players in Mouse Elevated Cross Maze Market: San Diego Instruments, Stoelting, Med Associates Inc., CleverSys, Med Associates

Mouse Elevated Cross Maze Market Market Value Analysis

Smaller manufacturers and generic product suppliers may experience relative share erosion as laboratories and research institutions increasingly prefer high-performance and fully integrated solutions. Additionally, regional dynamics contribute to shifts in market share. North America and Europe, which dominate the market due to strong research infrastructure, continue to maintain significant shares, while growth in Asia Pacific, Latin America, and the Middle East offers opportunities for new entrants and product differentiation. Strategic partnerships, product customization, and expansion into emerging regions help leading companies consolidate their market position.

Mouse Elevated Cross Maze Market Key Takeaways

Metric Value
Estimated Value in (2025E) USD 728.4 million
Forecast Value in (2035F) USD 1,232.4 million
Forecast CAGR (2025 to 2035) 5.4%

Emerging trends include automated tracking systems and video-based behavioral analysis for improved accuracy and reproducibility. Manufacturers are developing modular, adjustable, and easy-to-clean maze designs for versatile research applications. Adoption is rising in high-throughput screening and multi-parameter behavioral studies. AI-driven analytics and machine learning tools are enabling detection of subtle behavioral patterns. Partnerships between equipment suppliers, academic institutions, and biotech companies are fostering tailored solutions for specialized experiments. Increasing focus on precise behavioral quantification, efficient drug development, and adherence to animal welfare standards continues to shape global demand for Mouse Elevated Cross Maze systems.

The mouse elevated cross maze market is distributed across academic and behavioral neuroscience research at 42%, pharmaceutical drug discovery at 28%, preclinical toxicology testing at 15%, cognitive and anxiety studies at 10%, and specialty research at 5%. Academic laboratories lead adoption, using the maze to evaluate anxiety, spatial memory, and exploratory behavior in rodents. Pharmaceutical companies employ it for preclinical testing of anxiolytic, antidepressant, and cognitive-enhancing compounds. Preclinical toxicology studies use the maze to identify neurological or behavioral side effects. Specialty applications include sleep research, stress response experiments, and environmental enrichment studies. Market growth is driven by increasing investment in neuroscience, behavioral pharmacology, and rodent-based preclinical research.

Why is the Mouse Elevated Cross Maze Market Growing?

Market expansion is being supported by the increasing global demand for reliable behavioral assessment tools and the corresponding need for standardized anxiety testing equipment that can provide consistent and reproducible results across diverse research applications. Modern pharmaceutical companies and research institutions are increasingly focused on implementing behavioral testing solutions that can reduce study variability, enhance data quality, and provide validated anxiety assessment protocols for drug development programs. Mouse elevated cross mazes' proven ability to deliver standardized anxiety assessment, reproducible behavioral measurements, and versatile research applications make them essential equipment for contemporary neuroscience research and pharmaceutical development.

Research facilities' preference for equipment that combines measurement precision with operational reliability and standardization compliance is creating opportunities for innovative behavioral testing implementations. The rising influence of personalized medicine approaches and biomarker development is also contributing to increased adoption of mouse elevated cross mazes that can provide detailed behavioral analysis without compromising animal welfare standards.

Analyzing Mouse Elevated Cross Maze Market by Leading Segments

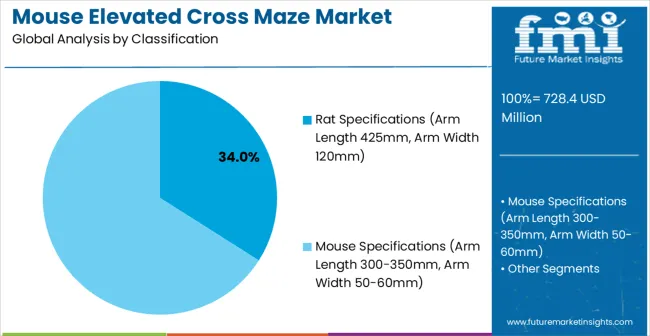
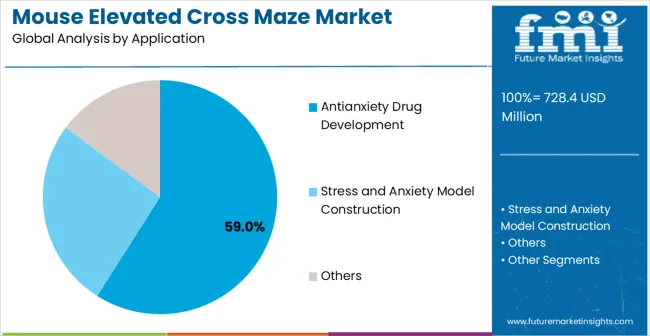
The mouse elevated cross maze market is growing as research in behavioral neuroscience and pharmacology expands. Rat specifications with arm length of 425 mm and arm width of 120 mm dominate the animal model segment with approximately 34% of the market share, reflecting their widespread use in preclinical testing for anxiety and exploratory behavior. In terms of application, antianxiety drug development leads with around 59% of the market, driven by increasing research and testing of anxiolytic compounds. Market growth is supported by rising investment in neuropharmacology, standardization of behavioral assays, and the need for reliable, reproducible models in preclinical research.
Rat Specifications Lead Demand for Mouse Elevated Cross Maze in 2025

Mouse Elevated Cross Maze Market Analysis By Classification

Rat models with arm length of 425 mm and arm width of 120 mm hold approximately 34% of the animal model segment, making them the preferred choice for preclinical behavioral studies. These models provide consistent locomotor activity and exploration patterns, allowing precise measurement of anxiety-related behaviors. Leading suppliers include Panlab, Harvard Apparatus, TSE Systems, and Ugo Basile. Rat models are preferred for their larger size compared to mice, enabling easier observation and data collection. They are compatible with automated tracking systems and video analysis software, which improves reproducibility and reduces observer bias in behavioral experiments.
  • Consistent locomotor and exploration patterns for precise behavioral measurement
  • Compatible with automated tracking and video analysis systems
  • Preferred due to larger size, enabling accurate observation and data collection

Antianxiety Drug Development Likely to Dominate Mouse Elevated Cross Maze Market in 2025

Mouse Elevated Cross Maze Market Analysis By Application

Antianxiety drug development accounts for approximately 59% of the application segment, making it the largest market for mouse elevated cross maze use. These mazes are extensively employed to assess anxiolytic effects of new compounds, measure open-arm time, and quantify exploratory behaviors in preclinical trials. Suppliers such as Panlab, Harvard Apparatus, TSE Systems, and Ugo Basile provide mazes optimized for durability, standardization, and reproducibility. Segment growth is driven by increasing demand for novel antianxiety therapeutics, regulatory requirements for preclinical behavioral evaluation, and the rising focus on neuropharmacology research. The maze remains a core tool for early-stage drug efficacy testing.

  • Used to assess anxiolytic effects and exploratory behavior in preclinical studies
  • Supports standardized and reproducible measurement of open-arm time
  • Growth fueled by rising neuropharmacology research and demand for novel anxiolytic drugs

What are the Drivers, Restraints, and Key Trends of the Mouse Elevated Cross Maze Market?

The mouse elevated cross-maze market is advancing rapidly due to increasing demand for standardized behavioral assessment tools and growing adoption of automated analysis systems that provide enhanced measurement precision and data reproducibility across diverse neuroscience research applications. The market faces challenges, including high equipment costs for advanced systems, the complexity of behavioral data interpretation, and the need for specialized training for optimal system utilization. Innovation in video tracking technologies and artificial intelligence-based analysis continues to influence product development and market expansion patterns.

Expansion of Automated Video Tracking Systems

The growing adoption of automated video tracking systems and computer-based behavioral analysis is enabling research facilities to achieve more efficient data collection with improved accuracy, reduced manual scoring time, and enhanced behavioral parameter measurement capabilities. Advanced tracking systems provide improved research productivity while allowing more comprehensive behavioral analysis and consistent data quality across various experimental conditions and research environments. Manufacturers are increasingly recognizing the competitive advantages of automation capabilities for research efficiency and data standardization requirements.

Integration of Artificial Intelligence and Machine Learning

Modern elevated cross maze producers are incorporating artificial intelligence algorithms and machine learning technologies to enhance behavioral pattern recognition, automate complex data analysis, and provide predictive behavioral modeling capabilities for research applications. These technologies improve research efficiency while enabling new applications, including real-time behavioral assessment and predictive anxiety modeling. Advanced AI integration also allows researchers to support sophisticated data analysis and research insights beyond traditional behavioral scoring methods.
Analysis of the Mouse Elevated Cross Maze Market by Key Countries

Mouse Elevated Cross Maze Market Cagr Analysis By Country

Country CAGR (2025-2035)
China 7.3%
India 6.8%
Germany 6.2%
Brazil 5.7%
USA 5.1%
UK 4.6%
Japan 4.1%

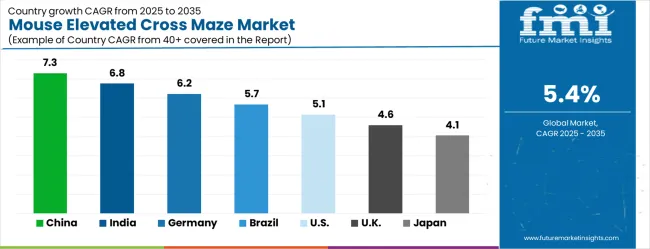
The mouse elevated cross maze market is experiencing strong growth globally, with China leading at a 7.3% CAGR through 2035, driven by the expanding neuroscience research sector, growing pharmaceutical industry, and significant investment in behavioral research infrastructure development. India follows at 6.8%, supported by the rapid expansion of research institutions, increasing biotechnology sector growth, and growing focus on preclinical research capabilities. Germany shows growth at 6.2%, priortizing technological innovation and advanced research equipment manufacturing. Brazil records 5.7%, focusing on academic research expansion and pharmaceutical sector development. The USA demonstrates 5.1% growth, driven by established neuroscience research infrastructure and pharmaceutical industry demand. The UK exhibits 4.6% growth, supported by academic research excellence and biotechnology sector expansion. Japan shows 4.1% growth, priortizing preision instrumentation and advanced research methodologies.

The report covers an in-depth analysis of 40+ countries, Top-performing countries are highlighted below.

Market Forecast for Mouse Elevated Cross Maze in China

China leads the market with a 7.3% CAGR, well above the global 5.4%. Adoption is concentrated in Shanghai, Beijing, and Jiangsu, where preclinical neuroscience research facilities are expanding. Manufacturers such as Panlab, TSE Systems, and Med Associates supply high-precision mazes with automated tracking and video analysis features. The growth is driven by increasing research in anxiety, memory, and behavioral neuroscience studies. Integration with software for data logging and analytics is common in 45% of laboratories. Animal welfare compliance and standardized protocols are increasingly implemented to improve reproducibility. Large-scale pharmaceutical and academic research institutes contribute to adoption, while portable and modular maze systems are gaining preference for flexible laboratory setups.

  • Shanghai, Beijing, Jiangsu account for 55% of installations.
  • Pharmaceutical and academic research represent 48% of demand.
  • Automated tracking and data logging systems applied in 45% of labs.

Mouse Elevated Cross Maze Market Expansion in India

India shows a CAGR of 6.8%, above the global 5.4%. Adoption is concentrated in Maharashtra, Karnataka, and Telangana, where neuroscience and pharmacological research is growing. Suppliers like TSE Systems, Med Associates, and Panlab provide mazes integrated with automated behavioral monitoring software. Preclinical studies in anxiety, neurodegenerative disorders, and cognition are primary applications. Portable and modular maze designs are increasingly preferred for research labs with limited space. Government-funded research programs and private pharmaceutical R&D centers account for 42% of installations. Adoption is further supported by collaborative projects between universities and biotech startups focusing on neuropharmacology.

  • Maharashtra, Karnataka, Telangana contribute 50% of installations.
  • Neuropharmacology and cognition studies drive 40% of demand.
  • Modular and portable mazes adopted in 35% of research labs.

Growth Analysis of Mouse Elevated Cross Maze in Germany

Germany records a CAGR of 6.2%, above the global 5.4%. Adoption is concentrated in Berlin, Munich, and Heidelberg, where pharmaceutical and neuroscience research institutes dominate. Suppliers such as Panlab, TSE Systems, and Med Associates offer mazes with automated video tracking, telemetry integration, and standardized protocols. The growth is driven by neurodegenerative disorder studies, anxiety models, and behavioral pharmacology research. Integration with laboratory information management systems (LIMS) improves data consistency and reproducibility. Animal welfare and ethical compliance are focused, supporting adoption in 38% of laboratories. Modular setups and software-assisted tracking are widely deployed for high-throughput studies.

  • Berlin, Munich, Heidelberg account for 52% of installations.
  • Neurodegenerative disorder and behavioral pharmacology studies drive 40% of demand.
  • LIMS integration applied in 38% of labs to enhance reproducibility.

Mouse Elevated Cross Maze Market in Brazil

Brazil grows at 5.7% CAGR, slightly above the global 5.4%. Adoption is concentrated in São Paulo, Rio de Janeiro, and Minas Gerais, driven by neuroscience and pharmacological research. Suppliers like TSE Systems, Panlab, and Med Associates provide mazes with automated scoring, video tracking, and anxiety-related behavioral protocols. Academic research centers and pharmaceutical companies contribute 45% of installations. Portable maze designs are favored for flexible lab use. Studies focusing on stress models, anxiety, and memory evaluation drive demand. Regional funding programs for neuropharmacology research enhance adoption, while software-assisted analysis is implemented in 30% of labs.

  • São Paulo, Rio de Janeiro, Minas Gerais represent 50% of installations.
  • Anxiety, stress, and memory research account for 40% of demand.
  • Software-assisted tracking adopted in 30% of laboratories.

Mouse Elevated Cross Maze Market Outlook in the United StateS

The USA grows at 5.1% CAGR, slightly below global 5.4%. Adoption is concentrated in Boston, California, and Maryland, where pharmaceutical R&D and academic neuroscience centers are active. Suppliers such as Med Associates, Panlab, and TSE Systems provide mazes with integrated video tracking, telemetry, and automated scoring. Preclinical studies in anxiety, depression, and cognition drive demand. Large-scale pharmaceutical companies account for 50% of installations, with modular and portable maze designs applied in 40% of labs. Integration with LIMS and advanced analytics is common in 35% of research projects. Regulatory compliance and animal welfare guidelines are key adoption factors.

  • Boston, California, Maryland account for 55% of installations.
  • Anxiety, depression, and cognition studies drive 48% of demand.
  • Modular maze designs adopted in 40% of labs.

Mouse Elevated Cross Maze Market Growth in the United Kingdom

The UK records 4.6% CAGR, below global 5.4%. Adoption is concentrated in London, Cambridge, and Edinburgh, where academic and pharmaceutical research dominates. Suppliers like TSE Systems, Panlab, and Med Associates provide mazes equipped with video tracking and automated scoring. Preclinical research in anxiety, stress, and memory evaluation represents 42% of demand. Modular maze setups are preferred in 35% of smaller labs to maximize flexibility. Regulatory compliance and adherence to animal welfare standards are critical for adoption. Government and private funding programs for neuroscience research support continued market activity.
  • London, Cambridge, Edinburgh account for 50% of installations.
  • Anxiety and stress research drive 42% of demand.
  • Modular maze systems used in 35% of labs for flexibility.

Mouse Elevated Cross Maze Market Adoption in Japan

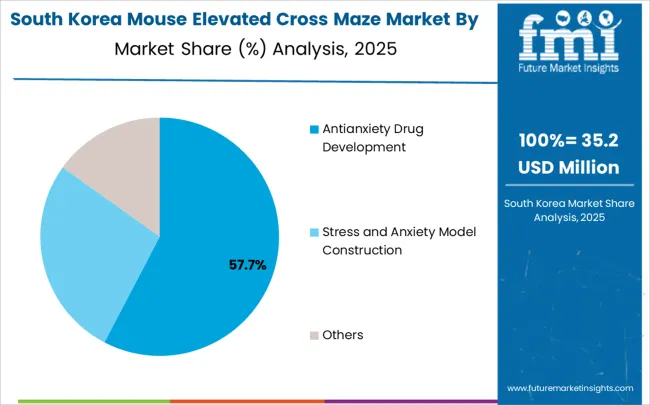
Mouse Elevated Cross Maze Market South Korea Market Share Analysis By Application

Japan exhibits 4.1% CAGR, below global 5.4%. Adoption is focused in Tokyo, Osaka, and Kyoto, where pharmaceutical and academic neuroscience research is concentrated. Suppliers including Panlab, TSE Systems, and Med Associates provide mazes with automated scoring, video tracking, and telemetry integration. Preclinical studies in cognition, anxiety, and neurodegenerative disorder research account for 40% of adoption. Portable and modular mazes are increasingly preferred in labs with space constraints. Advanced analytics and integration with laboratory management systems improve data reliability. Adoption is supported by government-funded neuroscience research and collaborations between universities and biotech companies.
  • Tokyo, Osaka, Kyoto represent 50% of installations.
  • Cognition and neurodegenerative disorder studies account for 40% of demand.
  • Portable maze systems used in 38% of space-constrained labs.

Europe Market Split by Countries

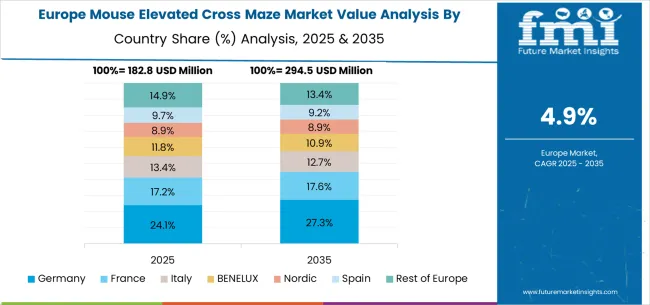
Mouse Elevated Cross Maze Market Europe Country Market Share Analysis, 2025 & 2035

The mouse elevated cross maze market in Europe is projected to grow from USD 169.3 million in 2025 to USD 286.6 million by 2035, registering a CAGR of 5.4% over the forecast period. Germany is expected to maintain its leadership position with a 30.2% market share in 2025, moderating slightly to 29.8% by 2035, supported by its strong research infrastructure, advanced neuroscience research capabilities, and comprehensive equipment manufacturing networks serving major European markets.

The United Kingdom follows with a 24.5% share in 2025, projected to reach 24.7% by 2035, driven by robust academic research excellence, an established biotechnology sector, and strong demand for precision research equipment across neuroscience and pharmaceutical research applications. France holds an 18.3% share in 2025, rising to 18.5% by 2035, supported by expanding neuroscience research programs and increasing adoption of automated behavioral analysis systems in academic institutions. Italy records 11.2% in 2025, inching to 11.3% by 2035, with growth underpinned by research infrastructure modernization and increasing pharmaceutical research activities. Spain contributes 8.1% in 2025, moving to 8.2% by 2035, supported by expanding academic research capabilities and biotechnology sector development. The Netherlands maintains a 3.4% share in 2025, growing to 3.5% by 2035. The rest of Europe region, including Nordic countries, Eastern Europe, Belgium, Switzerland, and Austria, is anticipated to gain momentum, expanding its collective share from 4.3% to 4.0% by 2035, attributed to increasing adoption of advanced research equipment in Nordic countries and growing neuroscience research activities across Eastern European markets, implementing research modernization programs.
Competitive Landscape of the Mouse Elevated Cross Maze Market

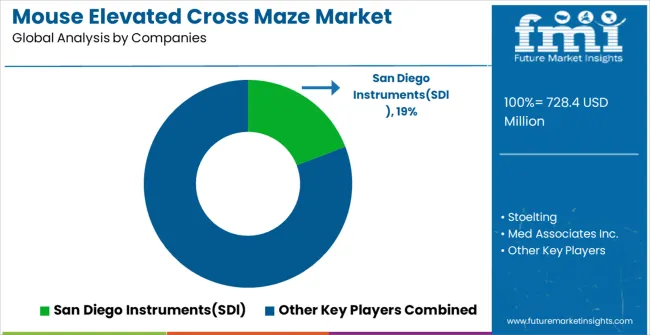
Mouse Elevated Cross Maze Market Analysis By Company

The mouse elevated cross-maze market is characterized by competition among established research equipment manufacturers, specialized behavioral testing system providers, and integrated neuroscience solution companies. Companies are investing in advanced tracking technology research, automated analysis system development, precision engineering improvements, and comprehensive software portfolios to deliver consistent, high-accuracy, and user-friendly behavioral assessment solutions. Innovation in video tracking systems, artificial intelligence integration, and standardized protocol development is central to strengthening market position and competitive advantage.

San Diego Instruments leads the market with a strong market share, offering comprehensive behavioral research equipment with a focus on precision measurement and automated analysis capabilities. Stoelting provides versatile behavioral testing solutions with an focus on research institution markets and educational applications. Med Associates Inc. delivers innovative neuroscience research equipment with a focus on standardized protocols and regulatory compliance. CleverSys specializes in automated behavioral analysis software and video tracking systems. Med Associates focuses on comprehensive research equipment platforms and integrated behavioral assessment solutions.

Mouse Elevated Cross Maze Market - Stakeholder Contribution Framework

Mouse elevated cross mazes represent a specialized behavioral testing equipment segment within neuroscience research and pharmaceutical development, projected to grow from USD 728.4 million in 2025 to USD 1,232.4 million by 2035 at a 5.4% CAGR. These standardized behavioral assessment apparatus-primarily rat specifications (arm length 425mm, arm width 120mm) for anxiety testing enable stress and anxiety model construction (USD 271.8 million in 2025) and anti-anxiety drug development in preclinical research applications. Market expansion is driven by increasing neuroscience research funding, growing pharmaceutical industry demand for standardized behavioral protocols, rising adoption of automated video tracking systems, and expanding global research infrastructure requiring validated anxiety assessment tools.

How Research Ethics and Animal Welfare Organizations Could Enhance Standards and Protocol Development?

  • Standardized Ethical Protocols: Develop comprehensive guidelines for elevated cross-maze testing that balance scientific rigor with animal welfare requirements, including standardized procedures for minimizing stress, optimizing testing duration, and ensuring humane experimental conditions across research institutions.
  • Refinement and Reduction Guidelines: Establish protocols that implement the 3Rs principle (replacement, reduction, refinement) in behavioral testing, promoting efficient study designs that minimize animal use while maintaining statistical power and scientific validity in anxiety research applications.
  • Training and Certification Programs: Create specialized training modules for researchers and technicians covering proper animal handling, behavioral testing procedures, stress recognition, and ethical considerations specific to elevated cross-maze applications in neuroscience research.
  • Quality Assurance Standards: Develop inspection and accreditation programs for research facilities using behavioral testing equipment, ensuring compliance with animal welfare regulations while maintaining research quality and reproducibility standards.
  • Alternative Method Development: Support research into computational models, in vitro alternatives, and advanced behavioral analysis technologies that can reduce reliance on animal testing while maintaining research validity and regulatory acceptance.

How Academic Research Institutions Could Advance Scientific Excellence and Innovation?

  • Standardized Research Protocols: Develop and validate comprehensive testing protocols for elevated cross-maze applications, including standardized environmental conditions, behavioral endpoints, and data analysis methods that ensure reproducible results across different laboratories and research groups.
  • Collaborative Research Networks: Establish multi-institutional research consortia sharing elevated cross-maze data, protocols, and best practices to accelerate scientific discovery while reducing redundant animal use and improving statistical power through data pooling.
  • Technology Integration Research: Conduct studies on advanced tracking systems, artificial intelligence applications, and automated analysis tools that enhance measurement precision, reduce human error, and provide more detailed behavioral analysis capabilities.
  • Graduate Training Programs: Implement comprehensive educational curricula covering behavioral neuroscience, anxiety research methodologies, statistical analysis, and ethical considerations that prepare the next generation of researchers for responsible and effective use of behavioral testing equipment.
  • Open Science Initiatives: Promote data sharing, protocol transparency, and reproducibility practices in behavioral research that accelerate scientific progress while maximizing the value derived from animal research investments.

How Equipment Manufacturers Could Drive Innovation and Research Support?

  • Advanced Automation Development: Invest in sophisticated video tracking systems, artificial intelligence-powered behavioral analysis, and automated data collection platforms that improve measurement accuracy, reduce researcher bias, and enhance the efficiency of behavioral testing protocols.
  • Standardization and Validation: Develop equipment specifications and performance standards that ensure consistency across different manufacturers, enable inter-laboratory comparisons, and support regulatory acceptance of behavioral testing data in drug development applications.
  • Modular System Design: Create flexible, upgradeable platforms that can accommodate different research requirements, animal models, and experimental protocols while maintaining standardized performance characteristics and data compatibility across different configurations.
  • Comprehensive User Support: Provide extensive training programs, technical support services, and research consultation that help institutions optimize their use of behavioral testing equipment while ensuring proper implementation of protocols and data analysis procedures.
  • Research Collaboration Programs: Establish partnerships with academic institutions and pharmaceutical companies to validate new technologies, develop improved protocols, and demonstrate the effectiveness of advanced behavioral testing systems in real research applications.

How Pharmaceutical Companies Could Optimize Drug Development and Regulatory Compliance?

  • Standardized Testing Protocols: Implement consistent behavioral testing procedures across preclinical development programs, including validated protocols for anxiety assessment, dose-response studies, and efficacy evaluation that support regulatory submissions and cross-study comparisons.
  • Regulatory Strategy Development: Establish comprehensive approaches for incorporating behavioral testing data into regulatory submissions, including proper documentation, statistical analysis, and interpretation of elevated cross-maze results in the context of drug development programs.
  • Technology Integration: Utilize advanced behavioral testing systems with automated analysis capabilities that provide objective, quantitative data supporting drug efficacy claims while reducing variability and improving the reliability of preclinical studies.
  • Cross-Functional Team Coordination: Develop integrated research teams combining neuroscientists, pharmacologists, statisticians, and regulatory experts to optimize the use of behavioral testing data throughout drug development and regulatory approval processes.
  • Biomarker Development: Leverage behavioral testing data in combination with molecular and physiological measurements to develop predictive biomarkers that improve drug candidate selection and increase the probability of clinical success.

How Regulatory Authorities Could Support Research Quality and Scientific Standards?

  • Guidance Document Development: Create comprehensive regulatory guidance for the use of behavioral testing data in drug development, including acceptable protocols, statistical analysis methods, and data interpretation standards that support regulatory decision-making.
  • International Harmonization: Coordinate with global regulatory agencies to develop unified standards for behavioral testing protocols, data requirements, and acceptance criteria that facilitate international drug development and reduce regulatory burden.
  • Scientific Advisory Support: Provide expert guidance on emerging behavioral testing technologies, novel applications, and regulatory considerations that help researchers and pharmaceutical companies navigate evolving scientific and regulatory landscapes.
  • Research Quality Standards: Establish requirements for study design, data integrity, and reporting standards in behavioral research that ensure regulatory submissions are based on high-quality, reproducible scientific data.
  • Innovation Pathway Programs: Develop expedited review processes and regulatory flexibility for drug development programs utilizing advanced behavioral testing technologies that demonstrate superior scientific rigor and regulatory compliance.

How Investors and Financial Enablers Could Support Market Development and Scientific Advancement?

  • Research Infrastructure Investment: Finance construction and modernization of behavioral research facilities, equipment acquisition, and technology upgrades that expand global capacity for high-quality neuroscience research and pharmaceutical development.
  • Technology Innovation Funding: Support development of next-generation behavioral testing systems, including advanced automation, artificial intelligence integration, and novel analysis capabilities that improve research efficiency and scientific outcomes.
  • Pharmaceutical Development Capital: Provide funding for drug development programs utilizing advanced behavioral testing methodologies, supporting companies that demonstrate superior preclinical research capabilities and regulatory compliance.
  • Academic Research Support: Fund basic research initiatives, collaborative networks, and training programs that advance the scientific understanding of behavioral testing methodologies while building research infrastructure and human capital.
  • Global Market Expansion: Support equipment manufacturers and research institutions in expanding into emerging markets, establishing international partnerships, and developing region-specific solutions that democratize access to advanced behavioral research capabilities worldwide.

Key Players in the Mouse Elevated Cross Maze Market

  • San Diego Instruments
  • Stoelting
  • Med Associates Inc.
  • CleverSys
  • Med Associates
  • Ugo Basile
  • Noldus Information Technology
  • MazeEngineers
  • VJ Instruments
  • Orchid Scientific

Scope of the Report

Items Values
Quantitative Units (2025) USD 728.4 million
Animal Model Rat Specifications (Arm Length 425mm, Arm Width 120mm), Mouse Specifications (Arm Length 300-350mm, Arm Width 50-60mm), Others
Application Antianxiety Drug Development, Stress and Anxiety Model Construction
Regions Covered North America, Europe, East Asia, South Asia & Pacific, Latin America, Middle East & Africa
Countries Covered United States, Canada, United Kingdom, Germany, France, China, Japan, South Korea, India, Brazil, Australia and 40+ countries
Key Companies Profiled San Diego Instruments, Stoelting, Med Associates Inc., CleverSys, Med Associates, and Ugo Basile
Additional Attributes Dollar sales by animal model and application category, regional demand trends, competitive landscape, technological advancements in tracking systems, automation innovation, AI integration development, and protocol standardization

Mouse Elevated Cross Maze Market by Segments

Animal Model

  • Rat Specifications (Arm Length 425mm, Arm Width 120mm)
  • Mouse Specifications (Arm Length 300-350mm, Arm Width 50-60mm)
  • Others

Application

  • Antianxiety Drug Development
  • Stress and Anxiety Model Construction

Region

  • North America
    • United States
    • Canada
    • Mexico
  • Europe
    • Germany
    • United Kingdom
    • France
    • Italy
    • Spain
    • Nordic
    • BENELUX
    • Rest of Europe
  • East Asia
    • China
    • Japan
    • South Korea
  • South Asia & Pacific
    • India
    • ASEAN
    • Australia & New Zealand
    • Rest of South Asia & Pacific
  • Latin America
    • Brazil
    • Chile
    • Rest of Latin America
  • Middle East & Africa
    • Kingdom of Saudi Arabia
    • Other GCC Countries
    • Turkiye
    • South Africa
    • Other African Union
    • Rest of Middle East & Africa

Table of Content

  1. Executive Summary
    • Global Market Outlook
    • Demand to side Trends
    • Supply to side Trends
    • Technology Roadmap Analysis
    • Analysis and Recommendations
  2. Market Overview
    • Market Coverage / Taxonomy
    • Market Definition / Scope / Limitations
  3. Market Background
    • Market Dynamics
      • Drivers
      • Restraints
      • Opportunity
      • Trends
    • Scenario Forecast
      • Demand in Optimistic Scenario
      • Demand in Likely Scenario
      • Demand in Conservative Scenario
    • Opportunity Map Analysis
    • Product Life Cycle Analysis
    • Supply Chain Analysis
    • Investment Feasibility Matrix
    • Value Chain Analysis
    • PESTLE and Porter’s Analysis
    • Regulatory Landscape
    • Regional Parent Market Outlook
    • Production and Consumption Statistics
    • Import and Export Statistics
  4. Global Market Analysis 2020 to 2024 and Forecast, 2025 to 2035
    • Historical Market Size Value (USD Million) Analysis, 2020 to 2024
    • Current and Future Market Size Value (USD Million) Projections, 2025 to 2035
      • Y to o to Y Growth Trend Analysis
      • Absolute $ Opportunity Analysis
  5. Global Market Pricing Analysis 2020 to 2024 and Forecast 2025 to 2035
  6. Global Market Analysis 2020 to 2024 and Forecast 2025 to 2035, By Classification
    • Introduction / Key Findings
    • Historical Market Size Value (USD Million) Analysis By Classification , 2020 to 2024
    • Current and Future Market Size Value (USD Million) Analysis and Forecast By Classification , 2025 to 2035
      • Rat Specifications (Arm Length 425mm, Arm Width 120mm)
      • Mouse Specifications (Arm Length 300-350mm, Arm Width 50-60mm)
    • Y to o to Y Growth Trend Analysis By Classification , 2020 to 2024
    • Absolute $ Opportunity Analysis By Classification , 2025 to 2035
  7. Global Market Analysis 2020 to 2024 and Forecast 2025 to 2035, By Application
    • Introduction / Key Findings
    • Historical Market Size Value (USD Million) Analysis By Application, 2020 to 2024
    • Current and Future Market Size Value (USD Million) Analysis and Forecast By Application, 2025 to 2035
      • Antianxiety Drug Development
      • Stress and Anxiety Model Construction
      • Others
    • Y to o to Y Growth Trend Analysis By Application, 2020 to 2024
    • Absolute $ Opportunity Analysis By Application, 2025 to 2035
  8. Global Market Analysis 2020 to 2024 and Forecast 2025 to 2035, By Region
    • Introduction
    • Historical Market Size Value (USD Million) Analysis By Region, 2020 to 2024
    • Current Market Size Value (USD Million) Analysis and Forecast By Region, 2025 to 2035
      • North America
      • Latin America
      • Western Europe
      • Eastern Europe
      • East Asia
      • South Asia and Pacific
      • Middle East & Africa
    • Market Attractiveness Analysis By Region
  9. North America Market Analysis 2020 to 2024 and Forecast 2025 to 2035, By Country
    • Historical Market Size Value (USD Million) Trend Analysis By Market Taxonomy, 2020 to 2024
    • Market Size Value (USD Million) Forecast By Market Taxonomy, 2025 to 2035
      • By Country
        • USA
        • Canada
        • Mexico
      • By Classification
      • By Application
    • Market Attractiveness Analysis
      • By Country
      • By Classification
      • By Application
    • Key Takeaways
  10. Latin America Market Analysis 2020 to 2024 and Forecast 2025 to 2035, By Country
    • Historical Market Size Value (USD Million) Trend Analysis By Market Taxonomy, 2020 to 2024
    • Market Size Value (USD Million) Forecast By Market Taxonomy, 2025 to 2035
      • By Country
        • Brazil
        • Chile
        • Rest of Latin America
      • By Classification
      • By Application
    • Market Attractiveness Analysis
      • By Country
      • By Classification
      • By Application
    • Key Takeaways
  11. Western Europe Market Analysis 2020 to 2024 and Forecast 2025 to 2035, By Country
    • Historical Market Size Value (USD Million) Trend Analysis By Market Taxonomy, 2020 to 2024
    • Market Size Value (USD Million) Forecast By Market Taxonomy, 2025 to 2035
      • By Country
        • Germany
        • UK
        • Italy
        • Spain
        • France
        • Nordic
        • BENELUX
        • Rest of Western Europe
      • By Classification
      • By Application
    • Market Attractiveness Analysis
      • By Country
      • By Classification
      • By Application
    • Key Takeaways
  12. Eastern Europe Market Analysis 2020 to 2024 and Forecast 2025 to 2035, By Country
    • Historical Market Size Value (USD Million) Trend Analysis By Market Taxonomy, 2020 to 2024
    • Market Size Value (USD Million) Forecast By Market Taxonomy, 2025 to 2035
      • By Country
        • Russia
        • Poland
        • Hungary
        • Balkan & Baltic
        • Rest of Eastern Europe
      • By Classification
      • By Application
    • Market Attractiveness Analysis
      • By Country
      • By Classification
      • By Application
    • Key Takeaways
  13. East Asia Market Analysis 2020 to 2024 and Forecast 2025 to 2035, By Country
    • Historical Market Size Value (USD Million) Trend Analysis By Market Taxonomy, 2020 to 2024
    • Market Size Value (USD Million) Forecast By Market Taxonomy, 2025 to 2035
      • By Country
        • China
        • Japan
        • South Korea
      • By Classification
      • By Application
    • Market Attractiveness Analysis
      • By Country
      • By Classification
      • By Application
    • Key Takeaways
  14. South Asia and Pacific Market Analysis 2020 to 2024 and Forecast 2025 to 2035, By Country
    • Historical Market Size Value (USD Million) Trend Analysis By Market Taxonomy, 2020 to 2024
    • Market Size Value (USD Million) Forecast By Market Taxonomy, 2025 to 2035
      • By Country
        • India
        • ASEAN
        • Australia & New Zealand
        • Rest of South Asia and Pacific
      • By Classification
      • By Application
    • Market Attractiveness Analysis
      • By Country
      • By Classification
      • By Application
    • Key Takeaways
  15. Middle East & Africa Market Analysis 2020 to 2024 and Forecast 2025 to 2035, By Country
    • Historical Market Size Value (USD Million) Trend Analysis By Market Taxonomy, 2020 to 2024
    • Market Size Value (USD Million) Forecast By Market Taxonomy, 2025 to 2035
      • By Country
        • Kingdom of Saudi Arabia
        • Other GCC Countries
        • Turkiye
        • South Africa
        • Other African Union
        • Rest of Middle East & Africa
      • By Classification
      • By Application
    • Market Attractiveness Analysis
      • By Country
      • By Classification
      • By Application
    • Key Takeaways
  16. Key Countries Market Analysis
    • USA
      • Pricing Analysis
      • Market Share Analysis, 2024
        • By Classification
        • By Application
    • Canada
      • Pricing Analysis
      • Market Share Analysis, 2024
        • By Classification
        • By Application
    • Mexico
      • Pricing Analysis
      • Market Share Analysis, 2024
        • By Classification
        • By Application
    • Brazil
      • Pricing Analysis
      • Market Share Analysis, 2024
        • By Classification
        • By Application
    • Chile
      • Pricing Analysis
      • Market Share Analysis, 2024
        • By Classification
        • By Application
    • Germany
      • Pricing Analysis
      • Market Share Analysis, 2024
        • By Classification
        • By Application
    • UK
      • Pricing Analysis
      • Market Share Analysis, 2024
        • By Classification
        • By Application
    • Italy
      • Pricing Analysis
      • Market Share Analysis, 2024
        • By Classification
        • By Application
    • Spain
      • Pricing Analysis
      • Market Share Analysis, 2024
        • By Classification
        • By Application
    • France
      • Pricing Analysis
      • Market Share Analysis, 2024
        • By Classification
        • By Application
    • India
      • Pricing Analysis
      • Market Share Analysis, 2024
        • By Classification
        • By Application
    • ASEAN
      • Pricing Analysis
      • Market Share Analysis, 2024
        • By Classification
        • By Application
    • Australia & New Zealand
      • Pricing Analysis
      • Market Share Analysis, 2024
        • By Classification
        • By Application
    • China
      • Pricing Analysis
      • Market Share Analysis, 2024
        • By Classification
        • By Application
    • Japan
      • Pricing Analysis
      • Market Share Analysis, 2024
        • By Classification
        • By Application
    • South Korea
      • Pricing Analysis
      • Market Share Analysis, 2024
        • By Classification
        • By Application
    • Russia
      • Pricing Analysis
      • Market Share Analysis, 2024
        • By Classification
        • By Application
    • Poland
      • Pricing Analysis
      • Market Share Analysis, 2024
        • By Classification
        • By Application
    • Hungary
      • Pricing Analysis
      • Market Share Analysis, 2024
        • By Classification
        • By Application
    • Kingdom of Saudi Arabia
      • Pricing Analysis
      • Market Share Analysis, 2024
        • By Classification
        • By Application
    • Turkiye
      • Pricing Analysis
      • Market Share Analysis, 2024
        • By Classification
        • By Application
    • South Africa
      • Pricing Analysis
      • Market Share Analysis, 2024
        • By Classification
        • By Application
  17. Market Structure Analysis
    • Competition Dashboard
    • Competition Benchmarking
    • Market Share Analysis of Top Players
      • By Regional
      • By Classification
      • By Application
  18. Competition Analysis
    • Competition Deep Dive
      • San Diego Instruments(SDl)
        • Overview
        • Product Portfolio
        • Profitability by Market Segments (Product/Age /Sales Channel/Region)
        • Sales Footprint
        • Strategy Overview
          • Marketing Strategy
          • Product Strategy
          • Channel Strategy
      • Stoelting
      • Med Associates Inc.
      • CleverSys
      • Med Associates
      • Ugo Basile
      • Noldus Information Technology
      • MazeEngineers
      • VJ Instruments
      • Orchid Scientific
      • BioMed
      • Anhui Zhenghua Biological Instruments and Equipment
      • Shanghai Yuyan Scientific Instruments
      • RWD Life Science
  19. Assumptions & Acronyms Used
  20. Research Methodology

List of Tables

  • Table 1: Global Market Value (USD Million) Forecast by Region, 2020 to 2035
  • Table 2: Global Market Value (USD Million) Forecast by Classification , 2020 to 2035
  • Table 3: Global Market Value (USD Million) Forecast by Application, 2020 to 2035
  • Table 4: North America Market Value (USD Million) Forecast by Country, 2020 to 2035
  • Table 5: North America Market Value (USD Million) Forecast by Classification , 2020 to 2035
  • Table 6: North America Market Value (USD Million) Forecast by Application, 2020 to 2035
  • Table 7: Latin America Market Value (USD Million) Forecast by Country, 2020 to 2035
  • Table 8: Latin America Market Value (USD Million) Forecast by Classification , 2020 to 2035
  • Table 9: Latin America Market Value (USD Million) Forecast by Application, 2020 to 2035
  • Table 10: Western Europe Market Value (USD Million) Forecast by Country, 2020 to 2035
  • Table 11: Western Europe Market Value (USD Million) Forecast by Classification , 2020 to 2035
  • Table 12: Western Europe Market Value (USD Million) Forecast by Application, 2020 to 2035
  • Table 13: Eastern Europe Market Value (USD Million) Forecast by Country, 2020 to 2035
  • Table 14: Eastern Europe Market Value (USD Million) Forecast by Classification , 2020 to 2035
  • Table 15: Eastern Europe Market Value (USD Million) Forecast by Application, 2020 to 2035
  • Table 16: East Asia Market Value (USD Million) Forecast by Country, 2020 to 2035
  • Table 17: East Asia Market Value (USD Million) Forecast by Classification , 2020 to 2035
  • Table 18: East Asia Market Value (USD Million) Forecast by Application, 2020 to 2035
  • Table 19: South Asia and Pacific Market Value (USD Million) Forecast by Country, 2020 to 2035
  • Table 20: South Asia and Pacific Market Value (USD Million) Forecast by Classification , 2020 to 2035
  • Table 21: South Asia and Pacific Market Value (USD Million) Forecast by Application, 2020 to 2035
  • Table 22: Middle East & Africa Market Value (USD Million) Forecast by Country, 2020 to 2035
  • Table 23: Middle East & Africa Market Value (USD Million) Forecast by Classification , 2020 to 2035
  • Table 24: Middle East & Africa Market Value (USD Million) Forecast by Application, 2020 to 2035

List of Figures

  • Figure 1: Global Market Pricing Analysis
  • Figure 2: Global Market Value (USD Million) Forecast 2020-2035
  • Figure 3: Global Market Value Share and BPS Analysis by Classification , 2025 and 2035
  • Figure 4: Global Market Y to o to Y Growth Comparison by Classification , 2025-2035
  • Figure 5: Global Market Attractiveness Analysis by Classification
  • Figure 6: Global Market Value Share and BPS Analysis by Application, 2025 and 2035
  • Figure 7: Global Market Y to o to Y Growth Comparison by Application, 2025-2035
  • Figure 8: Global Market Attractiveness Analysis by Application
  • Figure 9: Global Market Value (USD Million) Share and BPS Analysis by Region, 2025 and 2035
  • Figure 10: Global Market Y to o to Y Growth Comparison by Region, 2025-2035
  • Figure 11: Global Market Attractiveness Analysis by Region
  • Figure 12: North America Market Incremental Dollar Opportunity, 2025-2035
  • Figure 13: Latin America Market Incremental Dollar Opportunity, 2025-2035
  • Figure 14: Western Europe Market Incremental Dollar Opportunity, 2025-2035
  • Figure 15: Eastern Europe Market Incremental Dollar Opportunity, 2025-2035
  • Figure 16: East Asia Market Incremental Dollar Opportunity, 2025-2035
  • Figure 17: South Asia and Pacific Market Incremental Dollar Opportunity, 2025-2035
  • Figure 18: Middle East & Africa Market Incremental Dollar Opportunity, 2025-2035
  • Figure 19: North America Market Value Share and BPS Analysis by Country, 2025 and 2035
  • Figure 20: North America Market Value Share and BPS Analysis by Classification , 2025 and 2035
  • Figure 21: North America Market Y to o to Y Growth Comparison by Classification , 2025-2035
  • Figure 22: North America Market Attractiveness Analysis by Classification
  • Figure 23: North America Market Value Share and BPS Analysis by Application, 2025 and 2035
  • Figure 24: North America Market Y to o to Y Growth Comparison by Application, 2025-2035
  • Figure 25: North America Market Attractiveness Analysis by Application
  • Figure 26: Latin America Market Value Share and BPS Analysis by Country, 2025 and 2035
  • Figure 27: Latin America Market Value Share and BPS Analysis by Classification , 2025 and 2035
  • Figure 28: Latin America Market Y to o to Y Growth Comparison by Classification , 2025-2035
  • Figure 29: Latin America Market Attractiveness Analysis by Classification
  • Figure 30: Latin America Market Value Share and BPS Analysis by Application, 2025 and 2035
  • Figure 31: Latin America Market Y to o to Y Growth Comparison by Application, 2025-2035
  • Figure 32: Latin America Market Attractiveness Analysis by Application
  • Figure 33: Western Europe Market Value Share and BPS Analysis by Country, 2025 and 2035
  • Figure 34: Western Europe Market Value Share and BPS Analysis by Classification , 2025 and 2035
  • Figure 35: Western Europe Market Y to o to Y Growth Comparison by Classification , 2025-2035
  • Figure 36: Western Europe Market Attractiveness Analysis by Classification
  • Figure 37: Western Europe Market Value Share and BPS Analysis by Application, 2025 and 2035
  • Figure 38: Western Europe Market Y to o to Y Growth Comparison by Application, 2025-2035
  • Figure 39: Western Europe Market Attractiveness Analysis by Application
  • Figure 40: Eastern Europe Market Value Share and BPS Analysis by Country, 2025 and 2035
  • Figure 41: Eastern Europe Market Value Share and BPS Analysis by Classification , 2025 and 2035
  • Figure 42: Eastern Europe Market Y to o to Y Growth Comparison by Classification , 2025-2035
  • Figure 43: Eastern Europe Market Attractiveness Analysis by Classification
  • Figure 44: Eastern Europe Market Value Share and BPS Analysis by Application, 2025 and 2035
  • Figure 45: Eastern Europe Market Y to o to Y Growth Comparison by Application, 2025-2035
  • Figure 46: Eastern Europe Market Attractiveness Analysis by Application
  • Figure 47: East Asia Market Value Share and BPS Analysis by Country, 2025 and 2035
  • Figure 48: East Asia Market Value Share and BPS Analysis by Classification , 2025 and 2035
  • Figure 49: East Asia Market Y to o to Y Growth Comparison by Classification , 2025-2035
  • Figure 50: East Asia Market Attractiveness Analysis by Classification
  • Figure 51: East Asia Market Value Share and BPS Analysis by Application, 2025 and 2035
  • Figure 52: East Asia Market Y to o to Y Growth Comparison by Application, 2025-2035
  • Figure 53: East Asia Market Attractiveness Analysis by Application
  • Figure 54: South Asia and Pacific Market Value Share and BPS Analysis by Country, 2025 and 2035
  • Figure 55: South Asia and Pacific Market Value Share and BPS Analysis by Classification , 2025 and 2035
  • Figure 56: South Asia and Pacific Market Y to o to Y Growth Comparison by Classification , 2025-2035
  • Figure 57: South Asia and Pacific Market Attractiveness Analysis by Classification
  • Figure 58: South Asia and Pacific Market Value Share and BPS Analysis by Application, 2025 and 2035
  • Figure 59: South Asia and Pacific Market Y to o to Y Growth Comparison by Application, 2025-2035
  • Figure 60: South Asia and Pacific Market Attractiveness Analysis by Application
  • Figure 61: Middle East & Africa Market Value Share and BPS Analysis by Country, 2025 and 2035
  • Figure 62: Middle East & Africa Market Value Share and BPS Analysis by Classification , 2025 and 2035
  • Figure 63: Middle East & Africa Market Y to o to Y Growth Comparison by Classification , 2025-2035
  • Figure 64: Middle East & Africa Market Attractiveness Analysis by Classification
  • Figure 65: Middle East & Africa Market Value Share and BPS Analysis by Application, 2025 and 2035
  • Figure 66: Middle East & Africa Market Y to o to Y Growth Comparison by Application, 2025-2035
  • Figure 67: Middle East & Africa Market Attractiveness Analysis by Application
  • Figure 68: Global Market - Tier Structure Analysis
  • Figure 69: Global Market - Company Share Analysis

Frequently Asked Questions

How big is the mouse elevated cross maze market in 2025?

The global mouse elevated cross maze market is estimated to be valued at USD 728.4 million in 2025.

What will be the size of mouse elevated cross maze market in 2035?

The market size for the mouse elevated cross maze market is projected to reach USD 1,232.4 million by 2035.

How much will be the mouse elevated cross maze market growth between 2025 and 2035?

The mouse elevated cross maze market is expected to grow at a 5.4% CAGR between 2025 and 2035.

What are the key product types in the mouse elevated cross maze market?

The key product types in mouse elevated cross maze market are rat specifications (arm length 425mm, arm width 120mm) and mouse specifications (arm length 300-350mm, arm width 50-60mm).

Which application segment to contribute significant share in the mouse elevated cross maze market in 2025?

In terms of application, antianxiety drug development segment to command 59.0% share in the mouse elevated cross maze market in 2025.

Explore Similar Insights

Future Market Insights

Mouse Elevated Cross Maze Market

Chat With

MaRIA

Hi There, I am MaRIA, Your Market Research Intelligence Assistant. How may I help you?