Humanized Mouse Model Market Size and Share Forecast Outlook 2025 to 2035

The Humanized Mouse Model Market is anticipated to be valued at USD 113.6 million in 2025 and is expected to reach USD 119.6 million by 2035, registering a CAGR of 5.8%.

‍Quick Stats for Humanized Mouse Model Market

  • Industry Value (2025): USD 113.6 million
  • Forecast Value (2035): USD 119.6 million
  • Forecast CAGR: 5.8%
  • Leading Segment in 2025: Genetic Models
  • Key Growth Region: North America and Europe
  • Top Key Players: Ingenious Targeting Laboratory, Axenis S.A.S, Trans Genic Inc., Horizon Discovery Group PLC, HuMurine Technologies, The Jackson Laboratory, Taconic Biosciences Inc., Crown Bioscience Inc.
Metric Value
Industry Size (2025E) USD 113.6 Million
Industry Value (2035F) USD 119.6 million
CAGR (2025 to 2035) 5.8%

The Humanized Mouse Model Market is experiencing significant growth, driven by the increasing demand for preclinical drug development and research in oncology, immunology, and infectious diseases. These models offer a more accurate representation of human physiology and disease compared to traditional animal models, leading to improved efficacy and safety assessments of new therapeutics. Technological advancements, such as CRISPR and other gene-editing tools, have enhanced the development of sophisticated humanized mouse models, further boosting market expansion.

The rising prevalence of chronic diseases and the growing emphasis on personalized medicine are also contributing to the market's growth. Pharmaceutical and biotechnology companies are investing heavily in these models to accelerate drug discovery processes and reduce the failure rates of clinical trials. The market is poised for continued expansion as the need for reliable and translational preclinical models becomes increasingly critical in the development of innovative therapies.

Prominent players in the Humanized Mouse Model Market include The Jackson Laboratory, Charles River Laboratories, Inotiv Inc., and genOway. These companies are at the forefront of developing advanced humanized mouse models that cater to the evolving needs of biomedical research. In July 2024, Scientists at The University of Texas Health Science Center at San Antonio announced the creation of world’s first mouse model equipped with a fully functional human immune system.

Named TruHuX (for truly human, or THX), these humanized mice represent a significant advancement in immunological and microbiological research. Paolo Casali, MD, the University of Texas Ashbel Smith Professor and Distinguished Research Professor, explained that “THX mice utilize estrogen activity to bolster human stem cell and immune cell development, enhancing antibody responses.”
Analyzing Humanized Mouse Model Market by Top Investment Segments

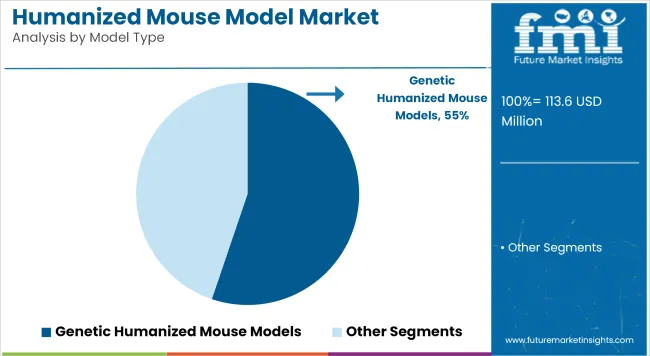
Genetic Humanized Mouse Models Lead the Market Due to High Adoption in Advanced Immunological and Oncology Research

Humanized Mouse Model Market Analysis By Model Type

The dominance of genetic humanized mouse models, accounting for 55.20% of the market in 2025, can be attributed to their engineered ability to replicate human gene functions and immunological pathways. Their utilization has been prioritized in studies requiring accurate in vivo models for human immune responses, particularly in oncology and autoimmune disease research.

These models are often developed using CRISPR and other gene-editing technologies, allowing for precise human gene knock-in, which improves translational outcomes in preclinical trials. Their growth has been further supported by increased industry and academic focus on gene-based therapies and personalized medicine. Additionally, regulatory bodies have increasingly recognized the value of such models in replacing or supplementing traditional animal testing, thus strengthening their adoption.

Collaborative initiatives between CROs, biopharma companies, and academic centers have also accelerated model development and availability. As a result, genetic models have been positioned as a cornerstone in preclinical research for next-generation biologics and immunotherapies.
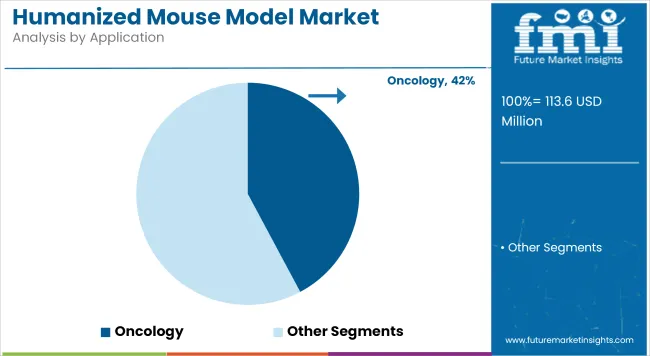
Oncology Segment Leads Due to Surge in Immunotherapy and Targeted Cancer Drug Development

Humanized Mouse Model Market Analysis By Application

With a 42.2% market share in 2025, oncology remains the dominant application segment within the Humanized Mouse Model Market. This leadership has been driven by the urgent need for predictive and reproducible preclinical models capable of mimicking human tumor microenvironments.

Humanized mouse models have been widely employed in immuno-oncology, especially in assessing checkpoint inhibitors, CAR-T therapies, and bispecific antibodies. A substantial shift toward personalized cancer treatment has created demand for highly human-relevant models.

Furthermore, pharmaceutical companies have increasingly relied on these models to evaluate tumor-immune interactions and drug toxicity profiles with greater translational accuracy. The ongoing rise in cancer prevalence worldwide, coupled with a robust pipeline of targeted therapies in development, has necessitated advanced testing platforms thereby accelerating adoption. As these models continue to validate their clinical predictability, their utility in oncology research is expected to further expand, supporting regulatory approval and commercial success of novel therapies.

Pharmaceutical & Biotechnology Companies Dominate Due to Strategic Focus on Preclinical Validation and Biologics Development

The pharmaceutical and biotechnology companies segment, holding a 60.21% market share in 2025, has been propelled by the increasing requirement for reliable in vivo validation platforms. Humanized mouse models have been integrated into drug discovery pipelines to support the development of monoclonal antibodies, gene therapies, and immunotherapies.

Their application has enabled better assessment of pharmacokinetics, safety, and efficacy prior to human trials. This growth has been reinforced by companies prioritizing pipeline acceleration, risk reduction, and personalized therapy development. Significant R&D investment, paired with strategic alliances with CROs and academic institutions, has expanded access to sophisticated model libraries.

Moreover, with biologics becoming a dominant therapeutic class, especially in oncology and autoimmune disorders, demand for human-relevant preclinical models has surged. Regulatory pressure to adopt more predictive and ethical testing models has also influenced industry adoption positively. Consequently, pharmaceutical and biotech firms have emerged as the primary users of humanized models to de-risk innovation and improve clinical translation.

Challenges and Opportunities

Challenges

High Cost and Technical Complexity Hinders the Adoption of Humanized Mouse Model

The primary disadvantage in terms of adoption of humanized mouse models remains their extremely costly and technically demanding status. Their generation-and maintenance-require specialized knowledge, state-of-the-art genetic engineering techniques, and immunological alterations to an extent that they are far more expensive than their classical counterparts.

Moreover, extended gestation periods coupled with poor breeding efficiencies only make matters worse in terms of cost and render such models low on scalability.Furthermore, variability with engraftment success and variation in immune response will add to the experimental unpredictability of these models, therefore demanding an extra level of procedure validation.

Opportunities

Rising Demand for Infectious Disease Researchposes significant opportunity for humanized mouse model

Humanized mice are critical for modeling human-specific pathogens such as HIV, SARS-CoV-2, Zika, and the hepatitis viruses that otherwise do not infect conventional mouse models. Following continuous advances in antiviral drug discovery and vaccine development, humanized mice are presently employed by the pharmaceutical and biotechnology industry for testing novel therapies in settings of human immune systems helmeting physiologically relevant counterparts.

Furthermore, global pandemics preparedness programs and an increase in concerns regarding antimicrobial resistance (AMR) are creating a necessity for advanced preclinical models that may closely mimic human responses. Increased government and research institutional investment in infectious disease modeling is accelerating humanized mouse market development.

Industry Specific Highlights

Expanding Role in Immuno-Oncology Research Surges the Growth of the Market

Humanized mouse models occupy center stage in immuno-oncology drug discovery, where human immune cells can be studied for interaction with cancer. The pharmaceutical industry, in turn, is finding increasing applicability of these models in the screening of immune checkpoint inhibitors, CAR-T therapies, and monoclonal antibodies. Compared with more isolated conventional models, humanized mice are highlighting safety and efficacy methods for rapid clinical translation in immunotherapy.

Towards developing cancer immunotherapies, leading biotech and pharmaceutical companies have invested substantially in improving engraftment methodologies and in the development of customized humanized models to specifically interrogate certain cancers, thus driving demand on the part of such preclinical reagents.

Rising Adoption in Infectious Disease Research Anticipates the Growth of the Market

The need for more efficacious models in infectious diseases prompted the increasing usage of humanized mouse models, especially in research relating to viral infections such as HIV, hepatitis, and tuberculosis.Research organizations and pharmaceutical companies utilize these models extensively to design new therapeutic avenues against novel and re-emerging infectious diseases.

Further, public health agencies and regulatory bodies would also support funding programs for the application of humanized mice to dissecting the pathogenesis of the disease and drug responses, thus paving the way for industry development.

Emerging Trends

Expansion of Hematopoietic Stem Cell (HSC)-Humanized Models

Amongst the emerging trends in humanized mouse research is the generation of advanced HSC-humanized models that support long-term engraftments for functional human immune cells. These models offer a more relevant platform for studying autoimmune diseases, chronic inflammation, and hematological tumors.

The HSC-humanized mouse model is now gaining increasing acceptance by pharmaceutical companies to assess next-generation immunotherapies targeted at bispecific antibodies and cytokine-based therapies. In the same vein, there is increased emphasis on streamlining engraftment and immune cell differentiation for a more reproducible and consistent model of drug development and disease modelling.

Increasing Use in Transplantation and Graft-Versus-Host Disease (GVHD) Research

With rising cases of organ transplantation worldwide, organ transplant scientists are working on these models to study compatibility of immune responses and tolerance-creating approaches to organ transplant patients. The pharmaceutical industry is using humanized models for the screening of new immuno-suppressants toward decreasing rejection rates in transplants.

The increasing rates of bone marrow and stem cell transplantation, together with the rising technology in human immune system reconstruction are creating further demand for these models in transplantation studies.

Brief Market Overview

Between 2020 and 2024, market growth was stimulated by rising demand for preclinical drug testing; increased funding for infectious diseases and oncology research; and improvements to the methodology for the reconstruction of immune systems. The COVID-19 pandemic also sped up the use of the model in the development of antivirals, drugs, and vaccines.

For the period 2025 to 2035, growth would be further stimulated by advances in stem cell engraftment, research on transplantation, and hematopoietic models. The demand further fueled by increasing applications in autoimmune disease, regenerative medicine, and transplantation studies. Increased funding and regulatory support in conjunction with pharma collaborations will drive continuous innovations and wider acceptance across various research domains.
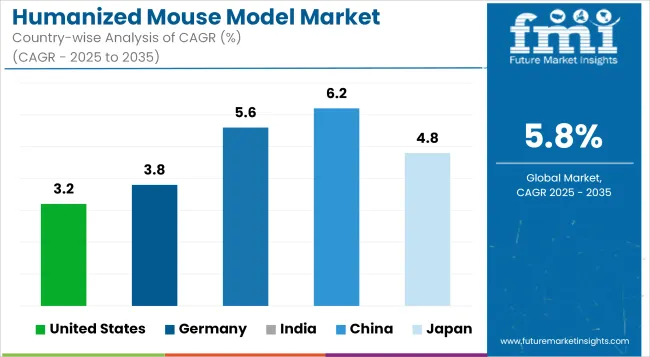
Country Wise Analysis

Humanized Mouse Model Market Cagr Analysis By Country

United States

Market Outlook

The greatest market of humanized mouse models is by far the USA because much spending on research and development is directed to cancer immunotherapy, infectious disease, and autoimmune disease. There are other reasons why the market has high growth, such as the presence of leading pharma companies and strong academic research supported by NIH funding. Adoption is further driven due to increasing FDA approvals of humanized models for preclinical drug testing.

Market Growth Factors

  • Strong NIH and Pharma Funding: Major investment in research related to oncology, infectious diseases, and metabolic disorders.
  • FDA Preclinical Testing Approval: Enhanced regulatory approval leads to greater usage in drug discovery.
  • CRO Expansion: Expanding contract research organizations will make humanized models more accessible.
  • Rising Trials in Cancer Immunotherapy: Growing needs for consistent in vivo models increase demand in this market.
  • Advanced Research Infrastructure: Established biotech hubs facilitate innovations in humanized mouse research.

Market Outlook

Country CAGR (2025 to 2035)
United States 3.2%

Germany

Market Outlook

This country is very strong on biomedical research and has a very stringent regulatory environment which really advances the use of humanized mouse models. Further spurred on by the nation's advances in oncology and immunotherapy research and the increasing number of pharmaceutical partnerships within Germany, the market grows. Increasing amounts of government funding made available for translational medicine and studies on drug effectiveness accelerates demand further into the nation.

Market Growth Factors

  • Biomedical Research Investments: Impressive hikes in investments in immuno-oncology and autoimmune disease research.
  • Regulatory Stringency: Increasing demand for valid humanized models due to stringently compliance requirements.
  • Pharmaceutical Collaborations: Robust interaction among biotech companies and academia leads to better acceptance.
  • Precision Medicine Growth: Broadened horizons towards patient-specific treatment paradigms support research applications.
  • Translational Research: Initiative support from government encourages humanized mouse models as a tool in preclinical drug testing.

Market Forecast

Country CAGR (2025 to 2035)
Germany 3.8%

India

Market Outlook

Emergence of biotechnology industries and increasing number of contract research organizations (CROs), in addition to focus on vaccine and drug development, thus many factors propelling growth. Through funding programs and the relaxation of clinical trial regulations, there are also incentives from the government that enhance adoption.

People are becoming increasingly aware of the requirement for research on humanized mouse models, and so in above factors, there are increasing global partnerships that further strengthen demand.

Market Growth Factors

  • Expanding Biotech Sector: The boon in the pharmaceutical industry is driving the demand for preclinical testing solutions.
  • Government Research Support: Initiatives for funding encourage the use of humanized mouse models for research.
  • Increase in CRO Activities: Increase in the passage of outsourced drug testing fuels need for human-relevant in vivo models.
  • Growth in the Development of Vaccines: Accelerating the market is increased emphasis on research in infectious diseases.
  • Academic Collaborations Increasingly Rising: Universities are working with pharma companies to promote speedier research activities.

Market Forecast

Country CAGR (2025 to 2035)
India 5.6%

China

Market Outlook

The market for humanized mouse models in China is growing at an extremely rapid pace due to the investment in translational research and precision medicine in China. Activities funded by the government for the improvement of drug discovery, expanding biotech firms, and enhanced requirement for immuno-oncology research boost the market growth. Another area of growth for local CROs that further endorses adoption in pharma R&D.

Market Growth Drivers

  • Advances in Precision Medicine: Government backing on research on personalized treatment develops the adoption aspect.
  • Growth of local contract research organizations: CRM contract research models have now escalated the use of humanized models.
  • Advanced Research on Oncology: The incidence of cancer demands precise preclinical models.
  • Boom in Biotech Startups: The ever-growing number of innovative biotech establishments also invests in translational research.
  • Government-Funded R&D Support: Promoted by government-funded development programs.

Market Forecast

Country CAGR (2025 to 2035)
China 6.2%

Japan

Market Outlook

Japan has advanced research capabilities and puts much weight on regenerative medicine and stem cell research. All these act towards propelling the market for humanized mouse models. The aging of the population in Japan thus adds to a higher demand for preclinical research towards age-related disorders. Infrastructures and government policies further improve the academia-pharma collaboration towards the increased use of these models.

Market Growth Drivers

  • Stem Cell and Regenerative Medicine Growth: Rising research fuel demand for humanized in vivo models.
  • Aging Population Research Needs: Greater emphasis on age-related disease facilitates market growth.
  • Academic-Industry Collaborations: Close collaboration between universities and pharmaceutical companies.
  • Regulatory Framework Enhancements: Efficient approval processes drive model development.
  • Focus on Neurodegenerative Diseases: Increased interest in research into Alzheimer's disease and Parkinson's disease enhances adoption.

Market Forecast

Country CAGR (2025 to 2035)
Japan 4.8%

Competitive Outlook

Intense competition is present in the humanized mouse model market due to the emergence of technical advancement in genetic engineering people on the side of the regulatory authorities and huge demand for preclinical models that will map onto clinical outcome accurately. Authorities such as the FDA and EMA focusing on ethical issues and replicability during drug testing will further determine market trends.

Market leaders secure their share through alliances with pharma companies, biotech industries, and academia to develop disease-specific humanized models. On these premises, regional players throw challenges to global leaders with inexpensive alternatives, specialized localized settings, and scalable research services. On the balance of the emerging market for lucrative opportunities, competition is thrown by innovative pricing mechanisms, enhanced CRO collaborations, and making of tailored models.

Other Key Players

  • HuMurine Technologies
  • Champions Oncology Inc.
  • Genoway S.A.
  • Crown Bioscience Inc.
  • Taconic Biosciences Inc.
  • The Jackson Laboratory
  • Vitalstar Biotechnology Co. Ltd.

Key Segments 

By Model Type:

The market is segmented into Genetic and Cell-Based (CD34, PBMC, and BLT).

By Application:

The market is segmented into Oncology, Immunology and Infectious Diseases, Neuroscience, Toxicology, Hematopoiesis, and Other Applications.

By End User:

The market is segmented into Pharmaceutical & Biotechnology Companies, Contract Research Organizations, and Academic & Research Institutions.

By Region:

The Humanized Mouse Model Market is analyzed across North America, Latin America, Western Europe, Eastern Europe, East Asia, South Asia Pacific, and the Middle East & Africa.

Table of Content

  1. Executive Summary
  2. Industry Introduction, including Taxonomy and Market Definition
  3. Market Trends and Success Factors, including Macro-economic Factors, Market Dynamics, and Recent Industry Developments
  4. Global Market Demand Analysis 2020 to 2024 and Forecast 2025 to 2035, including Historical Analysis and Future Projections
  5. Global Market Analysis 2020 to 2024 and Forecast 2025 to 2035
    • By Model Type
    • By Application
    • By End User
    • By Region
  6. Global Market Analysis 2020 to 2024 and Forecast 2025 to 2035, By Model Type
    • Genetic
    • Cell-based
      • CD34
      • PBMC
      • BLT
  7. Global Market Analysis 2020 to 2024 and Forecast 2025 to 2035, By Application
    • Oncology
    • Immunology and Infectious Diseases
    • Neuroscience
    • Toxicology
    • Hematopoiesis
    • Other Applications
  8. Global Market Analysis 2020 to 2024 and Forecast 2025 to 2035, By End User
    • Pharmaceutical & Biotechnology Companies
    • Contract Research Organizations
    • Academic & Research Institutions
  9. Global Market Analysis 2020 to 2024 and Forecast 2025 to 2035, By Region
    • North America
    • Latin America
    • East Asia
    • South Asia and Pacific
    • Western Europe
    • Eastern Europe
    • Middle East and Africa
  10. North America Sales Analysis 2020 to 2024 and Forecast 2025 to 2035, by Key Segments and Countries
  11. Latin America Sales Analysis 2020 to 2024 and Forecast 2025 to 2035, by Key Segments and Countries
  12. East Asia Sales Analysis 2020 to 2024 and Forecast 2025 to 2035, by Key Segments and Countries
  13. South Asia & Pacific Sales Analysis 2020 to 2024 and Forecast 2025 to 2035, by Key Segments and Countries
  14. Western Europe Sales Analysis 2020 to 2024 and Forecast 2025 to 2035, by Key Segments and Countries
  15. Eastern Europe Sales Analysis 2020 to 2024 and Forecast 2025 to 2035, by Key Segments and Countries
  16. Middle East and Africa Sales Analysis 2020 to 2024 and Forecast 2025 to 2035, by Key Segments and Countries
  17. Sales Forecast 2025 to 2035 by Model Type, Application, and End User for 30 Countries
  18. Competition Outlook, including Market Structure Analysis, Company Share Analysis by Key Players, and Competition Dashboard
  19. Company Profile
    • Ingenious Targeting Laboratory
    • Axenis S.A.S
    • Trans Genic Inc.
    • Horizon Discovery Group PLC
    • HuMurine Technologies
    • Champions Oncology Inc.
    • Genoway S.A.
    • Crown Bioscience Inc.
    • Taconic Biosciences Inc.
    • The Jackson Laboratory
    • Vitalstar Biotechnology Co. Ltd.

List of Tables

  • Table 1: Global Market Value (USD Million) Forecast by Region, 2020 to 2035
  • Table 2: Global Market Volume (Units) Forecast by Region, 2020 to 2035
  • Table 3: Global Market Value (USD Million) Forecast by Model Type, 2020 to 2035
  • Table 4: Global Market Volume (Units) Forecast by Model Type, 2020 to 2035
  • Table 5: Global Market Value (USD Million) Forecast by Application, 2020 to 2035
  • Table 6: Global Market Volume (Units) Forecast by Application, 2020 to 2035
  • Table 7: Global Market Value (USD Million) Forecast by End User, 2020 to 2035
  • Table 8: Global Market Volume (Units) Forecast by End User, 2020 to 2035
  • Table 9: North America Market Value (USD Million) Forecast by Country, 2020 to 2035
  • Table 10: North America Market Volume (Units) Forecast by Country, 2020 to 2035
  • Table 11: North America Market Value (USD Million) Forecast by Model Type, 2020 to 2035
  • Table 12: North America Market Volume (Units) Forecast by Model Type, 2020 to 2035
  • Table 13: North America Market Value (USD Million) Forecast by Application, 2020 to 2035
  • Table 14: North America Market Volume (Units) Forecast by Application, 2020 to 2035
  • Table 15: North America Market Value (USD Million) Forecast by End User, 2020 to 2035
  • Table 16: North America Market Volume (Units) Forecast by End User, 2020 to 2035
  • Table 17: Latin America Market Value (USD Million) Forecast by Country, 2020 to 2035
  • Table 18: Latin America Market Volume (Units) Forecast by Country, 2020 to 2035
  • Table 19: Latin America Market Value (USD Million) Forecast by Model Type, 2020 to 2035
  • Table 20: Latin America Market Volume (Units) Forecast by Model Type, 2020 to 2035
  • Table 21: Latin America Market Value (USD Million) Forecast by Application, 2020 to 2035
  • Table 22: Latin America Market Volume (Units) Forecast by Application, 2020 to 2035
  • Table 23: Latin America Market Value (USD Million) Forecast by End User, 2020 to 2035
  • Table 24: Latin America Market Volume (Units) Forecast by End User, 2020 to 2035
  • Table 25: Western Europe Market Value (USD Million) Forecast by Country, 2020 to 2035
  • Table 26: Western Europe Market Volume (Units) Forecast by Country, 2020 to 2035
  • Table 27: Western Europe Market Value (USD Million) Forecast by Model Type, 2020 to 2035
  • Table 28: Western Europe Market Volume (Units) Forecast by Model Type, 2020 to 2035
  • Table 29: Western Europe Market Value (USD Million) Forecast by Application, 2020 to 2035
  • Table 30: Western Europe Market Volume (Units) Forecast by Application, 2020 to 2035
  • Table 31: Western Europe Market Value (USD Million) Forecast by End User, 2020 to 2035
  • Table 32: Western Europe Market Volume (Units) Forecast by End User, 2020 to 2035
  • Table 33: Eastern Europe Market Value (USD Million) Forecast by Country, 2020 to 2035
  • Table 34: Eastern Europe Market Volume (Units) Forecast by Country, 2020 to 2035
  • Table 35: Eastern Europe Market Value (USD Million) Forecast by Model Type, 2020 to 2035
  • Table 36: Eastern Europe Market Volume (Units) Forecast by Model Type, 2020 to 2035
  • Table 37: Eastern Europe Market Value (USD Million) Forecast by Application, 2020 to 2035
  • Table 38: Eastern Europe Market Volume (Units) Forecast by Application, 2020 to 2035
  • Table 39: Eastern Europe Market Value (USD Million) Forecast by End User, 2020 to 2035
  • Table 40: Eastern Europe Market Volume (Units) Forecast by End User, 2020 to 2035
  • Table 41: South Asia and Pacific Market Value (USD Million) Forecast by Country, 2020 to 2035
  • Table 42: South Asia and Pacific Market Volume (Units) Forecast by Country, 2020 to 2035
  • Table 43: South Asia and Pacific Market Value (USD Million) Forecast by Model Type, 2020 to 2035
  • Table 44: South Asia and Pacific Market Volume (Units) Forecast by Model Type, 2020 to 2035
  • Table 45: South Asia and Pacific Market Value (USD Million) Forecast by Application, 2020 to 2035
  • Table 46: South Asia and Pacific Market Volume (Units) Forecast by Application, 2020 to 2035
  • Table 47: South Asia and Pacific Market Value (USD Million) Forecast by End User, 2020 to 2035
  • Table 48: South Asia and Pacific Market Volume (Units) Forecast by End User, 2020 to 2035
  • Table 49: East Asia Market Value (USD Million) Forecast by Country, 2020 to 2035
  • Table 50: East Asia Market Volume (Units) Forecast by Country, 2020 to 2035
  • Table 51: East Asia Market Value (USD Million) Forecast by Model Type, 2020 to 2035
  • Table 52: East Asia Market Volume (Units) Forecast by Model Type, 2020 to 2035
  • Table 53: East Asia Market Value (USD Million) Forecast by Application, 2020 to 2035
  • Table 54: East Asia Market Volume (Units) Forecast by Application, 2020 to 2035
  • Table 55: East Asia Market Value (USD Million) Forecast by End User, 2020 to 2035
  • Table 56: East Asia Market Volume (Units) Forecast by End User, 2020 to 2035
  • Table 57: Middle East and Africa Market Value (USD Million) Forecast by Country, 2020 to 2035
  • Table 58: Middle East and Africa Market Volume (Units) Forecast by Country, 2020 to 2035
  • Table 59: Middle East and Africa Market Value (USD Million) Forecast by Model Type, 2020 to 2035
  • Table 60: Middle East and Africa Market Volume (Units) Forecast by Model Type, 2020 to 2035
  • Table 61: Middle East and Africa Market Value (USD Million) Forecast by Application, 2020 to 2035
  • Table 62: Middle East and Africa Market Volume (Units) Forecast by Application, 2020 to 2035
  • Table 63: Middle East and Africa Market Value (USD Million) Forecast by End User, 2020 to 2035
  • Table 64: Middle East and Africa Market Volume (Units) Forecast by End User, 2020 to 2035

List of Figures

  • Figure 1: Global Market Value (USD Million) by Model Type, 2025 to 2035
  • Figure 2: Global Market Value (USD Million) by Application, 2025 to 2035
  • Figure 3: Global Market Value (USD Million) by End User, 2025 to 2035
  • Figure 4: Global Market Value (USD Million) by Region, 2025 to 2035
  • Figure 5: Global Market Value (USD Million) Analysis by Region, 2020 to 2035
  • Figure 6: Global Market Volume (Units) Analysis by Region, 2020 to 2035
  • Figure 7: Global Market Value Share (%) and BPS Analysis by Region, 2025 to 2035
  • Figure 8: Global Market Y-o-Y Growth (%) Projections by Region, 2025 to 2035
  • Figure 9: Global Market Value (USD Million) Analysis by Model Type, 2020 to 2035
  • Figure 10: Global Market Volume (Units) Analysis by Model Type, 2020 to 2035
  • Figure 11: Global Market Value Share (%) and BPS Analysis by Model Type, 2025 to 2035
  • Figure 12: Global Market Y-o-Y Growth (%) Projections by Model Type, 2025 to 2035
  • Figure 13: Global Market Value (USD Million) Analysis by Application, 2020 to 2035
  • Figure 14: Global Market Volume (Units) Analysis by Application, 2020 to 2035
  • Figure 15: Global Market Value Share (%) and BPS Analysis by Application, 2025 to 2035
  • Figure 16: Global Market Y-o-Y Growth (%) Projections by Application, 2025 to 2035
  • Figure 17: Global Market Value (USD Million) Analysis by End User, 2020 to 2035
  • Figure 18: Global Market Volume (Units) Analysis by End User, 2020 to 2035
  • Figure 19: Global Market Value Share (%) and BPS Analysis by End User, 2025 to 2035
  • Figure 20: Global Market Y-o-Y Growth (%) Projections by End User, 2025 to 2035
  • Figure 21: Global Market Attractiveness by Model Type, 2025 to 2035
  • Figure 22: Global Market Attractiveness by Application, 2025 to 2035
  • Figure 23: Global Market Attractiveness by End User, 2025 to 2035
  • Figure 24: Global Market Attractiveness by Region, 2025 to 2035
  • Figure 25: North America Market Value (USD Million) by Model Type, 2025 to 2035
  • Figure 26: North America Market Value (USD Million) by Application, 2025 to 2035
  • Figure 27: North America Market Value (USD Million) by End User, 2025 to 2035
  • Figure 28: North America Market Value (USD Million) by Country, 2025 to 2035
  • Figure 29: North America Market Value (USD Million) Analysis by Country, 2020 to 2035
  • Figure 30: North America Market Volume (Units) Analysis by Country, 2020 to 2035
  • Figure 31: North America Market Value Share (%) and BPS Analysis by Country, 2025 to 2035
  • Figure 32: North America Market Y-o-Y Growth (%) Projections by Country, 2025 to 2035
  • Figure 33: North America Market Value (USD Million) Analysis by Model Type, 2020 to 2035
  • Figure 34: North America Market Volume (Units) Analysis by Model Type, 2020 to 2035
  • Figure 35: North America Market Value Share (%) and BPS Analysis by Model Type, 2025 to 2035
  • Figure 36: North America Market Y-o-Y Growth (%) Projections by Model Type, 2025 to 2035
  • Figure 37: North America Market Value (USD Million) Analysis by Application, 2020 to 2035
  • Figure 38: North America Market Volume (Units) Analysis by Application, 2020 to 2035
  • Figure 39: North America Market Value Share (%) and BPS Analysis by Application, 2025 to 2035
  • Figure 40: North America Market Y-o-Y Growth (%) Projections by Application, 2025 to 2035
  • Figure 41: North America Market Value (USD Million) Analysis by End User, 2020 to 2035
  • Figure 42: North America Market Volume (Units) Analysis by End User, 2020 to 2035
  • Figure 43: North America Market Value Share (%) and BPS Analysis by End User, 2025 to 2035
  • Figure 44: North America Market Y-o-Y Growth (%) Projections by End User, 2025 to 2035
  • Figure 45: North America Market Attractiveness by Model Type, 2025 to 2035
  • Figure 46: North America Market Attractiveness by Application, 2025 to 2035
  • Figure 47: North America Market Attractiveness by End User, 2025 to 2035
  • Figure 48: North America Market Attractiveness by Country, 2025 to 2035
  • Figure 49: Latin America Market Value (USD Million) by Model Type, 2025 to 2035
  • Figure 50: Latin America Market Value (USD Million) by Application, 2025 to 2035
  • Figure 51: Latin America Market Value (USD Million) by End User, 2025 to 2035
  • Figure 52: Latin America Market Value (USD Million) by Country, 2025 to 2035
  • Figure 53: Latin America Market Value (USD Million) Analysis by Country, 2020 to 2035
  • Figure 54: Latin America Market Volume (Units) Analysis by Country, 2020 to 2035
  • Figure 55: Latin America Market Value Share (%) and BPS Analysis by Country, 2025 to 2035
  • Figure 56: Latin America Market Y-o-Y Growth (%) Projections by Country, 2025 to 2035
  • Figure 57: Latin America Market Value (USD Million) Analysis by Model Type, 2020 to 2035
  • Figure 58: Latin America Market Volume (Units) Analysis by Model Type, 2020 to 2035
  • Figure 59: Latin America Market Value Share (%) and BPS Analysis by Model Type, 2025 to 2035
  • Figure 60: Latin America Market Y-o-Y Growth (%) Projections by Model Type, 2025 to 2035
  • Figure 61: Latin America Market Value (USD Million) Analysis by Application, 2020 to 2035
  • Figure 62: Latin America Market Volume (Units) Analysis by Application, 2020 to 2035
  • Figure 63: Latin America Market Value Share (%) and BPS Analysis by Application, 2025 to 2035
  • Figure 64: Latin America Market Y-o-Y Growth (%) Projections by Application, 2025 to 2035
  • Figure 65: Latin America Market Value (USD Million) Analysis by End User, 2020 to 2035
  • Figure 66: Latin America Market Volume (Units) Analysis by End User, 2020 to 2035
  • Figure 67: Latin America Market Value Share (%) and BPS Analysis by End User, 2025 to 2035
  • Figure 68: Latin America Market Y-o-Y Growth (%) Projections by End User, 2025 to 2035
  • Figure 69: Latin America Market Attractiveness by Model Type, 2025 to 2035
  • Figure 70: Latin America Market Attractiveness by Application, 2025 to 2035
  • Figure 71: Latin America Market Attractiveness by End User, 2025 to 2035
  • Figure 72: Latin America Market Attractiveness by Country, 2025 to 2035
  • Figure 73: Western Europe Market Value (USD Million) by Model Type, 2025 to 2035
  • Figure 74: Western Europe Market Value (USD Million) by Application, 2025 to 2035
  • Figure 75: Western Europe Market Value (USD Million) by End User, 2025 to 2035
  • Figure 76: Western Europe Market Value (USD Million) by Country, 2025 to 2035
  • Figure 77: Western Europe Market Value (USD Million) Analysis by Country, 2020 to 2035
  • Figure 78: Western Europe Market Volume (Units) Analysis by Country, 2020 to 2035
  • Figure 79: Western Europe Market Value Share (%) and BPS Analysis by Country, 2025 to 2035
  • Figure 80: Western Europe Market Y-o-Y Growth (%) Projections by Country, 2025 to 2035
  • Figure 81: Western Europe Market Value (USD Million) Analysis by Model Type, 2020 to 2035
  • Figure 82: Western Europe Market Volume (Units) Analysis by Model Type, 2020 to 2035
  • Figure 83: Western Europe Market Value Share (%) and BPS Analysis by Model Type, 2025 to 2035
  • Figure 84: Western Europe Market Y-o-Y Growth (%) Projections by Model Type, 2025 to 2035
  • Figure 85: Western Europe Market Value (USD Million) Analysis by Application, 2020 to 2035
  • Figure 86: Western Europe Market Volume (Units) Analysis by Application, 2020 to 2035
  • Figure 87: Western Europe Market Value Share (%) and BPS Analysis by Application, 2025 to 2035
  • Figure 88: Western Europe Market Y-o-Y Growth (%) Projections by Application, 2025 to 2035
  • Figure 89: Western Europe Market Value (USD Million) Analysis by End User, 2020 to 2035
  • Figure 90: Western Europe Market Volume (Units) Analysis by End User, 2020 to 2035
  • Figure 91: Western Europe Market Value Share (%) and BPS Analysis by End User, 2025 to 2035
  • Figure 92: Western Europe Market Y-o-Y Growth (%) Projections by End User, 2025 to 2035
  • Figure 93: Western Europe Market Attractiveness by Model Type, 2025 to 2035
  • Figure 94: Western Europe Market Attractiveness by Application, 2025 to 2035
  • Figure 95: Western Europe Market Attractiveness by End User, 2025 to 2035
  • Figure 96: Western Europe Market Attractiveness by Country, 2025 to 2035
  • Figure 97: Eastern Europe Market Value (USD Million) by Model Type, 2025 to 2035
  • Figure 98: Eastern Europe Market Value (USD Million) by Application, 2025 to 2035
  • Figure 99: Eastern Europe Market Value (USD Million) by End User, 2025 to 2035
  • Figure 100: Eastern Europe Market Value (USD Million) by Country, 2025 to 2035
  • Figure 101: Eastern Europe Market Value (USD Million) Analysis by Country, 2020 to 2035
  • Figure 102: Eastern Europe Market Volume (Units) Analysis by Country, 2020 to 2035
  • Figure 103: Eastern Europe Market Value Share (%) and BPS Analysis by Country, 2025 to 2035
  • Figure 104: Eastern Europe Market Y-o-Y Growth (%) Projections by Country, 2025 to 2035
  • Figure 105: Eastern Europe Market Value (USD Million) Analysis by Model Type, 2020 to 2035
  • Figure 106: Eastern Europe Market Volume (Units) Analysis by Model Type, 2020 to 2035
  • Figure 107: Eastern Europe Market Value Share (%) and BPS Analysis by Model Type, 2025 to 2035
  • Figure 108: Eastern Europe Market Y-o-Y Growth (%) Projections by Model Type, 2025 to 2035
  • Figure 109: Eastern Europe Market Value (USD Million) Analysis by Application, 2020 to 2035
  • Figure 110: Eastern Europe Market Volume (Units) Analysis by Application, 2020 to 2035
  • Figure 111: Eastern Europe Market Value Share (%) and BPS Analysis by Application, 2025 to 2035
  • Figure 112: Eastern Europe Market Y-o-Y Growth (%) Projections by Application, 2025 to 2035
  • Figure 113: Eastern Europe Market Value (USD Million) Analysis by End User, 2020 to 2035
  • Figure 114: Eastern Europe Market Volume (Units) Analysis by End User, 2020 to 2035
  • Figure 115: Eastern Europe Market Value Share (%) and BPS Analysis by End User, 2025 to 2035
  • Figure 116: Eastern Europe Market Y-o-Y Growth (%) Projections by End User, 2025 to 2035
  • Figure 117: Eastern Europe Market Attractiveness by Model Type, 2025 to 2035
  • Figure 118: Eastern Europe Market Attractiveness by Application, 2025 to 2035
  • Figure 119: Eastern Europe Market Attractiveness by End User, 2025 to 2035
  • Figure 120: Eastern Europe Market Attractiveness by Country, 2025 to 2035
  • Figure 121: South Asia and Pacific Market Value (USD Million) by Model Type, 2025 to 2035
  • Figure 122: South Asia and Pacific Market Value (USD Million) by Application, 2025 to 2035
  • Figure 123: South Asia and Pacific Market Value (USD Million) by End User, 2025 to 2035
  • Figure 124: South Asia and Pacific Market Value (USD Million) by Country, 2025 to 2035
  • Figure 125: South Asia and Pacific Market Value (USD Million) Analysis by Country, 2020 to 2035
  • Figure 126: South Asia and Pacific Market Volume (Units) Analysis by Country, 2020 to 2035
  • Figure 127: South Asia and Pacific Market Value Share (%) and BPS Analysis by Country, 2025 to 2035
  • Figure 128: South Asia and Pacific Market Y-o-Y Growth (%) Projections by Country, 2025 to 2035
  • Figure 129: South Asia and Pacific Market Value (USD Million) Analysis by Model Type, 2020 to 2035
  • Figure 130: South Asia and Pacific Market Volume (Units) Analysis by Model Type, 2020 to 2035
  • Figure 131: South Asia and Pacific Market Value Share (%) and BPS Analysis by Model Type, 2025 to 2035
  • Figure 132: South Asia and Pacific Market Y-o-Y Growth (%) Projections by Model Type, 2025 to 2035
  • Figure 133: South Asia and Pacific Market Value (USD Million) Analysis by Application, 2020 to 2035
  • Figure 134: South Asia and Pacific Market Volume (Units) Analysis by Application, 2020 to 2035
  • Figure 135: South Asia and Pacific Market Value Share (%) and BPS Analysis by Application, 2025 to 2035
  • Figure 136: South Asia and Pacific Market Y-o-Y Growth (%) Projections by Application, 2025 to 2035
  • Figure 137: South Asia and Pacific Market Value (USD Million) Analysis by End User, 2020 to 2035
  • Figure 138: South Asia and Pacific Market Volume (Units) Analysis by End User, 2020 to 2035
  • Figure 139: South Asia and Pacific Market Value Share (%) and BPS Analysis by End User, 2025 to 2035
  • Figure 140: South Asia and Pacific Market Y-o-Y Growth (%) Projections by End User, 2025 to 2035
  • Figure 141: South Asia and Pacific Market Attractiveness by Model Type, 2025 to 2035
  • Figure 142: South Asia and Pacific Market Attractiveness by Application, 2025 to 2035
  • Figure 143: South Asia and Pacific Market Attractiveness by End User, 2025 to 2035
  • Figure 144: South Asia and Pacific Market Attractiveness by Country, 2025 to 2035
  • Figure 145: East Asia Market Value (USD Million) by Model Type, 2025 to 2035
  • Figure 146: East Asia Market Value (USD Million) by Application, 2025 to 2035
  • Figure 147: East Asia Market Value (USD Million) by End User, 2025 to 2035
  • Figure 148: East Asia Market Value (USD Million) by Country, 2025 to 2035
  • Figure 149: East Asia Market Value (USD Million) Analysis by Country, 2020 to 2035
  • Figure 150: East Asia Market Volume (Units) Analysis by Country, 2020 to 2035
  • Figure 151: East Asia Market Value Share (%) and BPS Analysis by Country, 2025 to 2035
  • Figure 152: East Asia Market Y-o-Y Growth (%) Projections by Country, 2025 to 2035
  • Figure 153: East Asia Market Value (USD Million) Analysis by Model Type, 2020 to 2035
  • Figure 154: East Asia Market Volume (Units) Analysis by Model Type, 2020 to 2035
  • Figure 155: East Asia Market Value Share (%) and BPS Analysis by Model Type, 2025 to 2035
  • Figure 156: East Asia Market Y-o-Y Growth (%) Projections by Model Type, 2025 to 2035
  • Figure 157: East Asia Market Value (USD Million) Analysis by Application, 2020 to 2035
  • Figure 158: East Asia Market Volume (Units) Analysis by Application, 2020 to 2035
  • Figure 159: East Asia Market Value Share (%) and BPS Analysis by Application, 2025 to 2035
  • Figure 160: East Asia Market Y-o-Y Growth (%) Projections by Application, 2025 to 2035
  • Figure 161: East Asia Market Value (USD Million) Analysis by End User, 2020 to 2035
  • Figure 162: East Asia Market Volume (Units) Analysis by End User, 2020 to 2035
  • Figure 163: East Asia Market Value Share (%) and BPS Analysis by End User, 2025 to 2035
  • Figure 164: East Asia Market Y-o-Y Growth (%) Projections by End User, 2025 to 2035
  • Figure 165: East Asia Market Attractiveness by Model Type, 2025 to 2035
  • Figure 166: East Asia Market Attractiveness by Application, 2025 to 2035
  • Figure 167: East Asia Market Attractiveness by End User, 2025 to 2035
  • Figure 168: East Asia Market Attractiveness by Country, 2025 to 2035
  • Figure 169: Middle East and Africa Market Value (USD Million) by Model Type, 2025 to 2035
  • Figure 170: Middle East and Africa Market Value (USD Million) by Application, 2025 to 2035
  • Figure 171: Middle East and Africa Market Value (USD Million) by End User, 2025 to 2035
  • Figure 172: Middle East and Africa Market Value (USD Million) by Country, 2025 to 2035
  • Figure 173: Middle East and Africa Market Value (USD Million) Analysis by Country, 2020 to 2035
  • Figure 174: Middle East and Africa Market Volume (Units) Analysis by Country, 2020 to 2035
  • Figure 175: Middle East and Africa Market Value Share (%) and BPS Analysis by Country, 2025 to 2035
  • Figure 176: Middle East and Africa Market Y-o-Y Growth (%) Projections by Country, 2025 to 2035
  • Figure 177: Middle East and Africa Market Value (USD Million) Analysis by Model Type, 2020 to 2035
  • Figure 178: Middle East and Africa Market Volume (Units) Analysis by Model Type, 2020 to 2035
  • Figure 179: Middle East and Africa Market Value Share (%) and BPS Analysis by Model Type, 2025 to 2035
  • Figure 180: Middle East and Africa Market Y-o-Y Growth (%) Projections by Model Type, 2025 to 2035
  • Figure 181: Middle East and Africa Market Value (USD Million) Analysis by Application, 2020 to 2035
  • Figure 182: Middle East and Africa Market Volume (Units) Analysis by Application, 2020 to 2035
  • Figure 183: Middle East and Africa Market Value Share (%) and BPS Analysis by Application, 2025 to 2035
  • Figure 184: Middle East and Africa Market Y-o-Y Growth (%) Projections by Application, 2025 to 2035
  • Figure 185: Middle East and Africa Market Value (USD Million) Analysis by End User, 2020 to 2035
  • Figure 186: Middle East and Africa Market Volume (Units) Analysis by End User, 2020 to 2035
  • Figure 187: Middle East and Africa Market Value Share (%) and BPS Analysis by End User, 2025 to 2035
  • Figure 188: Middle East and Africa Market Y-o-Y Growth (%) Projections by End User, 2025 to 2035
  • Figure 189: Middle East and Africa Market Attractiveness by Model Type, 2025 to 2035
  • Figure 190: Middle East and Africa Market Attractiveness by Application, 2025 to 2035
  • Figure 191: Middle East and Africa Market Attractiveness by End User, 2025 to 2035
  • Figure 192: Middle East and Africa Market Attractiveness by Country, 2025 to 2035

Frequently Asked Questions

What was the overall size of the Humanized Mouse Model Market in 2025?

The overall market size for humanized mouse model market was USD 113.6 Million in 2025.

How big is the Humanized Mouse Model Market expected in 2035?

The humanized mouse model market is expected to reach USD 119.6 million in 2035.

What will drive the demand for Humanized Mouse Model Market during the forecast period?

Expanding Cancer Research and Immunotherapy Development anticipates the growth of the humanized mouse model market.

List the top 5 Key players of the Humanized Mouse Model Market?

The top key players that drives the development of humanized mouse model market are Ingenious Targeting Laboratory, Axenis S.A.S, Trans Genic Inc., Horizon Discovery Group PLC and Champions Oncology Inc.

Which segment in product is expected to lead in Humanized Mouse Model Market?

Genetic segment by product is expected to dominate the market during the forecast period.

Explore Similar Insights

Future Market Insights

Humanized Mouse Model Market