Methodology

Mouse TNF-α Kit Market Forecast and Outlook 2025 to 2035

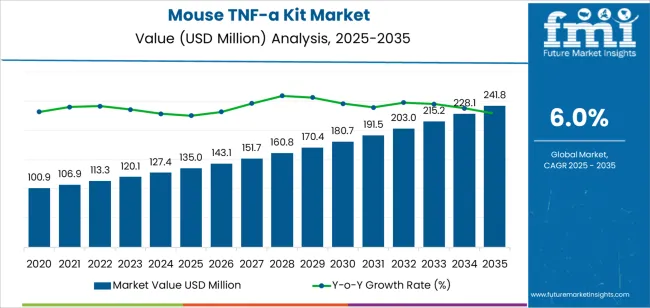
The mouse TNF-α kit market is forecast to grow from USD 135 million in 2025 to USD 241.8 million by 2035, reflecting a CAGR of 6%. This growth is primarily driven by the increasing demand for mouse TNF-α kits in biotechnology, pharmaceutical research, and medical diagnostics. These kits, used to detect and quantify tumor necrosis factor-alpha (TNF-α) in mice, are critical tools for understanding immune responses, inflammation, and various disease mechanisms. As preclinical research and drug development continue to advance, the need for accurate and reliable TNF-α measurement will support market growth.

The expanding focus on immunology research and inflammatory diseases such as autoimmune disorders and cancer will also fuel the demand for these kits. Moreover, technological advancements in biomarker detection and high-throughput screening are likely to enhance the performance and capabilities of mouse TNF-α kits, making them even more essential for research and clinical applications. As the healthcare and pharmaceutical industries continue to innovate, the market for Mouse TNF-α kits will experience consistent growth, supported by the expanding need for more precise and efficient research tools.
Quick Stats of the Mouse TNF-α Kit Market

  • Mouse TNF-α Kit Market Value (2025): USD 135 million
  • Mouse TNF-α Kit Market Forecast Value (2035): USD 241.8 million
  • Mouse TNF-α Kit Market Forecast CAGR (2025-2035): 6%
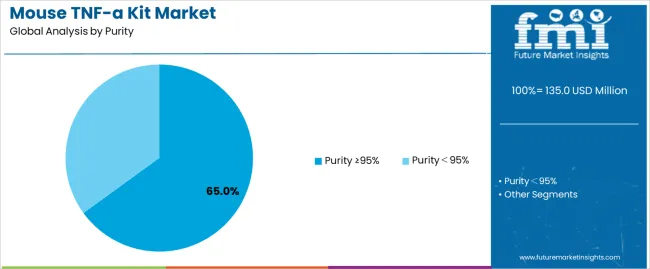
  • Mouse TNF-α Kit Market Leading Segment: Purity ≥95% (65%)
  • Mouse TNF-α Kit Market Key Growth Regions: China, India, Germany, Brazil, USA, UK, Japan
  • Mouse TNF-α Kit Market Top Players: Thermo Fisher Scientific Inc., Bio-Techne, Scientists Helping Scientists, MilliporeSigma, FUJIFILM Irvine Scientific, BD Biosciences, Sino Biological, Inc., BPS Bioscience, Inc., Elabscience, Yisheng Biotechnology (Shanghai) Co., Ltd., Abbkine, Beijing Biocreative Technology Co., Ltd., Shanghai Yaji Biotechnology Co., Ltd., Cellverse Co., Ltd., Dalian Meilun Biotech Co., Ltd.

Mouse Tnf A Kit Market Market Value Analysis

Mouse TNF-α Kit Market Year-over-Year Forecast (2025–2035)

From 2025 to 2030, the market is expected to grow from USD 135 million to USD 180.7 million, adding USD 45.7 million. This phase will see growing demand in biomedical research, driven by increasing studies on inflammatory diseases, immunology, and oncology. The use of mouse TNF-α kits in drug development and preclinical testing will continue to be key drivers of market expansion.

Between 2030 and 2035, the market is forecast to expand from USD 180.7 million to USD 241.8 million, adding USD 61.1 million in value. This period will see further growth driven by continued innovations in immunotherapy, biomarker identification, and the rising prevalence of chronic diseases requiring detailed immune response profiling. The increasing emphasis on personalized medicine and advanced diagnostic technologies will contribute significantly to the market’s sustained growth through 2035.

Mouse TNF-α Kit Market Key Takeaways

Metric Value
Market Value (2025) USD 135 million
Market Forecast Value (2035) USD 241.8 million
Forecast CAGR (2025-2035) 6%

What is driving the growth of the mouse TNF-α kit market?

The mouse TNF-α kit market is experiencing steady growth, driven by the rising demand for high-quality research tools in biomedical and pharmaceutical research. Tumor Necrosis Factor-alpha (TNF-α) is a key cytokine involved in inflammation and immune system regulation, making it an important target in immunology and disease studies. The increasing focus on immunotherapy, cancer research, and chronic inflammatory diseases is spurring the demand for reliable testing kits. Moreover, the rise in biotechnology innovations and the growing number of research centers and universities involved in TNF-α-related research are further boosting market growth. Government funding for scientific research and development in immunology is also contributing to market expansion, particularly in regions like China and India.

The increasing prevalence of autoimmune diseases, infectious diseases, and cancer is further propelling the need for precise diagnostic tools and testing solutions. Research facilities and academic institutions are increasingly using TNF-α kits for understanding the role of TNF-α in disease progression and developing new therapeutic interventions. With innovations in biotechnology and the continuous need for new and improved diagnostic tests, the mouse TNF-α kit market is expected to grow steadily in the coming years.

What are the key segments of the mouse TNF-α kit market?

The mouse TNF-α kit market is structured around segments by purity and by application, reflecting the diverse needs of research and academic institutions globally. By purity, the market distinguishes kits with purity ≥95% and those with purity <95%, with the high purity segment dominating due to its use in advanced immunology and therapeutic research. By application, the market separates demand from research centers and from universities, with research centers leading due to heavier funding and higher throughput requirements. Regions such as Asia Pacific (China, India) and Europe (Germany) show strong growth, driven by increasing biotechnology investment and regulatory focus on precision research.
Why is the purity ≥95% segment leading the market?

Mouse Tnf A Kit Market Analysis By Purity

The purity ≥95% segment holds a dominant share in the mouse TNF-α kit market, driven by the critical need for high specificity and minimal background interference in advanced research. These high purity kits are preferred by research centers conducting immunology, oncology, and inflammation studies, where measurement accuracy is vital. Such kits are essential when studying subtle variations in TNF-α expression in mouse models of disease, ensuring reproducibility and reliability of data. Research centers often require reagents that meet stringent technical specifications, such as low cross reactivity and high sensitivity, making high purity kits the default choice. Furthermore, pharmaceutical companies and biotech firms engaged in drug discovery use these kits in crucial assays where data integrity can influence development decisions. As global research activity grows-especially in emerging economies like China and India-the preference for high purity kits accelerates, reinforcing their leadership in this segment.
Why is the research center application leading the market?

Mouse Tnf A Kit Market Analysis By Application

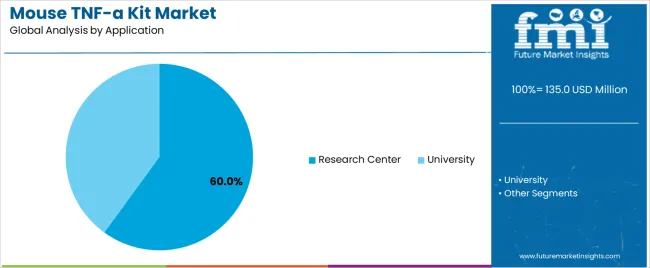
The research center segment leads demand in the mouse TNF-α kit market, accounting for a substantive share. Research centers-both public and private-drive large-scale studies into cytokine biology, inflammatory disease mechanisms, and preclinical testing, necessitating robust kits for TNF-α measurement. These institutions typically have higher budgets, deploy more advanced instrumentation, and run high-throughput workflows, thus favouring premium reagents and kits. The focus on immunotherapy, autoimmune disorders, and infectious disease research amplifies usage of TNF-α kits in these settings. Additionally, research centers in regions such as China and Germany are experiencing increased investment, enabling expansion of lab capacity and adoption of cutting edge kits. While universities contribute substantially and often collaborate with industry, their resource constraints and broader educational remit mean slower adoption of premium formats. Consequently, the research center application remains the cornerstone of market volume and innovation demand in this field.

What are the drivers, restraints, and key trends of the mouse TNF-α kit market?

The mouse TNF-α kit market is growing steadily due to increased investment in biomedical research, especially in the fields of immunology, oncology, and autoimmune diseases. The rising demand for precise and reliable diagnostic tools in research centers and universities, combined with the growing focus on precision medicine and biotechnology advancements, is driving market growth. Additionally, the expanding need for TNF-α kits to support drug development and clinical trials further contributes to the market’s expansion.

What are the key drivers of the mouse TNF-α kit market?

Key drivers of the mouse TNF-α kit market include the rising prevalence of autoimmune diseases, inflammatory disorders, and cancer, all of which increase the demand for accurate diagnostic tools. As the healthcare industry focuses more on immunotherapy and personalized medicine, there is a greater need for TNF-α testing to understand disease mechanisms and develop new treatments. Additionally, government funding and public-private partnerships are supporting biomedical research, further boosting the demand for these specialized testing kits. The increasing adoption of biotechnology innovations in both academic institutions and pharmaceutical companies also fuels market growth.

What are the key restraints in the mouse TNF-α kit market?

Despite steady growth, the mouse TNF-α kit market faces certain restraints. One of the primary challenges is the high cost of high-purity kits, especially those with purity ≥95%, which may limit their adoption in budget-constrained research environments. Moreover, complexity in handling and the need for highly specialized training to use these kits accurately could deter some potential customers. The lack of awareness in emerging markets and regulatory hurdles associated with international distribution and compliance also present barriers to the market’s expansion.

What are the key trends in the mouse TNF-α kit market?

Key trends in the mouse TNF-α kit market include a shift towards automated testing and high-throughput screening, which are increasingly demanded by research centers for large-scale studies. There is also a growing focus on digitalization and data integration in scientific research, which allows for more efficient TNF-α measurement and real-time data analysis. Furthermore, advancements in biotechnology are contributing to the development of more sensitive, specific, and user-friendly testing kits, as well as the integration of IoT-enabled devices for better performance tracking and monitoring in labs and clinical trials.

What is the country-wise analysis of the mouse TNF-α kit market?

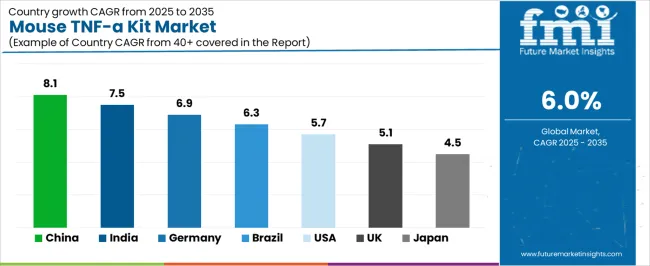
The mouse TNF-α kit market is witnessing variable growth trajectories across different geographies, driven by factors such as research funding, biotechnology infrastructure, and prevalence of immunological disorders. Emerging markets like China and India are expected to record higher growth rates due to rapid expansion of biomedical research centres and increased public private investment in life sciences sectors. In contrast, mature markets such as the USA, the UK and Japan are characterised by slower yet steady growth, reflecting high market saturation but continued demand for premium research reagents. Understanding each country’s growth rate and scientific ecosystem helps stakeholders tailor strategies for regional penetration and product adoption.
Mouse Tnf A Kit Market Cagr Analysis By Country

Country CAGR (%)
China 8.1%
India 7.5%
Germany 6.9%
Brazil 6.3%
USA 5.7%
UK 5.1%
Japan 4.5%

How is China shaping the market?

China is expected to grow at a CAGR of 8.1% in the mouse TNF-α kit market. The country’s expansion is driven by increasing government funding, rising number of biotech start ups, and major investments in immunology and oncology research. Many Chinese research centres are upgrading lab infrastructure, adopting high purity reagents, and collaborating globally, thus boosting demand for TNF-α kits. Moreover, the strong focus on precision medicine and immunotherapy in China generates significant demand for assays that measure cytokines like TNF-α. The large population base and increasing incidence of chronic inflammatory and autoimmune diseases further support market growth. As China continues to advance its life sciences ecosystem, it represents a top growth opportunity in this market segment.

How is India contributing to market expansion?

India is forecast to grow at a CAGR of 7.5% in the mouse TNF-α kit market. With a rapidly developing biotech sector and growing number of academic and research centres, India’s demand for high quality reagents like TNF-α kits is increasing. The government’s “Make in India” initiative and rising healthcare research funding are driving investments in immunology research infrastructure. Additionally, India’s high burden of infectious diseases, autoimmune disorders, and cancer creates greater need for cytokine detection assays in preclinical and translational research. While cost sensitivity remains a challenge, improved awareness, global collaborations and growing contract research organisation (CRO) activity are expected to elevate market penetration.
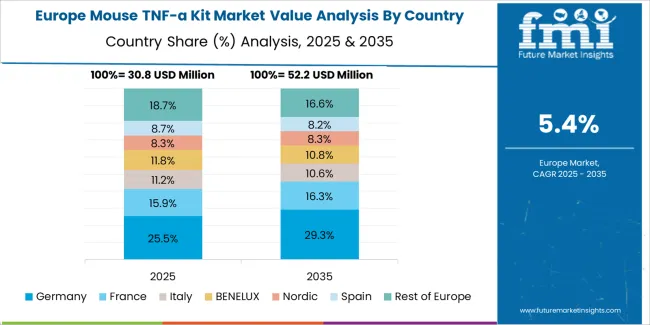
How is Germany performing in the market?

Mouse Tnf A Kit Market Europe Country Market Share Analysis, 2025 & 2035

Germany is projected to grow at a CAGR of 6.9% in the mouse TNF-α kit market. As Europe’s scientific hub, Germany boasts advanced laboratory infrastructure, strong pharmaceutical and biotechnology industries, and robust research funding. Demand for high purity reagents is driven by stringent regulatory standards and the prevalent use of immunology assays in drug discovery and translational research. German universities and research institutes frequently adopt cutting edge science tools, creating sustained demand for TNF-α kits. While growth is more moderate compared with emerging markets, Germany remains a strategic market for premium reagent suppliers due to the quality oriented purchase behaviour and strong life sciences tradition.

How is Brazil influencing the market?

Brazil is expected to grow at a CAGR of 6.3% in the mouse TNF-α kit market. Growth in Brazil is powered by expansion of academic research, increasing funding for biomedical studies, and improvements in healthcare research infrastructure. The country’s universities and research institutes are becoming more engaged in immunology and inflammation research, raising the demand for cytokine detection kits. However, budget constraints and fluctuating funding cycles impose some limitations. Despite this, large population size, rising disease burden, and growing collaboration with international biotech companies present significant opportunity for TNF-α kit providers to expand in Latin America.
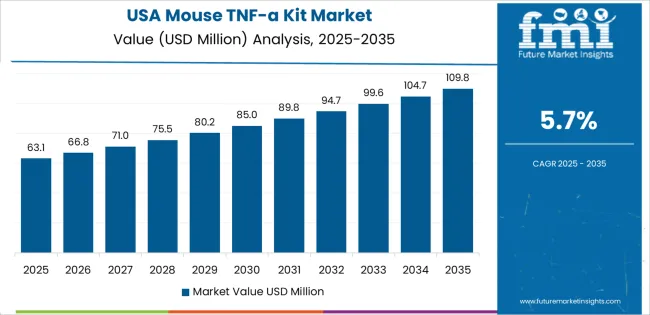
How is the USA supporting the market?

Mouse Tnf A Kit Market Country Value Analysis

The USA is projected to grow at a CAGR of 5.7% in the mouse TNF-α kit market. As the global leader in biotech and pharmaceutical research, the USA has a mature market characterised by high quality demand, advanced instrumentation and regulatory complexity. Research centres and universities conduct extensive immunology and oncology work, requiring premium reagents. While incremental growth is slower compared to emerging economies, the US market remains critical due to high per unit pricing, large installed base of research labs and ongoing drug discovery programmes targeting TNF-α pathways. Suppliers with advanced assay performance continue to focus on this market for profitability.

How is the UK contributing to market dynamics?

The UK is projected to grow at a CAGR of 5.1% in the mouse TNF-α kit market. With strong academic institutions, leading biotech clusters and government research funding, the UK maintains steady demand for high precision immunology kits. The UK’s focus on translational research, personalised medicine and cytokine biology supports demand for TNF-α assays. Although growth is moderate due to market maturity, the UK remains a key region for pilot studies, drug development and partnerships. Suppliers often target UK institutions to validate reagents and build reputational credibility before broader expansion.
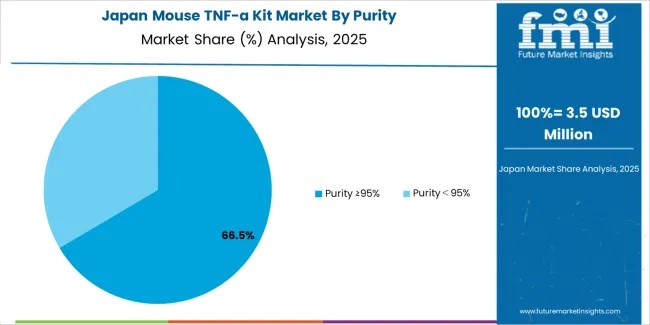
How is Japan playing a role in market growth?

Mouse Tnf A Kit Market Japan Market Share Analysis By Purity

Japan is expected to grow at a CAGR of 4.5% in the mouse TNF-α kit market. As a mature research market with advanced healthcare and biotech industries, growth in Japan is driven by high standards of reagent quality, precision science and a well developed academic ecosystem. The lower growth rate reflects market saturation and strong local reagent manufacturing, but demand remains steady as Japanese research institutes continue to conduct advanced studies into inflammation, immunology and therapeutic development. For reagent suppliers, Japan represents a market where product validation, localisation and high service levels are critical.
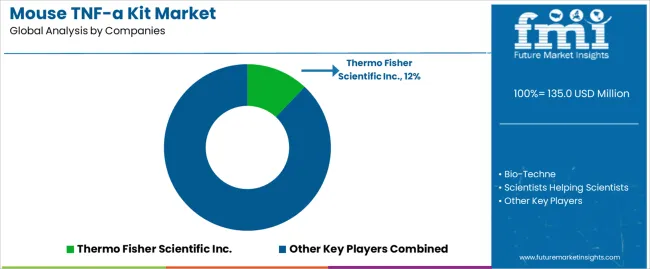
What is the competitive landscape of the mouse TNF-α kit market?

Mouse Tnf A Kit Market Analysis By Company

The mouse TNF-α kit market is dominated by a mix of large multinational life science corporations and specialised reagent providers. Companies such as Thermo Fisher Scientific Inc. (holding approximately 12% share), Bio Techne, MilliporeSigma and FUJIFILM Irvine Scientific lead through their global distribution networks, strong R&D capabilities and extensive validation of high purity kits. These firms maintain competitive advantage via regulatory approvals, broad product portfolios and customized solutions for academic institutions, biotechnology firms and pharmaceutical developers. Their established presence in major research hubs across North America, Europe and Asia gives them scale and influence in the market’s evolution.

Alongside these incumbents, smaller and regional players, such as Sino Biological, Yisheng Biotechnology (Shanghai), Abbkine and Dalian Meilun Biotech, are gaining traction by offering cost competitive kits with good regional support and faster turnaround times. They often target niche research segments or emerging markets where academic research funding is expanding. Strategic collaborations, merger and acquisition activity, and product innovation focused on automation, higher throughput and integrated assay platforms are reshaping this landscape. As research in inflammation, immunotherapy and cytokine biology accelerates globally, especially in China and India, market competition will increasingly revolve around value added features, localised support and distribution flexibility.

Key Players of the Mouse TNF-α Kit Market

  • Thermo Fisher Scientific Inc.
  • Bio-Techne
  • Scientists Helping Scientists
  • MilliporeSigma
  • FUJIFILM Irvine Scientific
  • BD Biosciences
  • Sino Biological,Inc.
  • BPS Bioscience, Inc.
  • Elabscience
  • Yisheng Biotechnology (Shanghai) Co., Ltd.
  • Abbkine
  • Beijing Biocreative Technology Co., Ltd.
  • Shanghai Yaji Biotechnology Co., Ltd.
  • Cellverse Co., Ltd.
  • Dalian Meilun Biotech Co., Ltd.

Scope of the Report

Items Details
Quantitative Units USD Million
Regions Covered China, India, Germany, Brazil, USA, UK, Japan
Purity Purity ≥95%, Purity <95%
Application Research Center (60%), University
Key Companies Profiled Thermo Fisher Scientific Inc., Bio-Techne, Scientists Helping Scientists, MilliporeSigma, FUJIFILM Irvine Scientific, BD Biosciences, Sino Biological, Inc., BPS Bioscience, Inc., Elabscience, Yisheng Biotechnology (Shanghai) Co., Ltd., Abbkine, Beijing Biocreative Technology Co., Ltd., Shanghai Yaji Biotechnology Co., Ltd., Cellverse Co., Ltd., Dalian Meilun Biotech Co., Ltd.
Additional Attributes The market analysis includes dollar sales by purity and application categories. It also covers regional adoption trends across major markets like China, India, Germany, and the USA. The competitive landscape focuses on key manufacturers in the biotechnological and scientific sectors, with an emphasis on advancements in TNF-α detection kits. Trends in the growing demand for research kits in medical research centers and universities are explored, along with developments in TNF-α related studies.

Key Segments of the Mouse TNF-α Kit Market

Purity

  • Purity ≥95%
  • Purity <95%

Application

  • Research Center
  • University

Region

  • Asia Pacific
    • China
    • Japan
    • South Korea
    • India
    • Australia & New Zealand
    • ASEAN
    • Rest of Asia Pacific
  • Europe
    • Germany
    • United Kingdom
    • France
    • Italy
    • Spain
    • Nordic
    • BENELUX
    • Rest of Europe
  • North America
    • United States
    • Canada
    • Mexico
  • Latin America
    • Brazil
    • Chile
    • Rest of Latin America
  • Middle East & Africa
    • Kingdom of Saudi Arabia
    • Other GCC Countries
    • Turkey
    • South Africa
    • Other African Union
    • Rest of Middle East & Africa

Frequently Asked Questions

How big is the Mouse TNF-α Kit Market in 2025?

The global Mouse TNF-α Kit Market is estimated to be valued at USD 135.0 million in 2025.

What will be the size of Mouse TNF-α Kit Market in 2035?

The market size for the Mouse TNF-α Kit Market is projected to reach USD 241.8 million by 2035.

How much will be the Mouse TNF-α Kit Market growth between 2025 and 2035?

The Mouse TNF-α Kit Market is expected to grow at a 6.0% CAGR between 2025 and 2035.

What are the key product types in the Mouse TNF-α Kit Market?

The key product types in Mouse TNF-α Kit Market are purity ≥95% and purity<95%.

Which application segment to contribute significant share in the Mouse TNF-α Kit Market in 2025?

In terms of application, research center segment to command 60.0% share in the Mouse TNF-α Kit Market in 2025.

Table of Content

  1. Executive Summary
    • Global Market Outlook
    • Demand to side Trends
    • Supply to side Trends
    • Technology Roadmap Analysis
    • Analysis and Recommendations
  2. Market Overview
    • Market Coverage / Taxonomy
    • Market Definition / Scope / Limitations
  3. Market Background
    • Market Dynamics
      • Drivers
      • Restraints
      • Opportunity
      • Trends
    • Scenario Forecast
      • Demand in Optimistic Scenario
      • Demand in Likely Scenario
      • Demand in Conservative Scenario
    • Opportunity Map Analysis
    • Product Life Cycle Analysis
    • Supply Chain Analysis
    • Investment Feasibility Matrix
    • Value Chain Analysis
    • PESTLE and Porter’s Analysis
    • Regulatory Landscape
    • Regional Parent Market Outlook
    • Production and Consumption Statistics
    • Import and Export Statistics
  4. Global Market Analysis 2020 to 2024 and Forecast, 2025 to 2035
    • Historical Market Size Value (USD Million) Analysis, 2020 to 2024
    • Current and Future Market Size Value (USD Million) Projections, 2025 to 2035
      • Y to o to Y Growth Trend Analysis
      • Absolute $ Opportunity Analysis
  5. Global Market Pricing Analysis 2020 to 2024 and Forecast 2025 to 2035
  6. Global Market Analysis 2020 to 2024 and Forecast 2025 to 2035, By Purity
    • Introduction / Key Findings
    • Historical Market Size Value (USD Million) Analysis By Purity , 2020 to 2024
    • Current and Future Market Size Value (USD Million) Analysis and Forecast By Purity , 2025 to 2035
      • Purity ≥95%
      • Purity<95%
    • Y to o to Y Growth Trend Analysis By Purity , 2020 to 2024
    • Absolute $ Opportunity Analysis By Purity , 2025 to 2035
  7. Global Market Analysis 2020 to 2024 and Forecast 2025 to 2035, By Application
    • Introduction / Key Findings
    • Historical Market Size Value (USD Million) Analysis By Application, 2020 to 2024
    • Current and Future Market Size Value (USD Million) Analysis and Forecast By Application, 2025 to 2035
      • Research Center
      • University
    • Y to o to Y Growth Trend Analysis By Application, 2020 to 2024
    • Absolute $ Opportunity Analysis By Application, 2025 to 2035
  8. Global Market Analysis 2020 to 2024 and Forecast 2025 to 2035, By Region
    • Introduction
    • Historical Market Size Value (USD Million) Analysis By Region, 2020 to 2024
    • Current Market Size Value (USD Million) Analysis and Forecast By Region, 2025 to 2035
      • North America
      • Latin America
      • Western Europe
      • Eastern Europe
      • East Asia
      • South Asia and Pacific
      • Middle East & Africa
    • Market Attractiveness Analysis By Region
  9. North America Market Analysis 2020 to 2024 and Forecast 2025 to 2035, By Country
    • Historical Market Size Value (USD Million) Trend Analysis By Market Taxonomy, 2020 to 2024
    • Market Size Value (USD Million) Forecast By Market Taxonomy, 2025 to 2035
      • By Country
        • USA
        • Canada
        • Mexico
      • By Purity
      • By Application
    • Market Attractiveness Analysis
      • By Country
      • By Purity
      • By Application
    • Key Takeaways
  10. Latin America Market Analysis 2020 to 2024 and Forecast 2025 to 2035, By Country
    • Historical Market Size Value (USD Million) Trend Analysis By Market Taxonomy, 2020 to 2024
    • Market Size Value (USD Million) Forecast By Market Taxonomy, 2025 to 2035
      • By Country
        • Brazil
        • Chile
        • Rest of Latin America
      • By Purity
      • By Application
    • Market Attractiveness Analysis
      • By Country
      • By Purity
      • By Application
    • Key Takeaways
  11. Western Europe Market Analysis 2020 to 2024 and Forecast 2025 to 2035, By Country
    • Historical Market Size Value (USD Million) Trend Analysis By Market Taxonomy, 2020 to 2024
    • Market Size Value (USD Million) Forecast By Market Taxonomy, 2025 to 2035
      • By Country
        • Germany
        • UK
        • Italy
        • Spain
        • France
        • Nordic
        • BENELUX
        • Rest of Western Europe
      • By Purity
      • By Application
    • Market Attractiveness Analysis
      • By Country
      • By Purity
      • By Application
    • Key Takeaways
  12. Eastern Europe Market Analysis 2020 to 2024 and Forecast 2025 to 2035, By Country
    • Historical Market Size Value (USD Million) Trend Analysis By Market Taxonomy, 2020 to 2024
    • Market Size Value (USD Million) Forecast By Market Taxonomy, 2025 to 2035
      • By Country
        • Russia
        • Poland
        • Hungary
        • Balkan & Baltic
        • Rest of Eastern Europe
      • By Purity
      • By Application
    • Market Attractiveness Analysis
      • By Country
      • By Purity
      • By Application
    • Key Takeaways
  13. East Asia Market Analysis 2020 to 2024 and Forecast 2025 to 2035, By Country
    • Historical Market Size Value (USD Million) Trend Analysis By Market Taxonomy, 2020 to 2024
    • Market Size Value (USD Million) Forecast By Market Taxonomy, 2025 to 2035
      • By Country
        • China
        • Japan
        • South Korea
      • By Purity
      • By Application
    • Market Attractiveness Analysis
      • By Country
      • By Purity
      • By Application
    • Key Takeaways
  14. South Asia and Pacific Market Analysis 2020 to 2024 and Forecast 2025 to 2035, By Country
    • Historical Market Size Value (USD Million) Trend Analysis By Market Taxonomy, 2020 to 2024
    • Market Size Value (USD Million) Forecast By Market Taxonomy, 2025 to 2035
      • By Country
        • India
        • ASEAN
        • Australia & New Zealand
        • Rest of South Asia and Pacific
      • By Purity
      • By Application
    • Market Attractiveness Analysis
      • By Country
      • By Purity
      • By Application
    • Key Takeaways
  15. Middle East & Africa Market Analysis 2020 to 2024 and Forecast 2025 to 2035, By Country
    • Historical Market Size Value (USD Million) Trend Analysis By Market Taxonomy, 2020 to 2024
    • Market Size Value (USD Million) Forecast By Market Taxonomy, 2025 to 2035
      • By Country
        • Kingdom of Saudi Arabia
        • Other GCC Countries
        • Turkiye
        • South Africa
        • Other African Union
        • Rest of Middle East & Africa
      • By Purity
      • By Application
    • Market Attractiveness Analysis
      • By Country
      • By Purity
      • By Application
    • Key Takeaways
  16. Key Countries Market Analysis
    • USA
      • Pricing Analysis
      • Market Share Analysis, 2024
        • By Purity
        • By Application
    • Canada
      • Pricing Analysis
      • Market Share Analysis, 2024
        • By Purity
        • By Application
    • Mexico
      • Pricing Analysis
      • Market Share Analysis, 2024
        • By Purity
        • By Application
    • Brazil
      • Pricing Analysis
      • Market Share Analysis, 2024
        • By Purity
        • By Application
    • Chile
      • Pricing Analysis
      • Market Share Analysis, 2024
        • By Purity
        • By Application
    • Germany
      • Pricing Analysis
      • Market Share Analysis, 2024
        • By Purity
        • By Application
    • UK
      • Pricing Analysis
      • Market Share Analysis, 2024
        • By Purity
        • By Application
    • Italy
      • Pricing Analysis
      • Market Share Analysis, 2024
        • By Purity
        • By Application
    • Spain
      • Pricing Analysis
      • Market Share Analysis, 2024
        • By Purity
        • By Application
    • France
      • Pricing Analysis
      • Market Share Analysis, 2024
        • By Purity
        • By Application
    • India
      • Pricing Analysis
      • Market Share Analysis, 2024
        • By Purity
        • By Application
    • ASEAN
      • Pricing Analysis
      • Market Share Analysis, 2024
        • By Purity
        • By Application
    • Australia & New Zealand
      • Pricing Analysis
      • Market Share Analysis, 2024
        • By Purity
        • By Application
    • China
      • Pricing Analysis
      • Market Share Analysis, 2024
        • By Purity
        • By Application
    • Japan
      • Pricing Analysis
      • Market Share Analysis, 2024
        • By Purity
        • By Application
    • South Korea
      • Pricing Analysis
      • Market Share Analysis, 2024
        • By Purity
        • By Application
    • Russia
      • Pricing Analysis
      • Market Share Analysis, 2024
        • By Purity
        • By Application
    • Poland
      • Pricing Analysis
      • Market Share Analysis, 2024
        • By Purity
        • By Application
    • Hungary
      • Pricing Analysis
      • Market Share Analysis, 2024
        • By Purity
        • By Application
    • Kingdom of Saudi Arabia
      • Pricing Analysis
      • Market Share Analysis, 2024
        • By Purity
        • By Application
    • Turkiye
      • Pricing Analysis
      • Market Share Analysis, 2024
        • By Purity
        • By Application
    • South Africa
      • Pricing Analysis
      • Market Share Analysis, 2024
        • By Purity
        • By Application
  17. Market Structure Analysis
    • Competition Dashboard
    • Competition Benchmarking
    • Market Share Analysis of Top Players
      • By Regional
      • By Purity
      • By Application
  18. Competition Analysis
    • Competition Deep Dive
      • Thermo Fisher Scientific Inc.
        • Overview
        • Product Portfolio
        • Profitability by Market Segments (Product/Age /Sales Channel/Region)
        • Sales Footprint
        • Strategy Overview
          • Marketing Strategy
          • Product Strategy
          • Channel Strategy
      • Bio-Techne
      • Scientists Helping Scientists
      • MilliporeSigma
      • FUJIFILM Irvine Scientific
      • BD Biosciences
      • Sino Biological,Inc.
      • BPS Bioscience, Inc.
      • Elabscience
      • Yisheng Biotechnology (Shanghai) Co., Ltd.
      • Abbkine
      • Beijing Biocreative Technology Co., Ltd.
      • Shanghai Yaji Biotechnology Co., Ltd.
      • Cellverse Co., Ltd.
      • Dalian Meilun Biotech Co., Ltd.
  19. Assumptions & Acronyms Used
  20. Research Methodology

List of Tables

  • Table 1: Global Market Value (USD Million) Forecast by Region, 2020 to 2035
  • Table 2: Global Market Value (USD Million) Forecast by Purity , 2020 to 2035
  • Table 3: Global Market Value (USD Million) Forecast by Application, 2020 to 2035
  • Table 4: North America Market Value (USD Million) Forecast by Country, 2020 to 2035
  • Table 5: North America Market Value (USD Million) Forecast by Purity , 2020 to 2035
  • Table 6: North America Market Value (USD Million) Forecast by Application, 2020 to 2035
  • Table 7: Latin America Market Value (USD Million) Forecast by Country, 2020 to 2035
  • Table 8: Latin America Market Value (USD Million) Forecast by Purity , 2020 to 2035
  • Table 9: Latin America Market Value (USD Million) Forecast by Application, 2020 to 2035
  • Table 10: Western Europe Market Value (USD Million) Forecast by Country, 2020 to 2035
  • Table 11: Western Europe Market Value (USD Million) Forecast by Purity , 2020 to 2035
  • Table 12: Western Europe Market Value (USD Million) Forecast by Application, 2020 to 2035
  • Table 13: Eastern Europe Market Value (USD Million) Forecast by Country, 2020 to 2035
  • Table 14: Eastern Europe Market Value (USD Million) Forecast by Purity , 2020 to 2035
  • Table 15: Eastern Europe Market Value (USD Million) Forecast by Application, 2020 to 2035
  • Table 16: East Asia Market Value (USD Million) Forecast by Country, 2020 to 2035
  • Table 17: East Asia Market Value (USD Million) Forecast by Purity , 2020 to 2035
  • Table 18: East Asia Market Value (USD Million) Forecast by Application, 2020 to 2035
  • Table 19: South Asia and Pacific Market Value (USD Million) Forecast by Country, 2020 to 2035
  • Table 20: South Asia and Pacific Market Value (USD Million) Forecast by Purity , 2020 to 2035
  • Table 21: South Asia and Pacific Market Value (USD Million) Forecast by Application, 2020 to 2035
  • Table 22: Middle East & Africa Market Value (USD Million) Forecast by Country, 2020 to 2035
  • Table 23: Middle East & Africa Market Value (USD Million) Forecast by Purity , 2020 to 2035
  • Table 24: Middle East & Africa Market Value (USD Million) Forecast by Application, 2020 to 2035

List of Figures

  • Figure 1: Global Market Pricing Analysis
  • Figure 2: Global Market Value (USD Million) Forecast 2020-2035
  • Figure 3: Global Market Value Share and BPS Analysis by Purity , 2025 and 2035
  • Figure 4: Global Market Y-o-Y Growth Comparison by Purity , 2025-2035
  • Figure 5: Global Market Attractiveness Analysis by Purity
  • Figure 6: Global Market Value Share and BPS Analysis by Application, 2025 and 2035
  • Figure 7: Global Market Y-o-Y Growth Comparison by Application, 2025-2035
  • Figure 8: Global Market Attractiveness Analysis by Application
  • Figure 9: Global Market Value (USD Million) Share and BPS Analysis by Region, 2025 and 2035
  • Figure 10: Global Market Y-o-Y Growth Comparison by Region, 2025-2035
  • Figure 11: Global Market Attractiveness Analysis by Region
  • Figure 12: North America Market Incremental Dollar Opportunity, 2025-2035
  • Figure 13: Latin America Market Incremental Dollar Opportunity, 2025-2035
  • Figure 14: Western Europe Market Incremental Dollar Opportunity, 2025-2035
  • Figure 15: Eastern Europe Market Incremental Dollar Opportunity, 2025-2035
  • Figure 16: East Asia Market Incremental Dollar Opportunity, 2025-2035
  • Figure 17: South Asia and Pacific Market Incremental Dollar Opportunity, 2025-2035
  • Figure 18: Middle East & Africa Market Incremental Dollar Opportunity, 2025-2035
  • Figure 19: North America Market Value Share and BPS Analysis by Country, 2025 and 2035
  • Figure 20: North America Market Value Share and BPS Analysis by Purity , 2025 and 2035
  • Figure 21: North America Market Y-o-Y Growth Comparison by Purity , 2025-2035
  • Figure 22: North America Market Attractiveness Analysis by Purity
  • Figure 23: North America Market Value Share and BPS Analysis by Application, 2025 and 2035
  • Figure 24: North America Market Y-o-Y Growth Comparison by Application, 2025-2035
  • Figure 25: North America Market Attractiveness Analysis by Application
  • Figure 26: Latin America Market Value Share and BPS Analysis by Country, 2025 and 2035
  • Figure 27: Latin America Market Value Share and BPS Analysis by Purity , 2025 and 2035
  • Figure 28: Latin America Market Y-o-Y Growth Comparison by Purity , 2025-2035
  • Figure 29: Latin America Market Attractiveness Analysis by Purity
  • Figure 30: Latin America Market Value Share and BPS Analysis by Application, 2025 and 2035
  • Figure 31: Latin America Market Y-o-Y Growth Comparison by Application, 2025-2035
  • Figure 32: Latin America Market Attractiveness Analysis by Application
  • Figure 33: Western Europe Market Value Share and BPS Analysis by Country, 2025 and 2035
  • Figure 34: Western Europe Market Value Share and BPS Analysis by Purity , 2025 and 2035
  • Figure 35: Western Europe Market Y-o-Y Growth Comparison by Purity , 2025-2035
  • Figure 36: Western Europe Market Attractiveness Analysis by Purity
  • Figure 37: Western Europe Market Value Share and BPS Analysis by Application, 2025 and 2035
  • Figure 38: Western Europe Market Y-o-Y Growth Comparison by Application, 2025-2035
  • Figure 39: Western Europe Market Attractiveness Analysis by Application
  • Figure 40: Eastern Europe Market Value Share and BPS Analysis by Country, 2025 and 2035
  • Figure 41: Eastern Europe Market Value Share and BPS Analysis by Purity , 2025 and 2035
  • Figure 42: Eastern Europe Market Y-o-Y Growth Comparison by Purity , 2025-2035
  • Figure 43: Eastern Europe Market Attractiveness Analysis by Purity
  • Figure 44: Eastern Europe Market Value Share and BPS Analysis by Application, 2025 and 2035
  • Figure 45: Eastern Europe Market Y-o-Y Growth Comparison by Application, 2025-2035
  • Figure 46: Eastern Europe Market Attractiveness Analysis by Application
  • Figure 47: East Asia Market Value Share and BPS Analysis by Country, 2025 and 2035
  • Figure 48: East Asia Market Value Share and BPS Analysis by Purity , 2025 and 2035
  • Figure 49: East Asia Market Y-o-Y Growth Comparison by Purity , 2025-2035
  • Figure 50: East Asia Market Attractiveness Analysis by Purity
  • Figure 51: East Asia Market Value Share and BPS Analysis by Application, 2025 and 2035
  • Figure 52: East Asia Market Y-o-Y Growth Comparison by Application, 2025-2035
  • Figure 53: East Asia Market Attractiveness Analysis by Application
  • Figure 54: South Asia and Pacific Market Value Share and BPS Analysis by Country, 2025 and 2035
  • Figure 55: South Asia and Pacific Market Value Share and BPS Analysis by Purity , 2025 and 2035
  • Figure 56: South Asia and Pacific Market Y-o-Y Growth Comparison by Purity , 2025-2035
  • Figure 57: South Asia and Pacific Market Attractiveness Analysis by Purity
  • Figure 58: South Asia and Pacific Market Value Share and BPS Analysis by Application, 2025 and 2035
  • Figure 59: South Asia and Pacific Market Y-o-Y Growth Comparison by Application, 2025-2035
  • Figure 60: South Asia and Pacific Market Attractiveness Analysis by Application
  • Figure 61: Middle East & Africa Market Value Share and BPS Analysis by Country, 2025 and 2035
  • Figure 62: Middle East & Africa Market Value Share and BPS Analysis by Purity , 2025 and 2035
  • Figure 63: Middle East & Africa Market Y-o-Y Growth Comparison by Purity , 2025-2035
  • Figure 64: Middle East & Africa Market Attractiveness Analysis by Purity
  • Figure 65: Middle East & Africa Market Value Share and BPS Analysis by Application, 2025 and 2035
  • Figure 66: Middle East & Africa Market Y-o-Y Growth Comparison by Application, 2025-2035
  • Figure 67: Middle East & Africa Market Attractiveness Analysis by Application
  • Figure 68: Global Market - Tier Structure Analysis
  • Figure 69: Global Market - Company Share Analysis
Dashboard
Dashboard
Dashboard
Dashboard
Dashboard
Dashboard

Our Research Products

Full Research Suite

The "Full Research Suite" delivers actionable market intel, deep dives on markets or technologies, so clients act faster, cut risk, and unlock growth.

Competitor Leaderboard Report

The Leaderboard benchmarks and ranks top vendors, classifying them as Established Leaders, Leading Challengers, or Disruptors & Challengers.

Future Leaders Index

Locates where complements amplify value and substitutes erode it, forecasting net impact by horizon

Market Data & Forecasts

We deliver granular, decision-grade intel: market sizing, 5-year forecasts, pricing, adoption, usage, revenue, and operational KPIs—plus competitor tracking, regulation, and value chains—across 60 countries broadly.

Market Focus Report

Spot the shifts before they hit your P&L. We track inflection points, adoption curves, pricing moves, and ecosystem plays to show where demand is heading, why it is changing, and what to do next across high-growth markets and disruptive tech

Survey Report

Real-time reads of user behavior. We track shifting priorities, perceptions of today’s and next-gen services, and provider experience, then pace how fast tech moves from trial to adoption, blending buyer, consumer, and channel inputs with social signals (#WhySwitch, #UX).

Bespoke Reports

Partner with our analyst team to build a custom report designed around your business priorities. From analysing market trends to assessing competitors or crafting bespoke datasets, we tailor insights to your needs.

Supplier Intelligence

Discovery & Profiling

Capacity & Footprint

Performance & Risk

Compliance & Governance

Commercial Readiness

Who Supplies Whom

Scorecards & Shortlists

Playbooks & Docs

Category Intelligence

Definition & Scope

Demand & Use Cases

Cost Drivers

Market Structure

Supply Chain Map

Trade & Policy

Operating Norms

Deliverables

Buyer Intelligence

Account Basics

Spend & Scope

Procurement Model

Vendor Requirements

Terms & Policies

Entry Strategy

Pain Points & Triggers

Outputs

Pricing Analysis

Benchmarks

Trends

Should-Cost

Indexation

Landed Cost

Commercial Terms

Deliverables

Brand Analysis

Positioning & Value Prop

Share & Presence

Customer Evidence

Go-to-Market

Digital & Reputation

Compliance & Trust

KPIs & Gaps

Outputs

Full Research Suite comprises of:

Market outlook & trends analysis

Market outlook & trends analysis

Interviews & case studies

Interviews & case studies

Strategic recommendations

Strategic recommendations

Vendor profiles & capabilities analysis

Vendor profiles & capabilities analysis

5-year forecasts

5-year forecasts

8 regions and 60+ country-level data splits

8 regions and 60+ country-level data splits

Market segment data splits

Market segment data splits

12 months of continuous data updates

12 months of continuous data updates

DELIVERED AS:

PDF EXCEL ONLINE

Full Research Suite


$5000

$7500

$10000

Buy Report Now
Similar Industry Reports

Similar Industry Reports

Mouse RNase Inhibitor Market

Mouse RNase Inhibitor Market Size and Share Forecast Outlook 2025 to 2035

Mouse Elevated Cross Maze Market

Mouse Elevated Cross Maze Market Size and Share Forecast Outlook 2025 to 2035

Mouse T Cell Isolation Kit Market

Mouse T Cell Isolation Kit Market Size and Share Forecast Outlook 2025 to 2035

Rat and Mouse Forced Swimming Test System Market

Rat and Mouse Forced Swimming Test System Market Size and Share Forecast Outlook 2025 to 2035

Wireless Mouse Market

Wireless Mouse Market

Humanized Mouse Model Market

Humanized Mouse Model Market Size and Share Forecast Outlook 2025 to 2035

FTNF Flavor Market
FTNF Flavor Market

FTNF Flavor Market Analysis By Type, Application, And Region - Growth, Trends, And Forecast From 2025 to 2035

Kitchen/ Toilet Roll Converting Machines Market

Kitchen/ Toilet Roll Converting Machines Market Size and Share Forecast Outlook 2025 to 2035

Kitting Robots Market

Kitting Robots Market Size and Share Forecast Outlook 2025 to 2035

Kitchen Tools and Accessories Market

Kitchen Tools and Accessories Market Size and Share Forecast Outlook 2025 to 2035

Kitchen Trailers Market

Kitchen Trailers Market Analysis - Size, Share, and Forecast Outlook 2025 to 2035

Kitchen Hood System Market

Kitchen Hood System Market Size and Share Forecast Outlook 2025 to 2035

Kitchen Hand Tools Market

Kitchen Hand Tools Market Size and Share Forecast Outlook 2025 to 2035

Kitchen Hood Market
Kitchen Hood Market

Kitchen Hood Market Insights – Trends & Growth Forecast 2025 to 2035

Kitchen Islands and Carts Market

Kitchen Islands and Carts Market

Kitchen Storage Market

Kitchen Storage Market

Kitchen & Dining Furniture Market

Kitchen & Dining Furniture Market

Kitten Milk Replacer & Formula Market

Kitten Milk Replacer & Formula Market

Hip Kits Market
Hip Kits Market

Hip Kits Market Size and Share Forecast Outlook 2025 to 2035

Toy Kitchens and Play Food Market

Toy Kitchens and Play Food Market Size and Share Forecast Outlook 2025 to 2035

Future Market Insights

Mouse TNF-α Kit Market

Chat With MaRIA

Chat With

MaRIA

Hi There, I am MaRIA, Your Market Research Intelligence Assistant. How may I help you?