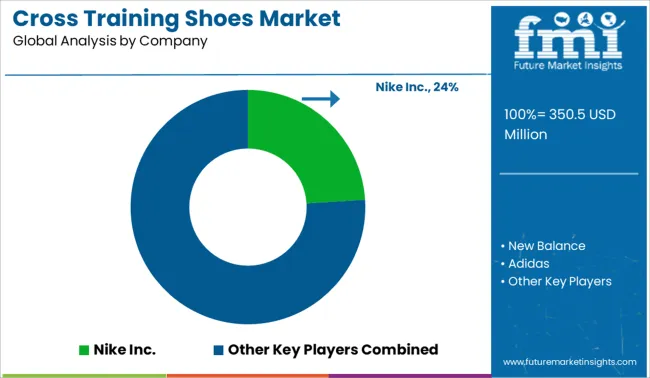
The Cross Training Shoes Market is estimated to be valued at USD 350.5 million in 2025 and is projected to reach USD 485.0 million by 2035, registering a compound annual growth rate (CAGR) of 3.3% over the forecast period.

| Metric | Value |
|---|---|
| Cross Training Shoes Market Estimated Value in (2025 E) | USD 350.5 million |
| Cross Training Shoes Market Forecast Value in (2035 F) | USD 485.0 million |
| Forecast CAGR (2025 to 2035) | 3.3% |
The Cross Training Shoes market is expanding steadily due to the increasing popularity of multi-functional athletic footwear that supports a variety of physical activities. Consumers are placing greater emphasis on comfort, durability, and performance, which is leading to a shift in design and material preferences by major footwear manufacturers. Influenced by fitness trends and the rising demand for hybrid workouts, cross training shoes are being designed with improved breathability, cushioning, and support for versatile training routines.
The market is also being shaped by growing consumer interest in gym culture, HIIT, and functional fitness. Product innovations focused on shock absorption, lateral stability, and lightweight performance are encouraging repeat purchases and brand loyalty.
Moreover, the increased adoption of athleisure in everyday wear is contributing to a wider customer base The future outlook remains optimistic, with sustainability and material innovation expected to create new opportunities for brands investing in advanced manufacturing processes and eco-conscious design.
The market is segmented by Closure Type, Outer Material, Sole Material, Consumer Orientation, and Sales Channel and region. By Closure Type, the market is divided into Lace Up, Elastic, Velcro, Slip-on, and Others. In terms of Outer Material, the market is classified into Mesh, Synthetic Material, Canvas, and Others. Based on Sole Material, the market is segmented into Rubber, Polyurethane, Resin, EVA, and Others. By Consumer Orientation, the market is divided into Men and Women. By Sales Channel, the market is segmented into Online Retailers, Multi-brand Stores, Independent Small Stores, and Other Sales Channel. Regionally, the market is classified into North America, Latin America, Western Europe, Eastern Europe, Balkan & Baltic Countries, Russia & Belarus, Central Asia, East Asia, South Asia & Pacific, and the Middle East & Africa.

The lace up segment is projected to hold 46.8% of the Cross Training Shoes market revenue share in 2025, making it the leading closure type. This preference has been driven by the secure fit and adjustable support provided by lace up systems, which are highly valued in dynamic and multi-directional training environments. Lace up closures are being chosen by consumers due to their adaptability to different foot shapes, which enhances stability and performance during workouts.
Product specifications and performance reviews have consistently highlighted the benefits of precise tension control, making this closure type suitable for high-intensity and strength-based activities. The dominance of this segment is also supported by its widespread usage across both premium and budget-friendly product lines.
Its compatibility with breathable uppers and customizable designs has reinforced its presence in fitness and athletic retail channels These features have contributed to the sustained popularity of lace up systems in the overall market.
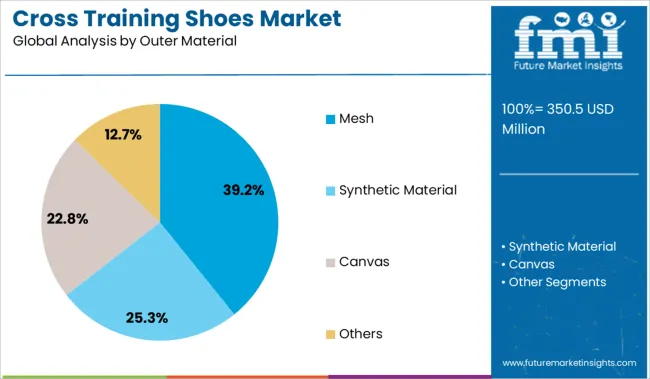
The mesh outer material segment is expected to account for 39.2% of the Cross Training Shoes market revenue share in 2025, making it the leading outer material segment. The segment's growth has been supported by its superior breathability, lightweight construction, and flexibility, which are critical for high-performance athletic footwear. Mesh uppers are being favored by both athletes and casual users for their ability to regulate temperature and reduce foot fatigue during intense sessions.
The material's adaptability to foot movement and ventilation efficiency has made it a preferred choice in cross training designs. Furthermore, footwear brands have been incorporating engineered mesh patterns to enhance durability without compromising comfort.
Mesh materials also allow for aesthetic innovation, which appeals to the fashion-forward athleisure market These combined benefits have positioned mesh as the most practical and performance-driven outer material in the cross training segment, sustaining its leading market share in 2025.
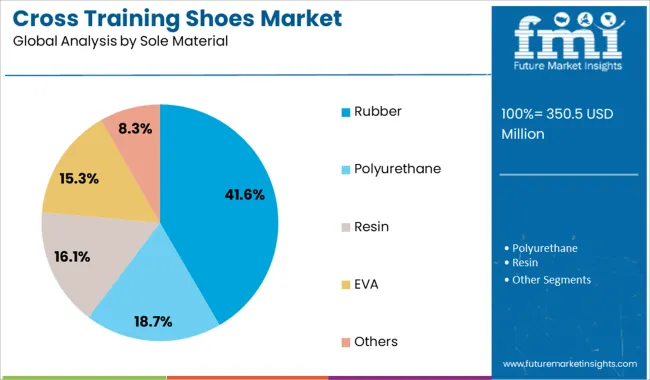
The rubber sole material segment is forecasted to hold 41.6% of the Cross Training Shoes market revenue share in 2025, retaining its lead in sole material preference. This is being attributed to the durability, grip, and shock absorption properties of rubber soles, which are essential in varied training environments. Rubber is being used extensively due to its traction on both indoor and outdoor surfaces, supporting agility and stability during high-impact workouts.
The segment’s dominance is also linked to advancements in rubber compounding techniques that improve flexibility and wear resistance. Consumers are increasingly valuing outsoles that deliver multi-surface performance, and rubber consistently meets these expectations across price points.
In addition, sustainability efforts have encouraged the use of recycled rubber blends, further driving adoption Its ability to integrate with performance-enhancing tread patterns has solidified rubber’s place as the preferred sole material in cross training footwear, supporting its continued leadership in the market.
Cross-training can be explained as different workouts that employ several training methods that are not related to the athlete's primary sport in order to enhance a specific fitness factor. Cross-training, which was popularised by runners, is now practiced by a variety of other athletes, including swimmers, triathletes, and cyclists to improve overall performance.
When the volume of sport-specific training is reduced, most athletes prioritize cross-training. The cross-training trend originated in 2000 when athletes started to include different exercises to negate the effect of just a single type of training. To cover the overall workout routine and train in off seasons, runners started to utilize cross-training in gyms, making the workout popular among gym freaks.
Cross-training is very popular in gyms and gym goers. These types of exercises are preferred by people who want to lose weight or athletes who train in their free time. Cross-training shoes are different from gym shoes, as they have to be high-performance and multifunctional for different types of workouts and activities included in cross-training. People are preferring cross-training shoes, as they are stylish, comfortable, and effective for proper and safe cross-training sessions.
People had to use any means possible to exercise at home during the pandemic. Citizens were forced to perform exercises in small rooms with no or minimal equipment and without professional supervision. People are returning to gyms and living a healthy lifestyle now that the lockdown and public gathering restrictions have been lifted.
People are becoming interested in cross-training because it promises an overall balanced workout routine that can focus on different parts of the body at the same time. As more people become aware of the importance of a healthy lifestyle and fitness, an increasing number of people are joining gyms and beginning to exercise, increasing the demand for gym equipment and clothing.
Athletes, primarily runners, cyclists, and swimmers, use a variety of cross-training exercises to improve overall strength and endurance. Athletes engage in weight lifting, cycling, rowing, and yoga because all of these exercises help athletes develop different physical qualities and increase endurance without actually participating in the sport.
Athletes do cross-training in gyms during the off-season to build and maintain endurance and work on different muscle groups, which can improve their performance. They use cross-training shoes while training to stay safe and keep up with different exercises and activities.
Manufacturers are providing different types of shoes to customers, with different styles and designs. The main aspect of the cross-training shoe is that they have to be comfortable and provide support while doing different exercises. Manufacturers are making shoes, flat-soled, highly cushioned, and with sturdy structures.
Additional features like lightweight and high traction grip are also included, as per the training requirements. Many brands are marketing their products with their special features are their main marketing strength. They tell customers how their product is best among the competition and attract them.
Bigger brands in the training shoe market primarily market their products through social media marketing and celebrity endorsement. These are the most effective ways to market these shoes because people frequently use social media and online entertainment platforms, and celebrities can influence their fan bases to purchase the products they are promoting. Bigger brands are often seen collaborating with each other to introduce a special shoe range, that is unique and limited.
Online marketplaces and official websites are also important platforms for marketing and selling. Manufacturers also provide special offers and discounts on purchases made through these platforms, as well as loyalty points and offer to retain customers.
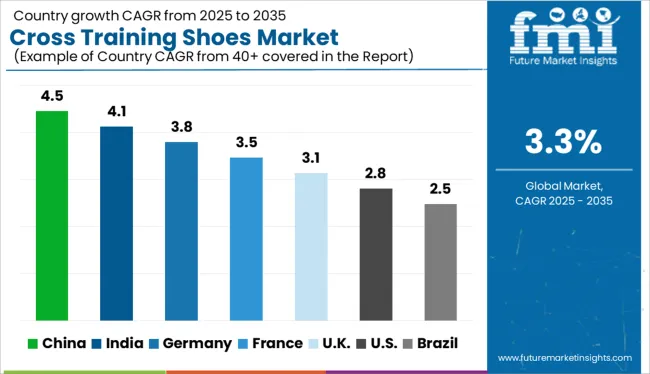
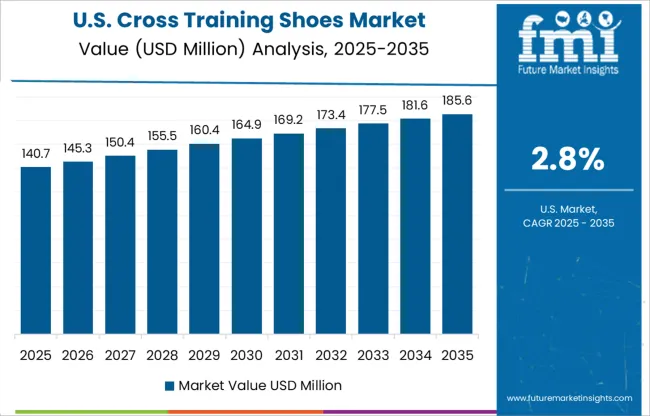
Increase of gym goers and overall fitness enthusiasm is helping the rise in sales.
People in the United States are becoming more concerned with their health and fitness. Because of the COVID pandemic and the newly formed lethargic and inactive lifestyle, many people have suffered chronic ailments and diseases such as diabetes and heart difficulties. Americans are joining gyms and adopting a healthier lifestyle.
Cross-fit training is growing in popularity in addition to traditional gym training. Cross-training consists of various workouts that serve to increase overall strength and focus on different muscle groups. All of these benefits of cross-training contributed to increased interest in, and ultimately sales of cross training shoes in America.
Multifunctional and beneficial cross-training is getting fitness freaks in the UK going.
Cross-fit training gained popularity in the UK, as it includes aerobics, intense exercises like HIIT, Weight lifting, and flexibility-enhancing training. As the population ready to change their lifestyle get to know this trend, many gyms started a special cross-training section and specialized gyms with only cross-training exercises with professional trainers. To keep up with different explosive and rapid exercises in the training routine, people are preferring cross-training shoes over normal gym shoes and training shoes.
Women in China are the main target of the cross-training gyms and shoes.
Cross-fit training is popular among Chinese ladies. Chinese people are particularly concerned with their health and appearance. Chinese people enjoy sports and prefer to live a healthy lifestyle. Women in China, on the other hand, keep themselves in shape, and cross-training is an excellent program for keeping different muscles slim and powerful.
Along with Reebok CrossFit opening MeWellness CrossFit gym in Shanghai, several new developing company developers are interested in opening cross fit training gyms. All of these variables are boosting cross-training shoe sales in the country.
Resin is commonly used by manufacturers for sole.
Manufacturers are using resin for making the sole of cross-training shoes. Manufacturers are utilizing resin for soles, as it is durable, lightweight, and has high elasticity. The resin soles are also having a strong grip and high shock-absorbing ability, making it an ideal material for different types of exercises included in cross-training.
Mesh is used for making cross-fit shoes.
Cross-training shoes are commonly made using mesh. Mesh is a synthetic material, which is porous and has high breathability as well as lightweight and flexible. Due to these positive qualities of mesh, manufacturers make cross-training shoes using mesh as outer material.
Shoes with elastic bands are commonly preferred by customers.
Elastic closure types of cross-training shoes are popular among customers. As cross-training shoes are used in gyms, they are required to be easy to put on and remove. Along with the convenience of putting on, elastic provides support and keeps the shoes fitting the foot. These factors are important for increasing the popularity of elastic closure type of cross-training shoes.
The cross-training shoes are specially designed so that they will absorb impacts while running, provide cushioning and a firm base while weight lifting, and stay comfortably fit on foot while working out.
For Instance:
Reebok Nano X1 from Reebok is one of the best cross-training shoes. This shoe is popular among users and also is top rated. The shoe has a special design that perfectly fits the foot and provides overall support, and has slightly elevated heels, which are necessary for weight lifting.
| Attribute | Details |
|---|---|
| Forecast Period | 2025 to 2035 |
| Historical Data Available for | 2020 to 2024 |
| Market Analysis | USD Million for Value |
| Key Regions Covered | North America; Latin America; Europe; East Asia; South Asia; Oceania & MEA |
| Key Countries Covered | United States, Canada, Brazil, Mexico, Germany, the UK, France, Spain, Italy, Russia, South Africa, Northern Africa GCC Countries, China, Japan, South Korea, India, Thailand, Malaysia, Indonesia, Australia & New Zealand. |
| Key Segments Covered | Product Type, Closure Type, Outer Material, Sole Material, Consumer Orientation, Sales Channel, and Region. |
| Key Companies Profiled |
Nike Inc.; New Balance; Adidas; ASICS; Skechers; Reebok; ON; HOKA; PUMA SE; Under Armour, Inc.; GeoX S. p. A; Crocs; Vans; Converse; Wolverine; Others |
| Report Coverage | Market Forecast, Company Share Analysis, Competition Intelligence, DROT Analysis, Market Dynamics and Challenges, and Strategic Growth Initiatives |
| Customization & Pricing | Available upon Request |
The global cross training shoes market is estimated to be valued at USD 350.5 million in 2025.
The market size for the cross training shoes market is projected to reach USD 485.0 million by 2035.
The cross training shoes market is expected to grow at a 3.3% CAGR between 2025 and 2035.
The key product types in cross training shoes market are lace up, elastic, velcro, slip-on and others.
In terms of outer material, mesh segment to command 39.2% share in the cross training shoes market in 2025.


Our Research Products

The "Full Research Suite" delivers actionable market intel, deep dives on markets or technologies, so clients act faster, cut risk, and unlock growth.

The Leaderboard benchmarks and ranks top vendors, classifying them as Established Leaders, Leading Challengers, or Disruptors & Challengers.

Locates where complements amplify value and substitutes erode it, forecasting net impact by horizon

We deliver granular, decision-grade intel: market sizing, 5-year forecasts, pricing, adoption, usage, revenue, and operational KPIs—plus competitor tracking, regulation, and value chains—across 60 countries broadly.

Spot the shifts before they hit your P&L. We track inflection points, adoption curves, pricing moves, and ecosystem plays to show where demand is heading, why it is changing, and what to do next across high-growth markets and disruptive tech

Real-time reads of user behavior. We track shifting priorities, perceptions of today’s and next-gen services, and provider experience, then pace how fast tech moves from trial to adoption, blending buyer, consumer, and channel inputs with social signals (#WhySwitch, #UX).

Partner with our analyst team to build a custom report designed around your business priorities. From analysing market trends to assessing competitors or crafting bespoke datasets, we tailor insights to your needs.
Supplier Intelligence
Discovery & Profiling
Capacity & Footprint
Performance & Risk
Compliance & Governance
Commercial Readiness
Who Supplies Whom
Scorecards & Shortlists
Playbooks & Docs
Category Intelligence
Definition & Scope
Demand & Use Cases
Cost Drivers
Market Structure
Supply Chain Map
Trade & Policy
Operating Norms
Deliverables
Buyer Intelligence
Account Basics
Spend & Scope
Procurement Model
Vendor Requirements
Terms & Policies
Entry Strategy
Pain Points & Triggers
Outputs
Pricing Analysis
Benchmarks
Trends
Should-Cost
Indexation
Landed Cost
Commercial Terms
Deliverables
Brand Analysis
Positioning & Value Prop
Share & Presence
Customer Evidence
Go-to-Market
Digital & Reputation
Compliance & Trust
KPIs & Gaps
Outputs
Full Research Suite comprises of:
Market outlook & trends analysis
Interviews & case studies
Strategic recommendations
Vendor profiles & capabilities analysis
5-year forecasts
8 regions and 60+ country-level data splits
Market segment data splits
12 months of continuous data updates
DELIVERED AS:
PDF EXCEL ONLINE
Training Shoes Market Analysis - Size, Trends & Forecast 2025 to 2035
Cross-chain NFT Market Size and Share Forecast Outlook 2025 to 2035
Cross-species Organ Transplantation Market Forecast and Outlook 2025 to 2035
Cross Interconnection Protection Box Market Size and Share Forecast Outlook 2025 to 2035
Cross Corner Industrial Bags Market Size and Share Forecast Outlook 2025 to 2035
Cross-Linked Polyethylene Market Size and Share Forecast Outlook 2025 to 2035
Cross-Border Road Transport Market Size and Share Forecast Outlook 2025 to 2035
Crossfit Apparel Market Size and Share Forecast Outlook 2025 to 2035
Cross Point Switch Market Size and Share Forecast Outlook 2025 to 2035
Cross Pein Hammer Market Size and Share Forecast Outlook 2025 to 2035
Crossover Market Size and Share Forecast Outlook 2025 to 2035
Cross-Cloud Analytics Market Insights - Growth & Forecast 2025 to 2035
Cross-Belt Sorters Market
Cross-linked Shrink Films Market
Cross-Platform & Mobile Advertising Market Report – Growth 2018-2028
Cross Laminated Timber Market
Crosslinking Agents Market
Dog Training Equipment Market Size and Share Forecast Outlook 2025 to 2035
Gym Shoes Market Size and Share Forecast Outlook 2025 to 2035
Motocross Gears Market Outlook – Size, Share & Innovations 2025–2035

Thank you!
You will receive an email from our Business Development Manager. Please be sure to check your SPAM/JUNK folder too.
Chat With
MaRIA