Weight Training Market Size and Share Forecast Outlook 2025 to 2035

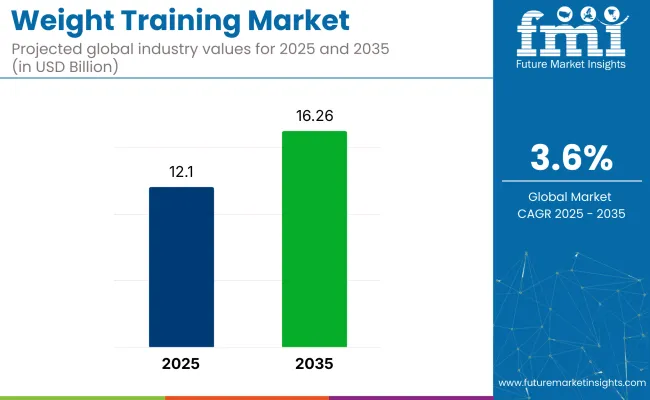
The global weight training market is forecasted to increase from USD 12.1 billion in 2025 to USD 16.26 billion by 2035, with a CAGR of 3.6%. This growth is being supported by rising awareness of physical well-being, expanded fitness participation across all age groups, and the growing integration of resistance-based workouts into daily routines.
Quick Stats of the Weight Training Market

  • Industry Value (2025): USD 12.1 billion
  • Industry Forecast Value (2035): USD 16.26 billion
  • Global CAGR: 3.6%
  • Leading Segment in 2025: Free Weights (38% share)
  • Key Growth Regions: Asia Pacific (India with CAGR of 6.5%)
  • Key Players: Life Fitness (Hammer Strength), Technogym S.p.A, Rogue Fitness, Precor, Cybex,

Weight Training Market

Attribute Value
Industry Value (2025) USD 12.1 billion
Industry Value (2035) USD 16.26 billion
CAGR (2025 to 2035) 3.6%

Strength, resistance, and bodybuilding regimens are being incorporated to improve bone density, metabolic efficiency, and injury prevention. Commercial and home-based training setups are being expanded as fitness continues to be prioritized, with demand rising for versatile and durable weight equipment.

A June 2025 study published in JAMA Network Open by Wake Forest University and its School of Medicine evaluated whether resistance training or weighted vest use could prevent bone loss in older adults during intentional weight reduction. Across all three groups, weight loss alone, weight loss plus vest, and weight loss plus resistance training, similar hip bone mineral density declines were observed despite effective weight loss (9%-11.2% body weight).

The weighted vest group wore vests for 7.1 hours daily, replacing 78% of lost weight, while the resistance training group attended 71% of sessions. “While we hoped that replacing lost weight externally or increasing mechanical loading through exercise would preserve bone, our findings show that these strategies alone may not be enough,” said Kristen M. Beavers.

The weight training industry accounts for 45-50% of the fitness equipment sector, driven by barbells, dumbbells, and resistance machines. Within health and wellness, it represents 6-8%, linked to rehabilitation and preventive care. In sports and performance nutrition, 10-12% of product demand stems from strength-focused regimens.

The home fitness and gym segment attributes 35-40% of its value to strength systems and adjustable equipment. In recreational and professional sports, weight training holds a 15% share, shaped by athlete conditioning programs. These varied contributions reflect the integration of strength training across equipment, nutrition, personal wellness, and athletic performance categories

Analyzing Weight Training Market by Top Investment Segments

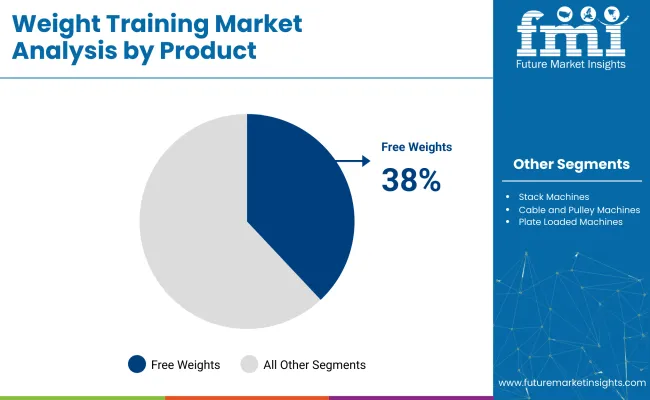
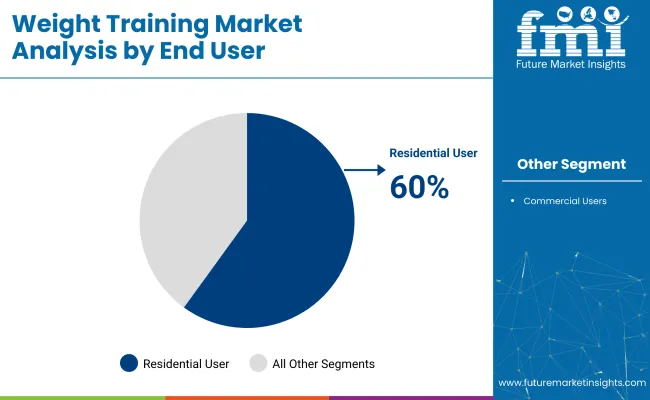
The market advanced steadily in 2025. Free weights held a 38% share, reflecting their broad utility and durability. Residential users dominated with a 60% share, supported by space-efficient home setups. The economic price range led with a 45% share in 2025. Online retail contributed 34%, driven by logistics, digital discovery, and post-sale service.
Free Weights Extend Reach Across Functional Strength Formats

Weight Training Market By Product

Free weights were identified as the top contributor to product-level share in 2025, accounting for 38% of total category value. Their inclusion in rehabilitation, functional fitness, and strength protocols enabled broad deployment across training tiers. Iron casting and rubber coatings were optimized in offshore facilities to stabilize supply.

Adjustable kits bundled with virtual tutorials were positioned for first-time users focused on safe load progression. Brands such as Rogue Fitness and CAP Barbell were instrumental in scaling availability across both home and institutional sector.
  • Promoted dumbbell sets were placed at the top of fitness campaign search trends in late 2024.
  • Olympic bar configurations were adopted as the replacement standard across major gym chains.
  • Compact smart racks with built-in storage were introduced to meet urban user constraints.

Home-Based Routines Reinforce Demand for Residential Equipment

Weight Training Market By End User

The residential segment was awarded a 60% share in 2025, following the persistence of home-based routines post-pandemic. Foldable benches, compact racks, and app-connected dumbbells were selected for their compatibility with limited-space layouts. Engagement was maintained through coaching platforms that delivered load-tracking features.

Setup complexity was reduced via modular packaging and digital guides, catering to renters and small-home owners. Smart equipment was promoted by Tonal and ProForm, both of which offered digital interfaces integrated with home fitness ecosystems.

  • Delivery volumes were elevated in second- and third-tier cities amid increasing household penetration.
  • Equipment bundles were paired with video workout programs to encourage ongoing use.
  • QR-linked setup support was credited for lowering return rates across entry-level kits.

Economic Price Range Segment Leads the Market

The economic price range is expected to dominate the market, holding a 45% share in 2025, with demand anchored in budget-sensitive purchasing. Standardized plates and welded dumbbells were produced using batch-run molds, enabling lower costs.

New Year promotional cycles and trade-in resale programs extended product reach among price-conscious buyers. Cost-to-durability ratios remained favorable, reinforcing entry-point adoption for new lifters. Brands such as Weider and Marcy led volume sales through discount chains and general e-commerce portals.

  • Bargain kits generated high sales volumes during seasonal flash events and bundle campaigns.
  • Strength equipment was procured by schools and municipal centers through capped budget allocations.
  • Stocking cycles were streamlined via automated reorder systems triggered by local purchasing trends.

Online Channels Leverage Logistics and Discovery Tools

Online retail was credited with 34% of market distribution in 2025, aided by rapid freight coordination and digital purchase journeys. Fulfillment timelines were shortened through metro-adjacent warehousing for high-weight SKUs. Augmented reality, side-by-side comparisons, and embedded influencer content were deployed to compress the decision window.

Post-sale processes were digitized, including label-free returns and modular part replacements. Platforms operated by Amazon and Dick’s Sporting Goods played central roles in enabling category visibility, same-day shipping, and high-volume fulfillment.

  • Floor-space simulation tools were implemented to help users pre-visualize equipment before checkout.
  • Loyalty schemes integrated fast shipping with exclusive accessory incentives for repeat buyers.
  • Last-mile delivery charges in remote zones were absorbed to preserve customer conversion rates.

Top Weight Training Market Dynamics

The industry is undergoing a structural shift as commercial gyms streamline inventory and residential users drive demand for low-cost, space-efficient products. Distribution models are being recalibrated, with digital bundling and financing incentives helping align cost control with consumer behavior across economic segments and global fitness hubs.

Inventory Optimization Alters Commercial Gym Equipment Cycles

Ownership models were replaced by leasing structures across commercial gyms in East Asia and the Middle East. Excess machines were liquidated via resale platforms, and build cycles were shortened by OEMs. Preference was given to configurable stations, and space planning was redesigned for efficiency. Inventory turnover was improved by 27% in Q2 2025 through procurement tightening and rationalization of facility layouts.

  • Bulk equipment purchases were replaced by leasing terms across urban fitness chains.
  • Underused strength machines were liquidated through resale hubs within franchise networks.
  • Layout priorities were shifted toward multi-functional racks and modular stations over single-use units.

Value-Tier Home Equipment Gains Share in Volume-Led Retail

Traction was gained by economic-tier weight sets under USD 250, particularly among first-time users in space-limited settings. Exports were scaled by Indian and Vietnamese manufacturers for Amazon, Flipkart, and Walmart. Adoption was strengthened by compact product formats, and bundled sessions were included to improve usage. Return rates were lowered, and cost-to-serve was optimized through streamlined fulfillment networks.
  • Volume in the sub-USD 250 category was led by vinyl dumbbells and foldable benches.
  • Return rates across North America were reduced through reinforced packaging and simplified guides.
  • Cart size and session completion rates were increased by integrating interactive workout add-ons.

Analyzing Top Countries Manufacturing, Distributing, and Supplying Weight Training Equipment

Country Wise Analysis Of Weight Training Market

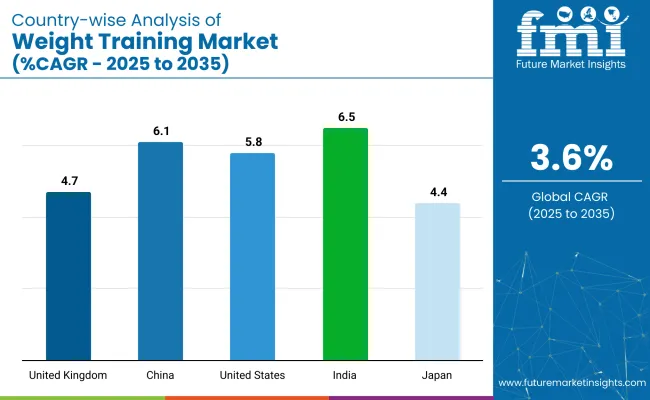
The report covers detailed analysis of 40+ countries and the top five countries have been shared as a reference.

Countries CAGR (2025 to 2035)
India 6.5%
China 6.1%
United States 5.8%
United Kingdom 4.7%
Japan 4.4%

Global weight training equipment demand is forecast to rise at a 3.6% CAGR between 2025 and 2035. Among the five highlighted countries, India (BRICS) leads with 6.5%, followed by China (BRICS) at 6.1%, and the United States (OECD) at 5.8%. The United Kingdom (OECD) and Japan (OECD, East Asia) trail at 4.7% and 4.4%, respectively.

These growth rates represent a premium of +81% for India, +69% for China, and +61% for the United States over the global baseline; the United Kingdom and Japan maintain modest uplifts of +31% and +22%. Divergence reflects mass-market financing in India, franchising scale in China, home-use innovation in the USA, refurbishment cycles in the UK, and compact-equipment demand in Japan.

Weight Training Market Growth Outlook in India

Demand for weight training equipment is expected to grow at a 6.5% CAGR through 2035. Sales have been concentrated in medium-density urban clusters, where EMI-financed orders have been processed in offline and digital retail formats. Assembly operations based in southern India have been used to support last-mile fulfillment.

Compact benches, resistance kits, and vinyl dumbbells have been stocked widely across chain outlets. Influencer-curated bundles have been included in app-based storefronts. Repeat orders have been observed in core metros and regional towns. Entry-level kits have been sold with app trials and guidebooks for improved onboarding. Equipment resale platforms have been used to lower ownership barriers.

  • EMI-financed orders contributed to over 40% of branded equipment volume
  • Fulfillment was handled through domestic hubs near Coimbatore and Bengaluru
  • App-linked starter kits gained traction in western and southern states

Demand Forecast for Weight Training Market in China

Requirement for weight training equipment in China is expected to expand at a 6.1% CAGR from 2025 to 2035. Franchise-led gym openings in secondary inland zones have supported procurement of stack machines and selectorized benches. Direct orders have been routed through integrated logistics on national e-commerce platforms. Live stream campaigns and short-video promotions have been deployed to drive home-use demand. Compact, multi-function designs have been prioritized for apartment-based fitness routines.

Public-use outdoor fitness zones have been equipped under regional infrastructure programs. Low-friction restocking cycles have been enabled by nearby warehouse nodes, allowing agile delivery and reduced downtime. Bundled SKUs have included QR-linked tutorials in Mandarin and Cantonese.

  • Secondary cities recorded a 24% rise in equipment order volume
  • Live stream sales converted first-time buyers in home-fitness categories
  • Localized tutorials were embedded in kits shipped via JD and Douyin

Growth Analysis of Weight Training Market in the United States

Sale of weight training equipment in the United Statesis anticipated to register a 5.8% CAGR from 2025 to 2035. Connected machines with smart functionality have been distributed through specialty retailers and e-commerce formats. Leasing has been adopted across commercial gyms to reduce upfront costs.

Institutional procurement has been processed for fire departments, high schools, and government-run facilities. Repeat usage has been strengthened by instructional content embedded in kits. Branded app subscriptions have been offered with bundled purchases.

High-value SKUs have been fulfilled through regional logistics partnerships. Refurbished commercial units have been deployed in university athletic centers and community gyms. Equipment returns have declined following improved shipping durability.

  • 18% of residential buyers selected smart-connected training machines
  • Institutional orders rose in state-funded fitness and rehabilitation centers
  • Subscription-linked models improved engagement across power-user segments

Future Outlook for Weight Market in the United Kingdom

The weight training equipment industry in the UK is set to grow at a 4.7% CAGR through 2035. Foldable racks and compact benches have been adopted in apartments and terrace homes. In-store and digital financing programs have supported purchases among first-time users. Budget fitness centers and shared-use facilities have deployed refurbished commercial machines to manage investment risk.

Configurable home setups have been supported through flat-pack delivery and simplified installation. Modular kits have been promoted with digital guides. Space-adapted products have been selected to accommodate multi generational households. Local delivery timelines have been shortened through warehouse zoning in London, Manchester, and Birmingham.

  • Foldable racks accounted for over 60% of home-installation inventory
  • Public and semi-private gyms sourced refurbished stack machines at 16% higher volume
  • Product bundling with virtual training modules supported online cart conversions

Weight Training Market Expansion Trends in Japan

The adoption of weight training equipment in Japanis projected to expand at a 4.4% CAGR through 2035. Compact and lightweight equipment has been selected for residential use in high-density zones. Low-resistance devices have been installed in care homes and rehabilitation clinics. Domestic suppliers have delivered kits below 25 kg to meet mobility, sound, and size requirements.

Usage tracking has been integrated into select models for physiotherapy support. Vertical-storage machines have been installed in public wellness zones. Retailers have offered foldable designs to households without dedicated gym space. Deliveries have been optimized through inventory held at logistics nodes near Tokyo, Nagoya, and Osaka.

  • Sound-controlled units dominated orders in senior-care and urban housing
  • Foldable equipment was prioritized in residential complexes with no spare rooms
  • In-home usage increased for resistance kits under 25 kg from local brands

Leading Weight Training Market Suppliers

Weight Training Market By Company

Dominant players such as Life Fitness, Technogym, and Rogue Fitness lead the category through commercial strength systems, Olympic facility partnerships, and free-weight manufacturing. Life Fitness, through its Hammer Strength line, retained strong institutional presence across North America, while Technogym emphasized design-led, connected solutions.

Rogue Fitness maintained free-weight leadership via USA-based production. Key players including Precor, Cybex, and Nautilus focused on multifunction setups for commercial gyms and public installations. Emerging brands such as Eleiko and Decathlon extended reach through competition-grade plates and mass-retail distribution, expanding access and use across both elite and entry-level markets.

Recent Industry News

  • In July 2025, Axios reported a surge in the adoption of weighted vests, particularly among older women. Once limited to military use, the rucking trend-walking with weighted backpacks or vests-has become a mainstream fitness method. Sales grew over 50%, reaching USD 27 million through May 2025 (Axios, July 2, 2025).
  • A Wall Street Journal article published on June 26, 2025, noted that weighted vests are increasingly being used by middle-aged consumers to enhance calorie burn and endurance. When worn at 10-30% of body weight, three times per week, they raise energy expenditure by up to 32.2% (Wall Street Journal, June 26, 2025).

Leading Players in the Weight Training Market

  • Life Fitness (Hammer Strength)
  • Technogym S.p.A (Wellness Holding Srl)
  • Rogue Fitness
  • Precor (Amer Sports)
  • Cybex International Inc. (Brunswick Corporation)
  • Nautilus Inc.
  • Eleiko
  • Decathlon
  • Powertec
  • ICON Health and Fitness Inc. (IHF Holdings Inc.)
  • American Barbell Gym Equipment

Research Coverage and Scope Summary

Report Attributes Details
Industry Size (2025) USD 12.1 billion
Projected Industry Size (2035) USD 16.26 billion
CAGR (2025 to 2035) 3.6%
Base Year for Estimation 2024
Historical Period 2020 to 2024
Projections Period 2025 to 2035
Quantitative Units USD billion for value and million units for volume
Products Analyzed (Segment 1) Free Weights, Stack Machines, Cable and Pulley Machines, Plate Loaded Machines
End Users Analyzed (Segment 2) Residential Users, Commercial Users
Price Ranges Analyzed (Segment 3) Economic, Mid-Range, Premium
Distribution Channels Analyzed (Segment 4) Direct Sales, Mono-Brand Stores, Convenient Stores, Specialty Stores, Online Retail Store
Regions Covered North America, Latin America, Europe, East Asia, South Asia, Oceania, Middle East & Africa
Countries Covered United States, Canada, Brazil, Germany, United Kingdom, France, Italy, Spain, China, India, Japan, South Korea, Australia, UAE, Saudi Arabia, South Africa
Key Players Life Fitness (Hammer Strength), Technogym S.p.A (Wellness Holding Srl), Rogue Fitness, Precor (Amer Sports), Cybex International Inc. (Brunswick Corporation), Nautilus Inc., Eleiko, Decathlon, Powertec, ICON Health and Fitness Inc. (IHF Holdings Inc.), American Barbell Gym Equipment
Additional Attributes Dollar sales, share by equipment type and end user, increasing residential adoption of compact weight training machines, rising commercial upgrades to stack and plate-loaded systems, e-commerce trends for fitness equipment distribution

Key Segments

By Product:

The segmentation includes free weights, stack machines, cable and pulley machines, and plate loaded machines.

By End User:

The segmentation includes residential users and commercial users.

By Price Range:

The segmentation includes economic, mid-range, and premium.

By Distribution Channel:

The segmentation includes direct sales, mono-brand stores, convenient stores, specialty stores, and online retail store.

By Region:

The segmentation includes North America, Latin America, Europe, East Asia, South Asia, Oceania, and Middle East and Africa.

Table of Content

  1. Executive Summary
    • Global Market Outlook
    • Demand-side Trends
    • Supply-side Trends
    • Technology Roadmap Analysis
    • Analysis and Recommendations
  2. Market Overview
    • Market Coverage/Taxonomy
    • Market Definition/Scope/Limitations
  3. Market Background
    • Market Dynamics
      • Drivers
      • Restraints
      • Opportunity
      • Trends
    • Scenario Forecast
      • Demand in Optimistic Scenario
      • Demand in Likely Scenario
      • Demand in Conservative Scenario
    • Opportunity Map Analysis
    • Product Life Cycle Analysis
    • Supply Chain Analysis
      • Supply Side Participants and their Roles
        • Producers
        • Mid-Level Participants (Traders/ Agents/ Brokers)
        • Wholesalers and Distributors
      • Value Added and Value Created at Node in the Supply Chain
      • List of Raw Material Suppliers
      • List of Existing and Potential Buyer’s
    • Investment Feasibility Matrix
    • Value Chain Analysis
      • Profit Margin Analysis
      • Wholesalers and Distributors
      • Retailers
    • PESTLE and Porter’s Analysis
    • Regulatory Landscape
      • By Key Regions
      • By Key Countries
    • Regional Parent Market Outlook
    • Production and Consumption Statistics
    • Import and Export Statistics
  4. Global Market Analysis 2020 to 2024 and Forecast, 2025 to 2035
    • Historical Market Size Value (USD Billion) & Volume (Million Units) Analysis, 2020 to 2024
    • Current and Future Market Size Value (USD Billion) & Volume (Million Units) Projections, 2025 to 2035
      • Y-o-Y Growth Trend Analysis
      • Absolute $ Opportunity Analysis
  5. Global Market Pricing Analysis 2020 to 2024 and Forecast 2025 to 2035
  6. Global Market Analysis 2020 to 2024 and Forecast 2025 to 2035, By Product
    • Introduction/Key Findings
    • Historical Market Size Value (USD Billion) & Volume (Million Units) Analysis By Product, 2020 to 2024
    • Current and Future Market Size Value (USD Billion) & Volume (Million Units) Analysis and Forecast By Product, 2025 to 2035
      • Free weights
      • Stack machines
      • Cable and Pulley Machines
      • Plate Loaded Machines
    • Y-o-Y Growth Trend Analysis By Product, 2020 to 2024
    • Absolute $ Opportunity Analysis By Product, 2025 to 2035
  7. Global Market Analysis 2020 to 2024 and Forecast 2025 to 2035, By End User
    • Introduction/Key Findings
    • Historical Market Size Value (USD Billion) & Volume (Million Units) Analysis By End User, 2020 to 2024
    • Current and Future Market Size Value (USD Billion) & Volume (Million Units) Analysis and Forecast By End User, 2025 to 2035
      • Residential Users
      • Commercial Users
    • Y-o-Y Growth Trend Analysis By End User, 2020 to 2024
    • Absolute $ Opportunity Analysis By End User, 2025 to 2035
  8. Global Market Analysis 2020 to 2024 and Forecast 2025 to 2035, By Price Range
    • Introduction/Key Findings
    • Historical Market Size Value (USD Billion) & Volume (Million Units) Analysis By Price Range, 2020 to 2024
    • Current and Future Market Size Value (USD Billion) & Volume (Million Units) Analysis and Forecast By Price Range, 2025 to 2035
      • Economic
      • Mid-range
      • Premium
    • Y-o-Y Growth Trend Analysis By Price Range, 2020 to 2024
    • Absolute $ Opportunity Analysis By Price Range, 2025 to 2035
  9. Global Market Analysis 2020 to 2024 and Forecast 2025 to 2035, By Distribution Channel
    • Introduction/Key Findings
    • Historical Market Size Value (USD Billion) & Volume (Million Units) Analysis By Distribution Channel, 2020 to 2024
    • Current and Future Market Size Value (USD Billion) & Volume (Million Units) Analysis and Forecast By Distribution Channel, 2025 to 2035
      • Direct sales
      • Mono-brand Stores
      • Convenient Stores
      • Specialty Stores
      • Online Retail Store
    • Y-o-Y Growth Trend Analysis By Distribution Channel, 2020 to 2024
    • Absolute $ Opportunity Analysis By Distribution Channel, 2025 to 2035
  10. Global Market Analysis 2020 to 2024 and Forecast 2025 to 2035, By Region
    • Introduction
    • Historical Market Size Value (USD Billion) & Volume (Million Units) Analysis By Region, 2020 to 2024
    • Current Market Size Value (USD Billion) & Volume (Million Units) Analysis and Forecast By Region, 2025 to 2035
      • North America
      • Latin America
      • Western Europe
      • Eastern Europe
      • East Asia
      • South Asia & Pacific
      • Middle East and Africa
    • Market Attractiveness Analysis By Region
  11. North America Market Analysis 2020 to 2024 and Forecast 2025 to 2035, By Country
    • Historical Market Size Value (USD Billion) & Volume (Million Units) Trend Analysis By Market Taxonomy, 2020 to 2024
    • Market Size Value (USD Billion) & Volume (Million Units) Forecast By Market Taxonomy, 2025 to 2035
      • By Country
        • USA
        • Canada
        • Mexico
      • By Product
      • By End User
      • By Price Range
      • By Distribution Channel
    • Market Attractiveness Analysis
      • By Country
      • By Product
      • By End User
      • By Price Range
      • By Distribution Channel
    • Key Takeaways
  12. Latin America Market Analysis 2020 to 2024 and Forecast 2025 to 2035, By Country
    • Historical Market Size Value (USD Billion) & Volume (Million Units) Trend Analysis By Market Taxonomy, 2020 to 2024
    • Market Size Value (USD Billion) & Volume (Million Units) Forecast By Market Taxonomy, 2025 to 2035
      • By Country
        • Brazil
        • Argentina
        • Rest of LATAM
      • By Product
      • By End User
      • By Price Range
      • By Distribution Channel
    • Market Attractiveness Analysis
      • By Country
      • By Product
      • By End User
      • By Price Range
      • By Distribution Channel
    • Key Takeaways
  13. Western Europe Market Analysis 2020 to 2024 and Forecast 2025 to 2035, By Country
    • Historical Market Size Value (USD Billion) & Volume (Million Units) Trend Analysis By Market Taxonomy, 2020 to 2024
    • Market Size Value (USD Billion) & Volume (Million Units) Forecast By Market Taxonomy, 2025 to 2035
      • By Country
        • Germany
        • Italy
        • France
        • UK
        • Spain
        • BENELUX
        • Nordic
        • Rest of W.Europe
      • By Product
      • By End User
      • By Price Range
      • By Distribution Channel
    • Market Attractiveness Analysis
      • By Country
      • By Product
      • By End User
      • By Price Range
      • By Distribution Channel
    • Key Takeaways
  14. Eastern Europe Market Analysis 2020 to 2024 and Forecast 2025 to 2035, By Country
    • Historical Market Size Value (USD Billion) & Volume (Million Units) Trend Analysis By Market Taxonomy, 2020 to 2024
    • Market Size Value (USD Billion) & Volume (Million Units) Forecast By Market Taxonomy, 2025 to 2035
      • By Country
        • Russia
        • Hungary
        • Poland
        • Balkan & Baltics
        • Rest of E. Europe
      • By Product
      • By End User
      • By Price Range
      • By Distribution Channel
    • Market Attractiveness Analysis
      • By Country
      • By Product
      • By End User
      • By Price Range
      • By Distribution Channel
    • Key Takeaways
  15. East Asia Market Analysis 2020 to 2024 and Forecast 2025 to 2035, By Country
    • Historical Market Size Value (USD Billion) & Volume (Million Units) Trend Analysis By Market Taxonomy, 2020 to 2024
    • Market Size Value (USD Billion) & Volume (Million Units) Forecast By Market Taxonomy, 2025 to 2035
      • By Country
        • China
        • Japan
        • South Korea
      • By Product
      • By End User
      • By Price Range
      • By Distribution Channel
    • Market Attractiveness Analysis
      • By Country
      • By Product
      • By End User
      • By Price Range
      • By Distribution Channel
    • Key Takeaways
  16. South Asia & Pacific Market Analysis 2020 to 2024 and Forecast 2025 to 2035, By Country
    • Historical Market Size Value (USD Billion) & Volume (Million Units) Trend Analysis By Market Taxonomy, 2020 to 2024
    • Market Size Value (USD Billion) & Volume (Million Units) Forecast By Market Taxonomy, 2025 to 2035
      • By Country
        • India
        • Australia & New Zealand
        • ASEAN
        • Rest of SAP
      • By Product
      • By End User
      • By Price Range
      • By Distribution Channel
    • Market Attractiveness Analysis
      • By Country
      • By Product
      • By End User
      • By Price Range
      • By Distribution Channel
    • Key Takeaways
  17. Middle East and Africa Market Analysis 2020 to 2024 and Forecast 2025 to 2035, By Country
    • Historical Market Size Value (USD Billion) & Volume (Million Units) Trend Analysis By Market Taxonomy, 2020 to 2024
    • Market Size Value (USD Billion) & Volume (Million Units) Forecast By Market Taxonomy, 2025 to 2035
      • By Country
        • GCC Countries
        • Northern Africa
        • South Africa
        • Turkiye
        • Rest of MEA
      • By Product
      • By End User
      • By Price Range
      • By Distribution Channel
    • Market Attractiveness Analysis
      • By Country
      • By Product
      • By End User
      • By Price Range
      • By Distribution Channel
    • Key Takeaways
  18. Key Countries Market Analysis
    • USA
      • Pricing Analysis
      • Market Share Analysis, 2024
        • By Product
        • By End User
        • By Price Range
        • By Distribution Channel
    • Canada
      • Pricing Analysis
      • Market Share Analysis, 2024
        • By Product
        • By End User
        • By Price Range
        • By Distribution Channel
    • Brazil
      • Pricing Analysis
      • Market Share Analysis, 2024
        • By Product
        • By End User
        • By Price Range
        • By Distribution Channel
    • Mexico
      • Pricing Analysis
      • Market Share Analysis, 2024
        • By Product
        • By End User
        • By Price Range
        • By Distribution Channel
    • Argentina
      • Pricing Analysis
      • Market Share Analysis, 2024
        • By Product
        • By End User
        • By Price Range
        • By Distribution Channel
  19. Market Structure Analysis
    • Competition Dashboard
    • Competition Benchmarking
    • Market Share Analysis of Top Players
      • By Regional
      • By Product
      • By End User
      • By Price Range
      • By Distribution Channel
  20. Competition Analysis
    • Competition Deep Dive
      • Life Fitness (Hammer Strength)
        • Overview
        • Product Portfolio
        • Profitability by Market Segments (Product/Age /Sales Channel/Region)
        • Sales Footprint
        • Strategy Overview
          • Marketing Strategy
          • Product Strategy
          • Channel Strategy
      • Technogym S.p.A (Wellness Holding Srl)
        • Overview
        • Product Portfolio
        • Profitability by Market Segments (Product/Age /Sales Channel/Region)
        • Sales Footprint
        • Strategy Overview
          • Marketing Strategy
          • Product Strategy
          • Channel Strategy
      • Rogue Fitness
        • Overview
        • Product Portfolio
        • Profitability by Market Segments (Product/Age /Sales Channel/Region)
        • Sales Footprint
        • Strategy Overview
          • Marketing Strategy
          • Product Strategy
          • Channel Strategy
      • Precor (Amer Sports)
        • Overview
        • Product Portfolio
        • Profitability by Market Segments (Product/Age /Sales Channel/Region)
        • Sales Footprint
        • Strategy Overview
          • Marketing Strategy
          • Product Strategy
          • Channel Strategy
      • Cybex International Inc. (Brunswick Corporation)
        • Overview
        • Product Portfolio
        • Profitability by Market Segments (Product/Age /Sales Channel/Region)
        • Sales Footprint
        • Strategy Overview
          • Marketing Strategy
          • Product Strategy
          • Channel Strategy
      • Nautilus Inc.
        • Overview
        • Product Portfolio
        • Profitability by Market Segments (Product/Age /Sales Channel/Region)
        • Sales Footprint
        • Strategy Overview
          • Marketing Strategy
          • Product Strategy
          • Channel Strategy
      • Eleiko
        • Overview
        • Product Portfolio
        • Profitability by Market Segments (Product/Age /Sales Channel/Region)
        • Sales Footprint
        • Strategy Overview
          • Marketing Strategy
          • Product Strategy
          • Channel Strategy
      • Decathlon
        • Overview
        • Product Portfolio
        • Profitability by Market Segments (Product/Age /Sales Channel/Region)
        • Sales Footprint
        • Strategy Overview
          • Marketing Strategy
          • Product Strategy
          • Channel Strategy
      • Powertec
        • Overview
        • Product Portfolio
        • Profitability by Market Segments (Product/Age /Sales Channel/Region)
        • Sales Footprint
        • Strategy Overview
          • Marketing Strategy
          • Product Strategy
          • Channel Strategy
      • ICON Health and Fitness Inc. (IHF Holdings Inc.)
        • Overview
        • Product Portfolio
        • Profitability by Market Segments (Product/Age /Sales Channel/Region)
        • Sales Footprint
        • Strategy Overview
          • Marketing Strategy
          • Product Strategy
          • Channel Strategy
      • American Barbell Gym Equipment
        • Overview
        • Product Portfolio
        • Profitability by Market Segments (Product/Age /Sales Channel/Region)
        • Sales Footprint
        • Strategy Overview
          • Marketing Strategy
          • Product Strategy
          • Channel Strategy
  21. Assumptions & Acronyms Used
  22. Research Methodology

List of Tables

  • Table 1: Global Market Value (USD Billion) Forecast by Region, 2020-2035
  • Table 2: Global Market Volume (Million Units) Forecast by Region, 2020-2035
  • Table 3: Global Market Value (USD Billion) Forecast by Product, 2020-2035
  • Table 4: Global Market Volume (Million Units) Forecast by Product, 2020-2035
  • Table 5: Global Market Value (USD Billion) Forecast by End User, 2020-2035
  • Table 6: Global Market Volume (Million Units) Forecast by End User, 2020-2035
  • Table 7: Global Market Value (USD Billion) Forecast by Price Range, 2020-2035
  • Table 8: Global Market Volume (Million Units) Forecast by Price Range, 2020-2035
  • Table 9: Global Market Value (USD Billion) Forecast by Distribution Channel, 2020-2035
  • Table 10: Global Market Volume (Million Units) Forecast by Distribution Channel, 2020-2035
  • Table 11: North America Market Value (USD Billion) Forecast by Country, 2020-2035
  • Table 12: North America Market Volume (Million Units) Forecast by Country, 2020-2035
  • Table 13: North America Market Value (USD Billion) Forecast by Product, 2020-2035
  • Table 14: North America Market Volume (Million Units) Forecast by Product, 2020-2035
  • Table 15: North America Market Value (USD Billion) Forecast by End User, 2020-2035
  • Table 16: North America Market Volume (Million Units) Forecast by End User, 2020-2035
  • Table 17: North America Market Value (USD Billion) Forecast by Price Range, 2020-2035
  • Table 18: North America Market Volume (Million Units) Forecast by Price Range, 2020-2035
  • Table 19: North America Market Value (USD Billion) Forecast by Distribution Channel, 2020-2035
  • Table 20: North America Market Volume (Million Units) Forecast by Distribution Channel, 2020-2035
  • Table 21: Latin America Market Value (USD Billion) Forecast by Country, 2020-2035
  • Table 22: Latin America Market Volume (Million Units) Forecast by Country, 2020-2035
  • Table 23: Latin America Market Value (USD Billion) Forecast by Product, 2020-2035
  • Table 24: Latin America Market Volume (Million Units) Forecast by Product, 2020-2035
  • Table 25: Latin America Market Value (USD Billion) Forecast by End User, 2020-2035
  • Table 26: Latin America Market Volume (Million Units) Forecast by End User, 2020-2035
  • Table 27: Latin America Market Value (USD Billion) Forecast by Price Range, 2020-2035
  • Table 28: Latin America Market Volume (Million Units) Forecast by Price Range, 2020-2035
  • Table 29: Latin America Market Value (USD Billion) Forecast by Distribution Channel, 2020-2035
  • Table 30: Latin America Market Volume (Million Units) Forecast by Distribution Channel, 2020-2035
  • Table 31: Western Europe Market Value (USD Billion) Forecast by Country, 2020-2035
  • Table 32: Western Europe Market Volume (Million Units) Forecast by Country, 2020-2035
  • Table 33: Western Europe Market Value (USD Billion) Forecast by Product, 2020-2035
  • Table 34: Western Europe Market Volume (Million Units) Forecast by Product, 2020-2035
  • Table 35: Western Europe Market Value (USD Billion) Forecast by End User, 2020-2035
  • Table 36: Western Europe Market Volume (Million Units) Forecast by End User, 2020-2035
  • Table 37: Western Europe Market Value (USD Billion) Forecast by Price Range, 2020-2035
  • Table 38: Western Europe Market Volume (Million Units) Forecast by Price Range, 2020-2035
  • Table 39: Western Europe Market Value (USD Billion) Forecast by Distribution Channel, 2020-2035
  • Table 40: Western Europe Market Volume (Million Units) Forecast by Distribution Channel, 2020-2035
  • Table 41: Eastern Europe Market Value (USD Billion) Forecast by Country, 2020-2035
  • Table 42: Eastern Europe Market Volume (Million Units) Forecast by Country, 2020-2035
  • Table 43: Eastern Europe Market Value (USD Billion) Forecast by Product, 2020-2035
  • Table 44: Eastern Europe Market Volume (Million Units) Forecast by Product, 2020-2035
  • Table 45: Eastern Europe Market Value (USD Billion) Forecast by End User, 2020-2035
  • Table 46: Eastern Europe Market Volume (Million Units) Forecast by End User, 2020-2035
  • Table 47: Eastern Europe Market Value (USD Billion) Forecast by Price Range, 2020-2035
  • Table 48: Eastern Europe Market Volume (Million Units) Forecast by Price Range, 2020-2035
  • Table 49: Eastern Europe Market Value (USD Billion) Forecast by Distribution Channel, 2020-2035
  • Table 50: Eastern Europe Market Volume (Million Units) Forecast by Distribution Channel, 2020-2035
  • Table 51: East Asia Market Value (USD Billion) Forecast by Country, 2020-2035
  • Table 52: East Asia Market Volume (Million Units) Forecast by Country, 2020-2035
  • Table 53: East Asia Market Value (USD Billion) Forecast by Product, 2020-2035
  • Table 54: East Asia Market Volume (Million Units) Forecast by Product, 2020-2035
  • Table 55: East Asia Market Value (USD Billion) Forecast by End User, 2020-2035
  • Table 56: East Asia Market Volume (Million Units) Forecast by End User, 2020-2035
  • Table 57: East Asia Market Value (USD Billion) Forecast by Price Range, 2020-2035
  • Table 58: East Asia Market Volume (Million Units) Forecast by Price Range, 2020-2035
  • Table 59: East Asia Market Value (USD Billion) Forecast by Distribution Channel, 2020-2035
  • Table 60: East Asia Market Volume (Million Units) Forecast by Distribution Channel, 2020-2035
  • Table 61: South Asia & Pacific Market Value (USD Billion) Forecast by Country, 2020-2035
  • Table 62: South Asia & Pacific Market Volume (Million Units) Forecast by Country, 2020-2035
  • Table 63: South Asia & Pacific Market Value (USD Billion) Forecast by Product, 2020-2035
  • Table 64: South Asia & Pacific Market Volume (Million Units) Forecast by Product, 2020-2035
  • Table 65: South Asia & Pacific Market Value (USD Billion) Forecast by End User, 2020-2035
  • Table 66: South Asia & Pacific Market Volume (Million Units) Forecast by End User, 2020-2035
  • Table 67: South Asia & Pacific Market Value (USD Billion) Forecast by Price Range, 2020-2035
  • Table 68: South Asia & Pacific Market Volume (Million Units) Forecast by Price Range, 2020-2035
  • Table 69: South Asia & Pacific Market Value (USD Billion) Forecast by Distribution Channel, 2020-2035
  • Table 70: South Asia & Pacific Market Volume (Million Units) Forecast by Distribution Channel, 2020-2035
  • Table 71: Middle East and Africa Market Value (USD Billion) Forecast by Country, 2020-2035
  • Table 72: Middle East and Africa Market Volume (Million Units) Forecast by Country, 2020-2035
  • Table 73: Middle East and Africa Market Value (USD Billion) Forecast by Product, 2020-2035
  • Table 74: Middle East and Africa Market Volume (Million Units) Forecast by Product, 2020-2035
  • Table 75: Middle East and Africa Market Value (USD Billion) Forecast by End User, 2020-2035
  • Table 76: Middle East and Africa Market Volume (Million Units) Forecast by End User, 2020-2035
  • Table 77: Middle East and Africa Market Value (USD Billion) Forecast by Price Range, 2020-2035
  • Table 78: Middle East and Africa Market Volume (Million Units) Forecast by Price Range, 2020-2035
  • Table 79: Middle East and Africa Market Value (USD Billion) Forecast by Distribution Channel, 2020-2035
  • Table 80: Middle East and Africa Market Volume (Million Units) Forecast by Distribution Channel, 2020-2035

List of Figures

  • Figure 1: Global Market Volume (Million Units) Forecast 2020-2035
  • Figure 2: Global Market Pricing Analysis
  • Figure 3: Global Market Value (USD Billion) Forecast 2020-2035
  • Figure 4: Global Market Value Share and BPS Analysis by Product, 2025 and 2035
  • Figure 5: Global Market Y-o-Y Growth Comparison by Product, 2025-2035
  • Figure 6: Global Market Attractiveness Analysis by Product
  • Figure 7: Global Market Value Share and BPS Analysis by End User, 2025 and 2035
  • Figure 8: Global Market Y-o-Y Growth Comparison by End User, 2025-2035
  • Figure 9: Global Market Attractiveness Analysis by End User
  • Figure 10: Global Market Value Share and BPS Analysis by Price Range, 2025 and 2035
  • Figure 11: Global Market Y-o-Y Growth Comparison by Price Range, 2025-2035
  • Figure 12: Global Market Attractiveness Analysis by Price Range
  • Figure 13: Global Market Value Share and BPS Analysis by Distribution Channel, 2025 and 2035
  • Figure 14: Global Market Y-o-Y Growth Comparison by Distribution Channel, 2025-2035
  • Figure 15: Global Market Attractiveness Analysis by Distribution Channel
  • Figure 16: Global Market Value (USD Billion) Share and BPS Analysis by Region, 2025 and 2035
  • Figure 17: Global Market Y-o-Y Growth Comparison by Region, 2025-2035
  • Figure 18: Global Market Attractiveness Analysis by Region
  • Figure 19: North America Market Incremental $ Opportunity, 2025-2035
  • Figure 20: Latin America Market Incremental $ Opportunity, 2025-2035
  • Figure 21: Western Europe Market Incremental $ Opportunity, 2025-2035
  • Figure 22: Eastern Europe Market Incremental $ Opportunity, 2025-2035
  • Figure 23: East Asia Market Incremental $ Opportunity, 2025-2035
  • Figure 24: South Asia & Pacific Market Incremental $ Opportunity, 2025-2035
  • Figure 25: Middle East and Africa Market Incremental $ Opportunity, 2025-2035
  • Figure 26: North America Market Value Share and BPS Analysis by Country, 2025 and 2035
  • Figure 27: North America Market Value Share and BPS Analysis by Product, 2025 and 2035
  • Figure 28: North America Market Y-o-Y Growth Comparison by Product, 2025-2035
  • Figure 29: North America Market Attractiveness Analysis by Product
  • Figure 30: North America Market Value Share and BPS Analysis by End User, 2025 and 2035
  • Figure 31: North America Market Y-o-Y Growth Comparison by End User, 2025-2035
  • Figure 32: North America Market Attractiveness Analysis by End User
  • Figure 33: North America Market Value Share and BPS Analysis by Price Range, 2025 and 2035
  • Figure 34: North America Market Y-o-Y Growth Comparison by Price Range, 2025-2035
  • Figure 35: North America Market Attractiveness Analysis by Price Range
  • Figure 36: North America Market Value Share and BPS Analysis by Distribution Channel, 2025 and 2035
  • Figure 37: North America Market Y-o-Y Growth Comparison by Distribution Channel, 2025-2035
  • Figure 38: North America Market Attractiveness Analysis by Distribution Channel
  • Figure 39: Latin America Market Value Share and BPS Analysis by Country, 2025 and 2035
  • Figure 40: Latin America Market Value Share and BPS Analysis by Product, 2025 and 2035
  • Figure 41: Latin America Market Y-o-Y Growth Comparison by Product, 2025-2035
  • Figure 42: Latin America Market Attractiveness Analysis by Product
  • Figure 43: Latin America Market Value Share and BPS Analysis by End User, 2025 and 2035
  • Figure 44: Latin America Market Y-o-Y Growth Comparison by End User, 2025-2035
  • Figure 45: Latin America Market Attractiveness Analysis by End User
  • Figure 46: Latin America Market Value Share and BPS Analysis by Price Range, 2025 and 2035
  • Figure 47: Latin America Market Y-o-Y Growth Comparison by Price Range, 2025-2035
  • Figure 48: Latin America Market Attractiveness Analysis by Price Range
  • Figure 49: Latin America Market Value Share and BPS Analysis by Distribution Channel, 2025 and 2035
  • Figure 50: Latin America Market Y-o-Y Growth Comparison by Distribution Channel, 2025-2035
  • Figure 51: Latin America Market Attractiveness Analysis by Distribution Channel
  • Figure 52: Western Europe Market Value Share and BPS Analysis by Country, 2025 and 2035
  • Figure 53: Western Europe Market Value Share and BPS Analysis by Product, 2025 and 2035
  • Figure 54: Western Europe Market Y-o-Y Growth Comparison by Product, 2025-2035
  • Figure 55: Western Europe Market Attractiveness Analysis by Product
  • Figure 56: Western Europe Market Value Share and BPS Analysis by End User, 2025 and 2035
  • Figure 57: Western Europe Market Y-o-Y Growth Comparison by End User, 2025-2035
  • Figure 58: Western Europe Market Attractiveness Analysis by End User
  • Figure 59: Western Europe Market Value Share and BPS Analysis by Price Range, 2025 and 2035
  • Figure 60: Western Europe Market Y-o-Y Growth Comparison by Price Range, 2025-2035
  • Figure 61: Western Europe Market Attractiveness Analysis by Price Range
  • Figure 62: Western Europe Market Value Share and BPS Analysis by Distribution Channel, 2025 and 2035
  • Figure 63: Western Europe Market Y-o-Y Growth Comparison by Distribution Channel, 2025-2035
  • Figure 64: Western Europe Market Attractiveness Analysis by Distribution Channel
  • Figure 65: Eastern Europe Market Value Share and BPS Analysis by Country, 2025 and 2035
  • Figure 66: Eastern Europe Market Value Share and BPS Analysis by Product, 2025 and 2035
  • Figure 67: Eastern Europe Market Y-o-Y Growth Comparison by Product, 2025-2035
  • Figure 68: Eastern Europe Market Attractiveness Analysis by Product
  • Figure 69: Eastern Europe Market Value Share and BPS Analysis by End User, 2025 and 2035
  • Figure 70: Eastern Europe Market Y-o-Y Growth Comparison by End User, 2025-2035
  • Figure 71: Eastern Europe Market Attractiveness Analysis by End User
  • Figure 72: Eastern Europe Market Value Share and BPS Analysis by Price Range, 2025 and 2035
  • Figure 73: Eastern Europe Market Y-o-Y Growth Comparison by Price Range, 2025-2035
  • Figure 74: Eastern Europe Market Attractiveness Analysis by Price Range
  • Figure 75: Eastern Europe Market Value Share and BPS Analysis by Distribution Channel, 2025 and 2035
  • Figure 76: Eastern Europe Market Y-o-Y Growth Comparison by Distribution Channel, 2025-2035
  • Figure 77: Eastern Europe Market Attractiveness Analysis by Distribution Channel
  • Figure 78: East Asia Market Value Share and BPS Analysis by Country, 2025 and 2035
  • Figure 79: East Asia Market Value Share and BPS Analysis by Product, 2025 and 2035
  • Figure 80: East Asia Market Y-o-Y Growth Comparison by Product, 2025-2035
  • Figure 81: East Asia Market Attractiveness Analysis by Product
  • Figure 82: East Asia Market Value Share and BPS Analysis by End User, 2025 and 2035
  • Figure 83: East Asia Market Y-o-Y Growth Comparison by End User, 2025-2035
  • Figure 84: East Asia Market Attractiveness Analysis by End User
  • Figure 85: East Asia Market Value Share and BPS Analysis by Price Range, 2025 and 2035
  • Figure 86: East Asia Market Y-o-Y Growth Comparison by Price Range, 2025-2035
  • Figure 87: East Asia Market Attractiveness Analysis by Price Range
  • Figure 88: East Asia Market Value Share and BPS Analysis by Distribution Channel, 2025 and 2035
  • Figure 89: East Asia Market Y-o-Y Growth Comparison by Distribution Channel, 2025-2035
  • Figure 90: East Asia Market Attractiveness Analysis by Distribution Channel
  • Figure 91: South Asia & Pacific Market Value Share and BPS Analysis by Country, 2025 and 2035
  • Figure 92: South Asia & Pacific Market Value Share and BPS Analysis by Product, 2025 and 2035
  • Figure 93: South Asia & Pacific Market Y-o-Y Growth Comparison by Product, 2025-2035
  • Figure 94: South Asia & Pacific Market Attractiveness Analysis by Product
  • Figure 95: South Asia & Pacific Market Value Share and BPS Analysis by End User, 2025 and 2035
  • Figure 96: South Asia & Pacific Market Y-o-Y Growth Comparison by End User, 2025-2035
  • Figure 97: South Asia & Pacific Market Attractiveness Analysis by End User
  • Figure 98: South Asia & Pacific Market Value Share and BPS Analysis by Price Range, 2025 and 2035
  • Figure 99: South Asia & Pacific Market Y-o-Y Growth Comparison by Price Range, 2025-2035
  • Figure 100: South Asia & Pacific Market Attractiveness Analysis by Price Range
  • Figure 101: South Asia & Pacific Market Value Share and BPS Analysis by Distribution Channel, 2025 and 2035
  • Figure 102: South Asia & Pacific Market Y-o-Y Growth Comparison by Distribution Channel, 2025-2035
  • Figure 103: South Asia & Pacific Market Attractiveness Analysis by Distribution Channel
  • Figure 104: Middle East and Africa Market Value Share and BPS Analysis by Country, 2025 and 2035
  • Figure 105: Middle East and Africa Market Value Share and BPS Analysis by Product, 2025 and 2035
  • Figure 106: Middle East and Africa Market Y-o-Y Growth Comparison by Product, 2025-2035
  • Figure 107: Middle East and Africa Market Attractiveness Analysis by Product
  • Figure 108: Middle East and Africa Market Value Share and BPS Analysis by End User, 2025 and 2035
  • Figure 109: Middle East and Africa Market Y-o-Y Growth Comparison by End User, 2025-2035
  • Figure 110: Middle East and Africa Market Attractiveness Analysis by End User
  • Figure 111: Middle East and Africa Market Value Share and BPS Analysis by Price Range, 2025 and 2035
  • Figure 112: Middle East and Africa Market Y-o-Y Growth Comparison by Price Range, 2025-2035
  • Figure 113: Middle East and Africa Market Attractiveness Analysis by Price Range
  • Figure 114: Middle East and Africa Market Value Share and BPS Analysis by Distribution Channel, 2025 and 2035
  • Figure 115: Middle East and Africa Market Y-o-Y Growth Comparison by Distribution Channel, 2025-2035
  • Figure 116: Middle East and Africa Market Attractiveness Analysis by Distribution Channel
  • Figure 117: Global Market - Tier Structure Analysis
  • Figure 118: Global Market - Company Share Analysis

Frequently Asked Questions

What was the value of the weight training market in 2025?

The industry was valued at USD 12.1 billion in 2025.

What is the projected size of the weight training market by 2035?

The industry is expected to reach USD 16.26 billion by 2035.

What is the CAGR of the weight training market from 2025 to 2035?

The industry is projected to expand at a CAGR of 3.6% during the forecast period.

Which country had the third-highest growth rate in the weight training market from 2025 to 2035?

The United States ranked third with a CAGR of 5.8% in the market.

Which was the leading product segment in the weight training market in 2025?

Free weights led the industry in 2025 with a 38% share.

Explore Similar Insights

Future Market Insights

Weight Training Market