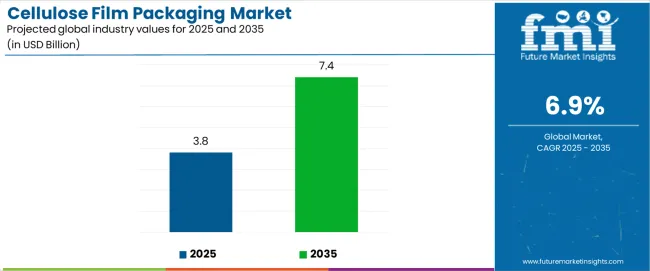
The global cellulose film packaging market is valued at USD 3.8 billion in 2025 and is slated to reach USD 7.4 billion by 2035, recording an absolute increase of USD 3.6 billion over the forecast period. This translates into a total growth of 94.7%, with the market forecast to expand at a CAGR of 6.9% between 2025 and 2035. The overall market size is expected to grow by nearly 1.95X during the same period, supported by increasing demand for biodegradable packaging solutions in food applications, growing adoption of transparent film materials in confectionery wrapping, and rising preference for renewable-based barrier films across pharmaceutical packaging and specialty product encapsulation applications.
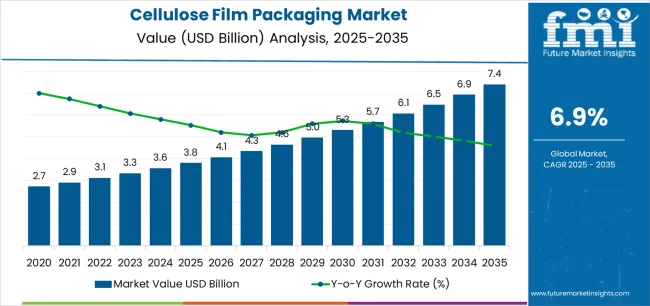
Between 2025 and 2030, the cellulose film packaging market is projected to expand from USD 3.8 billion to USD 5.4 billion, resulting in a value increase of USD 1.6 billion, which represents 44.4% of the total forecast growth for the decade. This phase of development will be shaped by increasing consumer preference for plant-based packaging materials, rising adoption of compostable film structures, and growing demand for moisture-resistant cellulose films with enhanced barrier characteristics. Food manufacturers are expanding their cellulose film sourcing capabilities to address the growing demand for twist-wrap confectionery packaging, transparent food overwraps, and specialty product presentation requirements.
| Metric | Value |
|---|---|
| Estimated Value in (2025E) | USD 3.8 billion |
| Forecast Value in (2035F) | USD 7.4 billion |
| Forecast CAGR (2025 to 2035) | 6.9% |
The market occupies a small but expanding portion of these parent markets. In biodegradable and compostable films, cellulose films represent around 20%, providing a fully compostable option. Within renewable materials packaging, they make up approximately 15%, derived from natural sources. Flexible packaging accounts for about 25%, where cellulose films are used in pouches, wraps, and protective layers due to their clarity and adaptability. Food and beverage applications hold the largest share at 30%, where cellulose films help maintain freshness and product integrity. Personal care and pharmaceutical packaging cover around 10%, ensuring moisture protection and product safety. These estimates highlight cellulose films as an emerging choice across multiple sectors.
Innovation and regulatory alignment are shaping the cellulose film packaging industry. Companies are developing films with improved barrier properties, moisture resistance, and sealing capabilities. Growing consumer preference for eco-friendly packaging is prompting brands to adopt cellulose films. Firms are expanding product lines to meet specific packaging needs and forming partnerships to secure consistent access to raw materials. Advanced manufacturing techniques are increasing the performance and reliability of films. Regulatory measures limiting plastic use are accelerating adoption. Hybrid materials that combine cellulose with other biodegradable options are also emerging. These trends demonstrate a clear move toward environmentally conscious packaging and continuous improvements in film performance.
Market expansion is being supported by the increasing global demand for renewable packaging solutions and the corresponding need for packaging materials that can provide superior biodegradability and compostability while enabling transparent product display and moisture protection across various confectionery and pharmaceutical packaging applications. Modern food manufacturers and confectionery producers are increasingly focused on implementing packaging solutions that can showcase product appearance, prevent moisture ingress, and provide consistent barrier performance throughout complex distribution networks. Cellulose film packaging's proven ability to deliver exceptional transparency against moisture exposure, enable home-compostable disposal, and support premium presentation make them essential packaging formats for contemporary confectionery and specialty food operations.
The growing emphasis on plant-based packaging and environmental responsibility is driving demand for cellulose films that can support high-volume production requirements, improve product shelf life, and enable automated wrapping formats. Manufacturers' preference for packaging that combines effective moisture barriers with biodegradability and natural origin is creating opportunities for innovative cellulose film implementations. The rising influence of circular economy principles and consumer awareness is also contributing to increased demand for cellulose films that can provide renewable sourcing, industrial compostability, and reliable performance across extended storage durations.
The cellulose film packaging market is poised for rapid growth and transformation. As industries across confectionery, pharmaceuticals, tobacco, specialty foods, and gift wrapping seek packaging that delivers exceptional transparency, biodegradability, and moisture resistance, cellulose films are gaining prominence not just as traditional packaging but as strategic enablers of environmental responsibility and premium product presentation.
Rising consumer preference for renewable materials in Europe and expanding plant-based packaging markets globally amplify demand, while manufacturers are leveraging innovations in barrier coating technologies, heat-sealable formulations, and metallized cellulose structures.
Pathways like specialty barrier-coated formulations, metallized decorative films, and application-specific customization promise strong margin uplift, especially in high-value segments. Geographic expansion and vertical integration will capture volume, particularly where local manufacturing capabilities and regulatory compliance are critical. Regulatory pressures around plastic waste reduction, compostability certification requirements, pharmaceutical packaging standards, and food contact material regulations give structural support.
The market is segmented by film type, application, thickness, end-use industry, and region. By film type, the market is divided into plain cellulose films, coated cellulose films, and metallized cellulose films. By application, it covers food & confectionery, pharmaceutical & healthcare, tobacco products, cosmetics & personal care, and others. By thickness, the market is segmented into standard (15-25 microns), medium (25-35 microns), and heavy (above 35 microns). By end-use industry, it is categorized into food processing, pharmaceutical manufacturing, tobacco industry, cosmetics production, and others. Regionally, the market is divided into North America, Europe, East Asia, South Asia & Pacific, Latin America, and the Middle East & Africa.
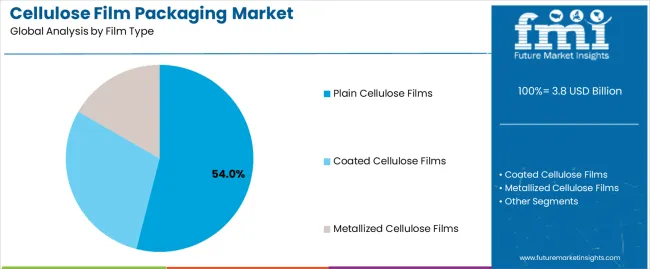
The coated cellulose films segment is projected to account for 54.0% of the cellulose film packaging market in 2025, reaffirming its position as the leading film category. Food manufacturers and confectionery producers increasingly utilize coated cellulose films for their superior moisture barrier properties when processed through advanced coating technologies, excellent transparency characteristics, and enhanced performance in applications ranging from twist-wrap candies to pharmaceutical blister packaging. Coated cellulose film technology's advanced barrier layer capabilities and consistent moisture protection directly address the industrial requirements for reliable shelf-life extension in humidity-sensitive product environments.
This film segment forms the foundation of modern confectionery packaging operations, as it represents the cellulose film type with the greatest versatility and established market demand across multiple application categories and industry sectors. Manufacturer investments in enhanced coating formulations and heat-sealability features continue to strengthen adoption among food processors and pharmaceutical companies. With companies prioritizing product protection and biodegradable packaging solutions, coated cellulose films align with both barrier performance requirements and environmental responsibility objectives, making them the central component of comprehensive packaging strategies.
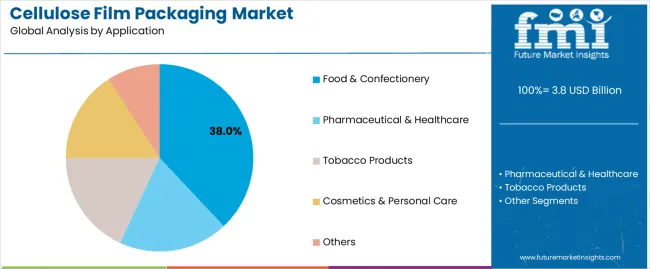
Food & confectionery applications are projected to represent 38.0% of cellulose film demand in 2025, underscoring their critical role as the primary industrial consumers of transparent cellulose film packaging for candy wrapping, chocolate overwrapping, and premium food product presentation. Confectionery manufacturers prefer cellulose films for their exceptional transparency capabilities, biodegradable characteristics, and ability to provide moisture protection while ensuring premium product display and consumer appeal. Positioned as essential packaging formats for modern confectionery operations, cellulose films offer both presentation advantages and environmental benefits.
The segment is supported by continuous innovation in barrier coating technologies and the growing availability of specialized heat-sealable structures that enable high-speed wrapping with enhanced moisture resistance and rapid packaging throughput. Confectionery operators are investing in automated flow-wrapping systems to support large-volume cellulose film utilization and packaging efficiency. As consumer preference for biodegradable packaging becomes more prevalent and premium confectionery demand increases, food & confectionery applications will continue to dominate the end-use market while supporting advanced renewable packaging utilization and production automation strategies.
The market is advancing rapidly due to increasing demand for biodegradable packaging alternatives and growing adoption of transparent wrapping solutions that provide superior compostability and moisture protection while enabling renewable-sourced materials across diverse confectionery and pharmaceutical packaging applications. The market faces challenges, including higher material costs compared to conventional plastics, moisture sensitivity in uncoated variants, and the need for specialized coating technology investments. Innovation in barrier enhancement formulations and heat-sealable film development continues to influence product development and market expansion patterns.
The growing adoption of moisture-resistant barrier coatings, metallized decorative films, and heat-sealable cellulose formulations is enabling manufacturers to produce specialized cellulose films with superior moisture protection, enhanced visual appeal properties, and automated packaging compatibility functionalities. Advanced coating systems provide improved shelf-life protection while allowing more efficient automated wrapping and consistent performance across various storage conditions and applications. Manufacturers are increasingly recognizing the competitive advantages of barrier-enhanced cellulose film capabilities for product differentiation and premium market positioning.
Modern cellulose film producers are incorporating high-speed flow wrapping systems, integrated twist-wrap machines, and sensor-controlled sealing mechanisms to enhance packaging efficiency, enable material optimization, and deliver value-added solutions to confectionery and pharmaceutical customers. These technologies improve production throughput while enabling new operational capabilities, including high-speed product wrapping, consistent seal quality, and reduced film waste. Advanced automation integration also allows manufacturers to support large-scale confectionery operations and production modernization beyond traditional manual wrapping approaches.
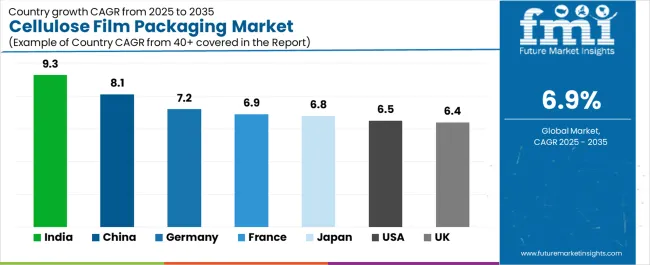
| Country | CAGR (2025-2035) |
|---|---|
| Germany | 7.2% |
| USA | 6.5% |
| China | 8.1% |
| Japan | 6.8% |
| India | 9.3% |
| France | 6.9% |
| UK | 6.4% |
The market is experiencing strong growth globally, with India leading at a 9.3% CAGR through 2035, driven by the expanding confectionery sector, growing consumer awareness of biodegradable packaging, and significant investment in food processing infrastructure development. China follows at 8.1%, supported by rapid confectionery manufacturing growth, increasing pharmaceutical packaging demand, and growing domestic food industry capabilities. Germany shows growth at 7.2%, emphasizing biodegradable packaging innovation and confectionery manufacturing excellence. Japan records 6.8%, focusing on premium confectionery packaging and quality transparent film production. The USA demonstrates 6.5% growth, prioritizing compostable packaging adoption and pharmaceutical compliance standards. France exhibits 6.9% growth, supported by luxury confectionery demand and specialty food packaging concentration. The UK shows 6.4% growth, emphasizing environmental packaging initiatives and confectionery market development.
The report covers an in-depth analysis of 40+ countries, Top-performing countries are highlighted below.
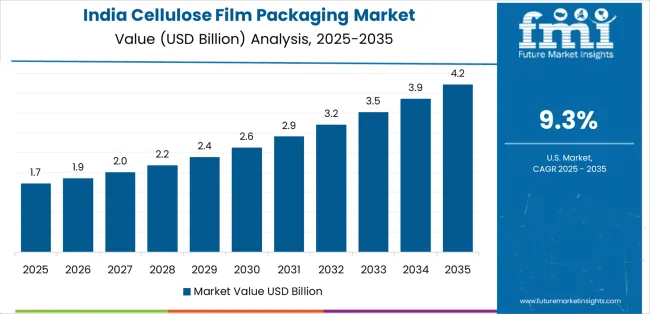
The cellulose film packaging market in India is projected to exhibit exceptional growth with a CAGR of 9.3% through 2035, driven by expanding confectionery consumption and rapidly growing food processing sector supported by government initiatives promoting food safety and packaging modernization. The country's strong position in pharmaceutical manufacturing and increasing investment in biodegradable packaging solutions are creating substantial demand for cellulose film applications. Major confectionery manufacturers and pharmaceutical companies are establishing comprehensive cellulose film sourcing capabilities to serve both domestic production demand and export packaging markets.
The cellulose film packaging market in China is expanding at a CAGR of 8.1%, supported by the country's massive confectionery production capacity, expanding pharmaceutical industry, and increasing adoption of biodegradable packaging materials. The country's government initiatives promoting environmental protection and growing middle-class consumption are driving requirements for sophisticated transparent packaging capabilities. International suppliers and domestic manufacturers are establishing extensive production and distribution capabilities to address the growing demand for cellulose film products.
The cellulose film packaging market in Germany is expanding at a CAGR of 7.2%, supported by the country's advanced confectionery manufacturing capabilities, strong emphasis on biodegradable packaging technologies, and robust demand for high-performance transparent films in specialty food and pharmaceutical applications. The nation's mature packaging sector and innovation-focused operations are driving sophisticated cellulose film systems throughout the supply chain. Leading manufacturers and technology providers are investing extensively in barrier coating technologies and compostable film formulations to serve both domestic and international markets.
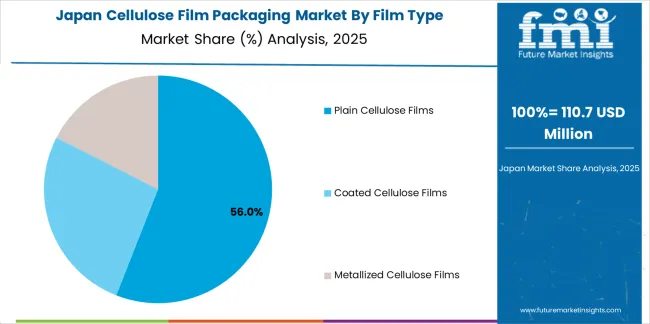
The cellulose film packaging market in in Japan is growing at a CAGR of 6.8%, driven by the country's premium confectionery sector, emphasis on packaging aesthetics, and strong position in pharmaceutical-grade cellulose film production. Japan's established packaging technology capabilities and commitment to quality excellence are supporting investment in advanced coating technologies throughout major manufacturing centers. Industry leaders are establishing comprehensive quality assurance systems to serve domestic confectionery manufacturers and pharmaceutical exporters.
Demand for cellulose film packaging in the USA is expanding at a CAGR of 6.5%, supported by the country's growing consumer preference for compostable packaging, strong emphasis on pharmaceutical compliance standards, and robust demand for biodegradable alternatives in confectionery and specialty food applications. The nation's environmental awareness and regulatory-focused operations are driving certified cellulose film systems throughout the industry. Leading manufacturers are investing in certified compostable formulations and pharmaceutical-grade cellulose films to serve both retail and healthcare markets.
Demand for cellulose film packaging in France is expanding at a CAGR of 6.9%, supported by the country's luxury confectionery manufacturing concentration, growing gourmet food sector, and strategic position in European specialty packaging networks. France's premium confectionery capabilities and integrated food industry infrastructure are driving demand for high-quality cellulose films in chocolate packaging, artisanal candy wrapping, and specialty food applications. Leading manufacturers are investing in specialized capabilities to serve the stringent requirements of luxury confectionery and gourmet food industries.
The cellulose film packaging market in the UK is growing at a CAGR of 6.4%, driven by the country's environmental packaging initiatives, expanding confectionery market, and increasing consumer preference for biodegradable alternatives. The UK's commitment to plastic waste reduction and growing regulatory focus on compostable packaging are supporting demand for cellulose film solutions across multiple sectors. Manufacturers are establishing comprehensive sourcing capabilities to serve the growing domestic market and specialty packaging requirements.
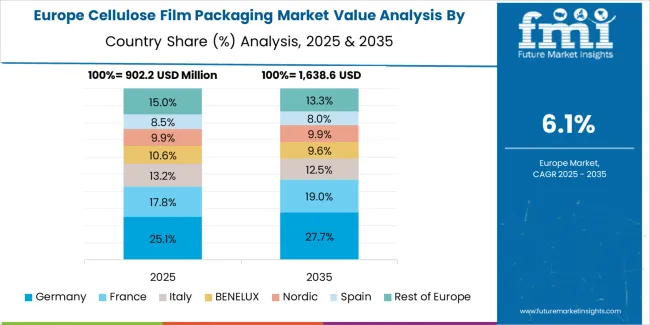
The cellulose film packaging market in Europe is projected to grow from USD 1.3 billion in 2025 to USD 2.5 billion by 2035, registering a CAGR of 7.1% over the forecast period. Germany is expected to maintain its leadership position with a 34.0% market share in 2025, increasing slightly to 34.5% by 2035, supported by its strong confectionery manufacturing industry, advanced biodegradable packaging capabilities, and comprehensive pharmaceutical packaging sector serving diverse cellulose film applications across Europe.
France follows with a 21.0% share in 2025, projected to reach 21.5% by 2035, driven by robust demand for cellulose films in luxury confectionery packaging, artisanal food wrapping, and specialty product applications, combined with established food processing infrastructure and premium packaging expertise. The United Kingdom holds a 17.0% share in 2025, expected to reach 17.5% by 2035, supported by strong environmental packaging initiatives and growing biodegradable material adoption. Italy commands a 12.0% share in 2025, projected to reach 12.3% by 2035, while Spain accounts for 7.0% in 2025, expected to reach 7.5% by 2035. Switzerland maintains a 4.0% share in 2025, growing to 4.3% by 2035. The Rest of Europe region, including Nordic countries, Eastern Europe, Belgium, Austria, and other nations, is anticipated to maintain momentum, with its collective share moving from 4.5% to 2.4% by 2035, attributed to increasing confectionery production in Eastern Europe and growing biodegradable packaging adoption in Nordic countries implementing advanced environmental packaging programs.
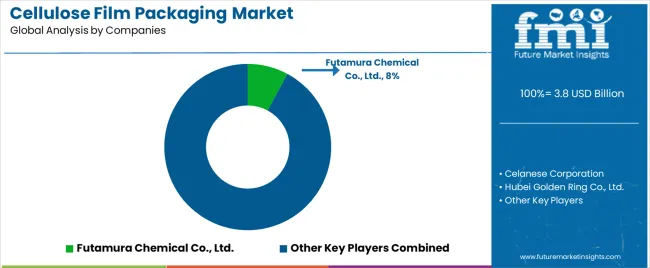
The market is characterized by competition among established cellulose film manufacturers, specialized coating technology providers, and integrated packaging solutions companies. Companies are investing in barrier coating research, heat-sealable formulation development, biodegradability certification programs, and comprehensive product portfolios to deliver consistent, high-performance, and application-specific cellulose film solutions. Innovation in metallized coatings, enhanced moisture barriers, and automation compatibility is central to strengthening market position and competitive advantage.
Futamura Chemical leads the market with a strong market share, offering comprehensive cellulose film solutions including the Nature Flex brand with a focus on compostable packaging and confectionery applications. Celanese Corporation provides specialized cellulose acetate capabilities with an emphasis on pharmaceutical-grade films and high-barrier formulations. Hubei Golden Ring delivers innovative cellulose film products with a focus on transparent packaging materials and cost-effective solutions. Weifang Henglian Cellulose Film specializes in coated cellulose films and moisture-resistant variants for food packaging applications. Innovia Films focuses on advanced barrier coating technologies and specialty cellulose film structures. Sappi Limited offers integrated cellulose packaging solutions with emphasis on renewable materials and specialty paper-based alternatives.
| Items | Values |
|---|---|
| Quantitative Units (2025) | USD 3.8 billion |
| Film Type | Plain Cellulose Films, Coated Cellulose Films, Metallized Cellulose Films |
| Application | Food & Confectionery, Pharmaceutical & Healthcare, Tobacco Products, Cosmetics & Personal Care, Others |
| Thickness | Standard (15-25 microns), Medium (25-35 microns), Heavy (Above 35 microns) |
| End-Use Industry | Food Processing, Pharmaceutical Manufacturing, Tobacco Industry, Cosmetics Production, Others |
| Regions Covered | North America, Europe, East Asia, South Asia & Pacific, Latin America, Middle East & Africa |
| Countries Covered | United States, Canada, United Kingdom, Germany, France, China, Japan, South Korea, India, Brazil, Australia and 40+ countries |
| Key Companies Profiled | Futamura Chemical, Celanese Corporation, Hubei Golden Ring, Weifang Henglian Cellulose Film, Innovia Films, and Sappi Limited |
| Additional Attributes | Dollar sales by film type and application category, regional demand trends, competitive landscape, technological advancements in barrier coating systems, heat-sealable film development, metallization innovation, and supply chain integration |
The global cellulose film packaging market is estimated to be valued at USD 3.8 billion in 2025.
The market size for the cellulose film packaging market is projected to reach USD 7.4 billion by 2035.
The cellulose film packaging market is expected to grow at a 6.9% CAGR between 2025 and 2035.
The key product types in cellulose film packaging market are plain cellulose films, coated cellulose films and metallized cellulose films.
In terms of application, food & confectionery segment to command 38.0% share in the cellulose film packaging market in 2025.


Our Research Products

The "Full Research Suite" delivers actionable market intel, deep dives on markets or technologies, so clients act faster, cut risk, and unlock growth.

The Leaderboard benchmarks and ranks top vendors, classifying them as Established Leaders, Leading Challengers, or Disruptors & Challengers.

Locates where complements amplify value and substitutes erode it, forecasting net impact by horizon

We deliver granular, decision-grade intel: market sizing, 5-year forecasts, pricing, adoption, usage, revenue, and operational KPIs—plus competitor tracking, regulation, and value chains—across 60 countries broadly.

Spot the shifts before they hit your P&L. We track inflection points, adoption curves, pricing moves, and ecosystem plays to show where demand is heading, why it is changing, and what to do next across high-growth markets and disruptive tech

Real-time reads of user behavior. We track shifting priorities, perceptions of today’s and next-gen services, and provider experience, then pace how fast tech moves from trial to adoption, blending buyer, consumer, and channel inputs with social signals (#WhySwitch, #UX).

Partner with our analyst team to build a custom report designed around your business priorities. From analysing market trends to assessing competitors or crafting bespoke datasets, we tailor insights to your needs.
Supplier Intelligence
Discovery & Profiling
Capacity & Footprint
Performance & Risk
Compliance & Governance
Commercial Readiness
Who Supplies Whom
Scorecards & Shortlists
Playbooks & Docs
Category Intelligence
Definition & Scope
Demand & Use Cases
Cost Drivers
Market Structure
Supply Chain Map
Trade & Policy
Operating Norms
Deliverables
Buyer Intelligence
Account Basics
Spend & Scope
Procurement Model
Vendor Requirements
Terms & Policies
Entry Strategy
Pain Points & Triggers
Outputs
Pricing Analysis
Benchmarks
Trends
Should-Cost
Indexation
Landed Cost
Commercial Terms
Deliverables
Brand Analysis
Positioning & Value Prop
Share & Presence
Customer Evidence
Go-to-Market
Digital & Reputation
Compliance & Trust
KPIs & Gaps
Outputs
Full Research Suite comprises of:
Market outlook & trends analysis
Interviews & case studies
Strategic recommendations
Vendor profiles & capabilities analysis
5-year forecasts
8 regions and 60+ country-level data splits
Market segment data splits
12 months of continuous data updates
DELIVERED AS:
PDF EXCEL ONLINE
Key Players & Market Share in Cellulose Film Packaging Market
Packaging Films Market Size and Share Forecast Outlook 2025 to 2035
Market Share Distribution Among Packaging Films Suppliers
Packaging Barrier Film Market Size and Share Forecast Outlook 2025 to 2035
Cellulose Diacetate Film Market Size and Share Forecast Outlook 2025 to 2035
Food Packaging Film Market Size and Share Forecast Outlook 2025 to 2035
Food Packaging Films Market Size and Share Forecast Outlook 2025 to 2035
MOPP Packaging Films Market Insights - Growth & Forecast 2025 to 2035
Market Share Breakdown of Food Packaging Film Providers
Meat Packaging Films Market
BOPET Packaging Films Market Size and Share Forecast Outlook 2025 to 2035
Green Packaging Film Market by Product Type, End Use, Material, and Region 2025 to 2035
Key Companies & Market Share in the Easy Peel Film Packaging Sector
Easy Peel Film Packaging Market Analysis by PP and PE Through 2034
Medical Packaging Films Market Size and Share Forecast Outlook 2025 to 2035
Hygiene Packaging Films Market Size and Share Forecast Outlook 2025 to 2035
Antifog Packaging Films Market Trends – Growth & Forecast 2025-2035
Nylon Films for Liquid Packaging Market from 2024 to 2034
Fiber Bale Packaging Film Market Analysis by Material Type, Thickness, End Use, and Region through 2025 to 2035
Key Companies & Market Share in the Fiber Bale Packaging Film Sector

Thank you!
You will receive an email from our Business Development Manager. Please be sure to check your SPAM/JUNK folder too.
Chat With
MaRIA