Synthetic Data Generation Market Outlook from 2025 to 2035

The synthetic data generation market is expanding rapidly due to increasing demand for high-quality, privacy-compliant datasets across artificial intelligence, machine learning, and analytics applications. Rising data privacy regulations and limitations on real-world data accessibility are prompting enterprises to adopt synthetic data solutions that replicate statistical accuracy without compromising confidentiality. The market is also benefiting from advancements in generative AI, deep learning, and computer vision technologies that enhance data realism and usability.

Growing investments in AI infrastructure and the need to reduce data bias and improve model performance are further accelerating adoption. Vendors are focusing on scalable generation platforms and integration capabilities with enterprise workflows.

The future outlook remains strong as industries including healthcare, finance, and autonomous systems increasingly depend on synthetic datasets for model training, testing, and validation This demand, combined with regulatory alignment and cost efficiency, is expected to sustain double-digit growth and strengthen the market’s strategic importance in the broader AI ecosystem.
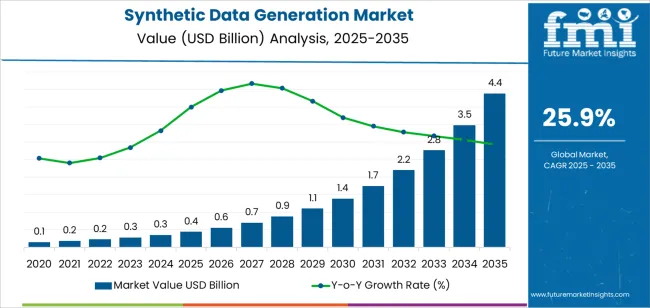
Quick Stats for Synthetic Data Generation Market

  • Synthetic Data Generation Market Industry Value (2025): USD 0.4 billion
  • Synthetic Data Generation Market Forecast Value (2035): USD 4.4 billion
  • Synthetic Data Generation Market Forecast CAGR: 25.9%
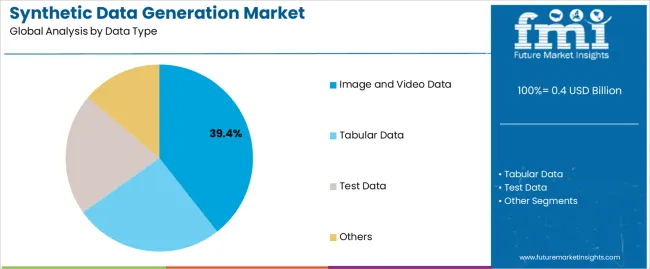
  • Leading Segment in Synthetic Data Generation Market in 2025: Image and Video Data (39.4%)
  • Key Growth Region in Synthetic Data Generation Market: North America, Asia-Pacific, Europe
  • Top Key Players in Synthetic Data Generation Market: NVIDIA Corporation, Mostly AI, CVEDIA Inc., Gretel Labs, Datagen, Synthesis AI, Amazon.com, Inc., Microsoft Corporation, IBM Corporation, Meta

Synthetic Data Generation Market Market Value Analysis

Metric Value
Synthetic Data Generation Market Estimated Value in (2025 E) USD 0.4 billion
Synthetic Data Generation Market Forecast Value in (2035 F) USD 4.4 billion
Forecast CAGR (2025 to 2035) 25.9%

Segmental Analysis

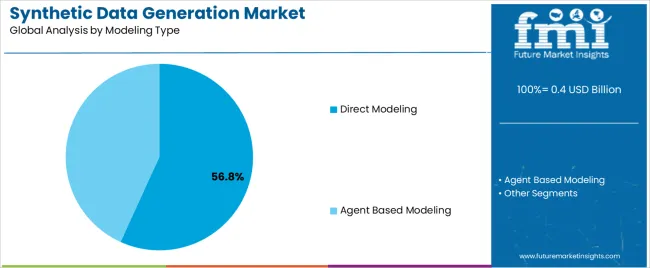
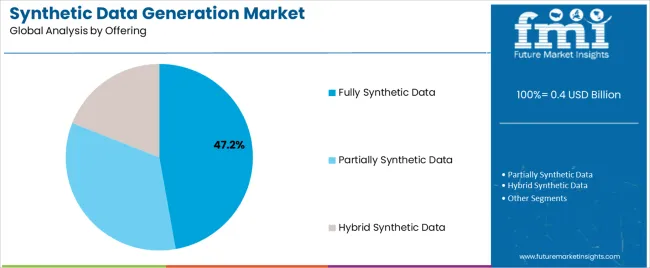
The market is segmented by Data Type, Modeling Type, Offering, Application, and End Use and region. By Data Type, the market is divided into Image and Video Data, Tabular Data, Test Data, and Others. In terms of Modeling Type, the market is classified into Direct Modeling and Agent Based Modeling. Based on Offering, the market is segmented into Fully Synthetic Data, Partially Synthetic Data, and Hybrid Synthetic Data. By Application, the market is divided into Predictive Analytics, Data Protection, Data Sharing, Natural Language Processing, Computer Vision Algorithms, and Others. By End Use, the market is segmented into Healthcare And Life Sciences, BFSI, Transportation And Logistics, IT And Telecommunication, Retail And E-Commerce, Manufacturing, Consumer Electronics, and Others. Regionally, the market is classified into North America, Latin America, Western Europe, Eastern Europe, Balkan & Baltic Countries, Russia & Belarus, Central Asia, East Asia, South Asia & Pacific, and the Middle East & Africa.
Insights into the Data Type Segment

Synthetic Data Generation Market Analysis By Data Type

The image and video data segment, accounting for 39.40% of the data type category, has maintained its lead due to the rising use of computer vision and deep learning algorithms across industries. The demand for synthetic visual data is being driven by applications in autonomous vehicles, surveillance systems, robotics, and medical imaging.

The segment’s dominance is supported by the ability of synthetic generation tools to create large-scale, annotated datasets that are difficult and costly to obtain through real-world collection. Enhanced simulation environments and improved generative adversarial network (GAN) architectures are ensuring greater data realism and diversity.

These developments have improved model training accuracy and operational safety for visual recognition systems As AI models continue to require more complex visual scenarios, the image and video data segment is expected to retain its leadership, supported by strong industrial demand and ongoing technological advancements.
Insights into the Modeling Type Segment

Synthetic Data Generation Market Analysis By Modeling Type

The direct modeling segment, holding 56.80% of the modeling type category, has emerged as the dominant approach due to its efficiency in replicating real-world data structures without extensive intermediary modeling processes. This method allows for faster generation of accurate datasets that reflect true data distributions.

Adoption is being driven by enterprises seeking scalable solutions to accelerate AI model development and deployment. The approach is also benefiting from continuous improvements in generative algorithms, which are enhancing fidelity, reducing computational costs, and minimizing error propagation.

Regulatory compliance requirements that restrict the use of sensitive real-world data have further encouraged the shift toward direct modeling With broader applicability across industries and superior performance in training complex algorithms, this segment is expected to maintain its leading position throughout the forecast period.
Insights into the Offering Segment

Synthetic Data Generation Market Analysis By Offering

The fully synthetic data segment, representing 47.20% of the offering category, is leading the market due to its comprehensive privacy protection and flexibility in use across diverse analytical and AI-driven applications. Organizations are increasingly relying on fully synthetic datasets to replace or supplement real data in model testing and validation.

The segment’s growth is supported by the ability to eliminate personal identifiers while maintaining data utility. Its scalability, cost-effectiveness, and compatibility with existing AI pipelines are enhancing adoption among enterprises focused on compliance and innovation.

Technological advancements enabling higher data accuracy and contextual integrity have further strengthened its appeal As synthetic data becomes integral to AI lifecycle management and responsible data governance, the fully synthetic data segment is expected to continue its upward trajectory and remain the preferred offering within the synthetic data generation market.

Key Market Trends and Highlights

Organizations across industries are increasingly relying on data driven decision making processes to gain insights, improve operations, and drive innovation. Synthetic data generation enables organizations to access diverse datasets for analysis and decision making, empowering them to derive actionable insights and stay competitive in the market.

  • Data augmentation techniques, including synthetic data generation, play a crucial role in enhancing the performance and robustness of AI and ML models. Organizations can improve model generalization, reduce overfitting, and enhance model performance across different scenarios and conditions, by augmenting training datasets with synthetic data.
  • There is a growing need for synthetic data to train and test AI models deployed in edge environments, with the proliferation of edge computing and Internet of Things devices. Synthetic data enables organizations to simulate diverse edge scenarios and environments, facilitating the development and deployment of AI powered applications and services at the edge.
  • Synthetic data generation can be integrated with automated data labeling techniques, reducing the manual effort required for data annotation. Automated labeling streamlines the process of preparing training datasets for machine learning models, enhancing efficiency and scalability.

2020 to 2024 Historical Analysis vs. 2025 to 2035 Market Forecast Projections

The scope for synthetic data generation rose at a 50.5% CAGR between 2020 and 2025. The global market is anticipated to grow at a moderate CAGR of 45.9% over the forecast period 2025 to 2035.

The market experienced significant growth during the historical period, driven by increasing adoption of artificial intelligence and machine learning technologies across various industries.

Factors such as growing concerns about data privacy and security, advancements in AI and ML algorithms, and the need for diverse and high quality datasets for model training and testing contributed to the expansion of the market.

Organizations recognized the benefits of synthetic data generation in addressing data scarcity, reducing data labeling costs, and accelerating the development and deployment of AI powered applications and services.

The forecast period is expected to witness continued growth and evolution of the market, driven by emerging trends, technological advancements, and evolving business requirements.

Factors such as the proliferation of edge computing and Internet of Things devices, the integration of synthetic data with emerging technologies like quantum computing and blockchain, and the rise of vertical specific solutions are likely to shape the market landscape.

Increased emphasis on real time data generation, cross platform compatibility, and integration with simulation technologies are anticipated to drive demand for synthetic data generation solutions across industries.

Regulatory compliance, ethical considerations, and data governance will remain critical factors influencing market dynamics, as organizations strive to ensure transparency, accountability, and trustworthiness in synthetic data generation processes.

Synthetic Data Generation Market Key Drivers

Synthetic data offers a solution by generating data that mirrors real data but contains no personally identifiable information or sensitive data, with increasing concerns about data privacy and security. Organizations seek alternatives to handle data safely, fueling the demand for synthetic data, as regulations like GDPR and CCPA become more stringent.

  • Synthetic data generation provides a scalable and cost effective approach to generate large volumes of data for various applications such as machine learning model training, testing, and validation. Generating synthetic data eliminates the need to collect and label large datasets manually, reducing costs and time associated with traditional data collection methods.
  • The rapid advancements in artificial intelligence and machine learning technologies drive the need for diverse and high quality datasets to train and validate models effectively. Synthetic data generation techniques leverage AI and ML algorithms to create realistic and diverse datasets that mimic real world scenarios, addressing the demand for data diversity and quality.
  • Various industries such as healthcare, automotive, retail, finance, and cybersecurity are increasingly adopting synthetic data to address specific challenges and requirements. For instance, in healthcare, synthetic data enables researchers and healthcare professionals to conduct data driven research and develop innovative healthcare solutions without compromising patient privacy.

Challenges in the Synthetic Data Generation Market

Despite advancements in synthetic data generation techniques, ensuring the quality and realism of synthetic datasets remains a challenge. Synthetic data may not always accurately reflect the complexity and variability of real world data, leading to limitations in model performance and generalization.

  • The use of synthetic data raises ethical considerations regarding data privacy, consent, and potential biases embedded in generated datasets. Regulatory frameworks governing data usage and protection, such as GDPR and CCPA, may impose restrictions on the generation and usage of synthetic data, hindering its adoption and scalability.
  • While synthetic data generation holds promise across a wide range of industries, certain sectors may exhibit reluctance or skepticism towards adopting synthetic data due to industry specific challenges, regulatory constraints, or cultural factors. Industries with stringent data privacy and security requirements, such as healthcare and finance, may be particularly cautious about adopting synthetic data solutions.
  • Validating and evaluating machine learning models trained on synthetic data pose unique challenges, including the lack of ground truth labels and the difficulty of assessing model performance across diverse real world scenarios. Ensuring the reliability and robustness of models trained on synthetic data requires sophisticated validation methodologies and comprehensive testing frameworks.

Country-wise Insights

The below table showcases revenues in terms of the top 5 leading countries, spearheaded by Korea and the United Kingdom. The countries are expected to lead the market through 2035.

Countries Forecast CAGRs from 2025 to 2035
The United States 46.2%
The United Kingdom 47.2%
China 46.8%
Japan 47.0%
Korea 47.3%

Rising Demand for Data Privacy and Security Solutions Driving the Market in the United States

The synthetic data generation market in the United States expected to expand at a CAGR of 46.2% through 2035. Organizations in the United States are seeking alternative solutions to protect sensitive information while still being able to innovate and leverage data for various applications, with increasing concerns about data privacy and security.

Synthetic data generation offers a privacy preserving approach to data management, allowing organizations to generate synthetic datasets that mirror real data without exposing personally identifiable information or sensitive data.

The country is a global leader in artificial intelligence and machine learning research and development. There is a growing demand for diverse and high quality datasets to train and validate models, as organizations in various industries continue to adopt AI and ML technologies for data driven decision making. Synthetic data generation techniques enable the creation of large scale, diverse datasets for AI and ML applications, driving the adoption of synthetic data solutions in the United States.

Technological Advancements to Accelerate Market Growth in the United Kingdom

The synthetic data generation market in the United Kingdom is anticipated to expand at a CAGR of 47.2% through 2035. The country is home to a thriving technology sector with significant investments in artificial intelligence, machine learning, and data analytics.

Technological advancements in synthetic data generation techniques, including generative adversarial networks and variational autoencoders, enable the creation of realistic and diverse synthetic datasets. The advancements drive the adoption of synthetic data solutions across industries in the country.

Various industries in the country, including finance, healthcare, retail, and automotive, leverage synthetic data generation for a wide range of applications. In finance, synthetic data is used for risk modeling, fraud detection, and algorithmic trading. In healthcare, synthetic data facilitates research, drug discovery, and clinical trials. Industry specific applications drive the demand for synthetic data solutions tailored to the unique requirements of each sector.

Government Support and Initiatives Spearhead the Market in China

Synthetic data generation trends in China are taking a turn for the better. A 46.8% CAGR is forecast for the country from 2025 to 2035. The Chinese government has prioritized investments in AI, big data, and digital technologies as part of its national development strategies.

Government initiatives, funding programs, and policies support the development and adoption of synthetic data generation technologies in China. Government support creates a conducive environment for innovation, research, and market growth in the synthetic data generation sector.

Chinese industries are undergoing digital transformation and embracing Industry 4.0 principles to enhance efficiency, productivity, and competitiveness. Synthetic data generation plays a crucial role in digital transformation initiatives by enabling data driven decision making, predictive analytics, and automation. The demand for synthetic data solutions is expected to grow in China, as industries adopt advanced technologies and embrace data driven approaches.

Research and Development Initiatives Fueling the Market in Japan

The synthetic data generation market in Japan is poised to expand at a CAGR of 47.0% through 2035. Japan is home to renowned research institutions, universities, and technology companies that prioritize research and development initiatives.

Synthetic data generation enables researchers and innovators to access and analyze diverse datasets for experimentation, modeling, and hypothesis testing. The availability of synthetic data accelerates innovation and fosters collaboration across academia, industry, and government sectors.

Collaboration among industry stakeholders, research institutions, and government agencies fosters innovation and accelerates the adoption of synthetic data solutions in Japan. Cross industry partnerships enable knowledge sharing, technology transfer, and collaborative research and development efforts focused on synthetic data generation techniques and applications.

The collaborative ecosystem promotes the development and commercialization of synthetic data solutions tailored to Japanese market needs.

Startup Ecosystem and Entrepreneurship Driving the Demand in Korea

The synthetic data generation market in Korea is anticipated to expand at a CAGR of 47.3% through 2035. Korea has a vibrant startup ecosystem with a thriving community of entrepreneurs, innovators, and technology startups. Startup companies specializing in artificial intelligence, data analytics, and digital technologies develop innovative solutions and services in synthetic data generation.

The presence of startups contributes to the growth and diversification of the synthetic data generation market, fostering competition, innovation, and entrepreneurship in Korea.

Korea is increasingly focusing on precision medicine and healthcare innovation, leveraging advanced technologies such as genomics, bioinformatics, and personalized medicine. Synthetic data generation plays a crucial role in generating synthetic patient data for research, drug discovery, and clinical trials in precision medicine. The integration of synthetic data solutions with healthcare innovation initiatives drives advancements in medical research, patient care, and disease management in Korea.

Category-wise Insights

The below table highlights how tabular data segment is projected to lead the market in terms of product type, and is expected to account for a CAGR of 45.7% through 2035.

Based on technique, the sandwich assays segment is expected to account for a CAGR of 45.5% through 2035.

Category CAGR through 2035
Tabular Data 45.7%
Sandwich Assays 45.5%

Tabular Data Claim High Demand for Synthetic Data Generation

Based on data type, the tabular data segment is expected to continue dominating the synthetic data generation market. Organizations across industries are increasingly concerned about data privacy and regulatory compliance. Tabular data, which often includes personally identifiable information and sensitive data, presents challenges in terms of privacy protection and compliance with regulations such as GDPR and CCPA.

Synthetic data generation offers a solution by generating privacy preserving synthetic tabular datasets that mimic the statistical properties of real data without exposing sensitive information.

Tabular data is ubiquitous in various domains, including finance, healthcare, retail, and marketing. Synthetic data generation techniques enable the creation of diverse and representative tabular datasets that capture the underlying patterns, correlations, and distributions present in real world data. Organizations can augment their datasets, address data scarcity issues, and improve the robustness and generalization of machine learning models, by generating synthetic tabular data.

Direct Modeling Segment to Hold High Demand for Synthetic Data Generation

In terms of modeling type, the direct modeling segment is expected to continue dominating the synthetic data generation market, attributed to several key factors. Direct modeling techniques offer flexibility and customization options for generating synthetic data.

Organizations can specify the underlying data distributions, correlations, and relationships directly through modeling algorithms and parameters. The flexibility allows users to tailor synthetic datasets to specific use cases, domains, and analytical requirements, enhancing the relevance and applicability of generated data.

Direct modeling techniques enable the generation of synthetic data for complex data types and structures, including images, videos, time series, and 3D models. The techniques leverage advanced algorithms such as generative adversarial networks, variational autoencoders, and deep learning architectures to model the underlying data distributions and generate realistic synthetic samples.

Direct modeling facilitates the creation of high fidelity synthetic data that closely resembles real world data, enabling applications in computer vision, natural language processing, and other domains.
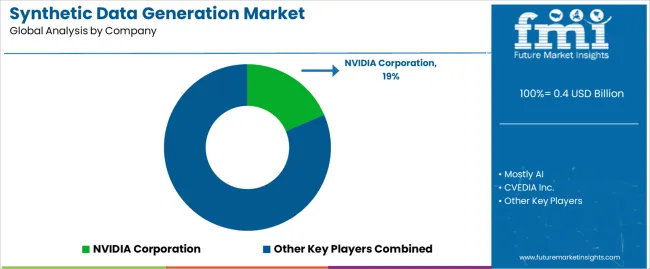
Competitive Landscape

Synthetic Data Generation Market Analysis By Company

The competitive landscape of the synthetic data generation market is characterized by intense competition among established players, emerging startups, and technology giants offering a diverse range of synthetic data generation solutions and services.

Company Portfolio

  • Mostly AI specializes in synthetic data generation solutions for privacy preserving data analytics. Their platform enables the creation of synthetic data sets that mimic the characteristics of real data while ensuring privacy and compliance with regulations.
  • CVEDIA Inc. offers synthetic data generation services for computer vision applications. They create synthetic images and videos to train and test machine learning models for various industries, including automotive, robotics, and surveillance.

Key Coverage in the Synthetic Data Generation Industry Report

  • Synthetic data generation techniques
  • Privacy-preserving synthetic data
  • Artificial data generation solutions
  • Data augmentation for machine learning
  • Synthetic data for AI training
  • Generative adversarial networks (GANs) for data generation
  • Synthetic data for computer vision applications
  • High-fidelity synthetic datasets
  • Data anonymization and masking
  • Synthetic data generation platforms
  • Realistic synthetic data simulation
  • Diverse synthetic datasets for analytics
  • Scalable synthetic data generation methods
  • Regulatory compliant synthetic data
  • Synthetic data for predictive modeling
  • Data Augmentation Market
  • Data Privacy Solutions Market
  • Artificial Intelligence Market
  • Data Anonymization Market
  • Machine Learning as a Service Market
  • Computer Vision Market

Report Scope

Attribute Details
Estimated Market Size in 2025 USD 0.4 billion
Projected Market Valuation in 2035 USD 4.4 billion
Value-based CAGR 2025 to 2035 25.9%
Forecast Period 2025 to 2035
Historical Data Available for 2020 to 2025
Market Analysis Value in USD Billion
Key Regions Covered North America; Latin America; Western Europe; Eastern Europe; South Asia and Pacific; East Asia; The Middle East & Africa
Key Market Segments Covered Data Type, Modeling Type, Offering, Application, End Use, Region
Key Countries Profiled The United States, Canada, Brazil, Mexico, Germany, France, France, Spain, Italy, Russia, Poland, Czech Republic, Romania, India, Bangladesh, Australia, New Zealand, China, Japan, South Korea, GCC countries, South Africa, Israel
Key Companies Profiled Mostly AI; CVEDIA Inc.; Gretel Labs; Datagen; NVIDIA Corporation; Synthesis AI; Amazon.com, Inc.; Microsoft Corporation; IBM Corporation; Meta

Segmentation Analysis of the Synthetic Data Generation Market

By Data Type:

  • Tabular Data
  • Test Data
  • Image and Video Data
  • Others

By Modeling Type:

  • Direct Modeling
  • Agent Based Modeling

By Offering:

  • Fully Synthetic Data
  • Partially Synthetic Data
  • Hybrid Synthetic Data

By Application:

  • Data Protection
  • Data Sharing
  • Predictive Analytics
  • Natural Language Processing
  • Computer Vision Algorithms
  • Others

By End Use:

  • BFSI
  • Healthcare and Life Sciences
  • Transportation and Logistics
  • IT and Telecommunication
  • Retail and E-Commerce
  • Manufacturing
  • Consumer Electronics
  • Others

By Region:

  • North America
  • Latin America
  • Western Europe
  • Eastern Europe
  • South Asia and Pacific
  • East Asia
  • The Middle East and Africa

Frequently Asked Questions

How big is the synthetic data generation market in 2025?

The global synthetic data generation market is estimated to be valued at USD 0.4 billion in 2025.

What will be the size of synthetic data generation market in 2035?

The market size for the synthetic data generation market is projected to reach USD 4.4 billion by 2035.

How much will be the synthetic data generation market growth between 2025 and 2035?

The synthetic data generation market is expected to grow at a 25.9% CAGR between 2025 and 2035.

What are the key product types in the synthetic data generation market?

The key product types in synthetic data generation market are image and video data, tabular data, test data and others.

Which modeling type segment to contribute significant share in the synthetic data generation market in 2025?

In terms of modeling type, direct modeling segment to command 56.8% share in the synthetic data generation market in 2025.

Table of Content

  1. Executive Summary
    • Global Market Outlook
    • Demand to side Trends
    • Supply to side Trends
    • Technology Roadmap Analysis
    • Analysis and Recommendations
  2. Market Overview
    • Market Coverage / Taxonomy
    • Market Definition / Scope / Limitations
  3. Market Background
    • Market Dynamics
      • Drivers
      • Restraints
      • Opportunity
      • Trends
    • Scenario Forecast
      • Demand in Optimistic Scenario
      • Demand in Likely Scenario
      • Demand in Conservative Scenario
    • Opportunity Map Analysis
    • Product Life Cycle Analysis
    • Supply Chain Analysis
    • Investment Feasibility Matrix
    • Value Chain Analysis
    • PESTLE and Porter’s Analysis
    • Regulatory Landscape
    • Regional Parent Market Outlook
    • Production and Consumption Statistics
    • Import and Export Statistics
  4. Global Market Analysis 2020 to 2024 and Forecast, 2025 to 2035
    • Historical Market Size Value (USD Million) Analysis, 2020 to 2024
    • Current and Future Market Size Value (USD Million) Projections, 2025 to 2035
      • Y to o to Y Growth Trend Analysis
      • Absolute $ Opportunity Analysis
  5. Global Market Pricing Analysis 2020 to 2024 and Forecast 2025 to 2035
  6. Global Market Analysis 2020 to 2024 and Forecast 2025 to 2035, By Data Type
    • Introduction / Key Findings
    • Historical Market Size Value (USD Million) Analysis By Data Type , 2020 to 2024
    • Current and Future Market Size Value (USD Million) Analysis and Forecast By Data Type , 2025 to 2035
      • Image and Video Data
      • Tabular Data
      • Test Data
      • Others
    • Y to o to Y Growth Trend Analysis By Data Type , 2020 to 2024
    • Absolute $ Opportunity Analysis By Data Type , 2025 to 2035
  7. Global Market Analysis 2020 to 2024 and Forecast 2025 to 2035, By Modeling Type
    • Introduction / Key Findings
    • Historical Market Size Value (USD Million) Analysis By Modeling Type, 2020 to 2024
    • Current and Future Market Size Value (USD Million) Analysis and Forecast By Modeling Type, 2025 to 2035
      • Direct Modeling
      • Agent Based Modeling
    • Y to o to Y Growth Trend Analysis By Modeling Type, 2020 to 2024
    • Absolute $ Opportunity Analysis By Modeling Type, 2025 to 2035
  8. Global Market Analysis 2020 to 2024 and Forecast 2025 to 2035, By Offering
    • Introduction / Key Findings
    • Historical Market Size Value (USD Million) Analysis By Offering, 2020 to 2024
    • Current and Future Market Size Value (USD Million) Analysis and Forecast By Offering, 2025 to 2035
      • Fully Synthetic Data
      • Partially Synthetic Data
      • Hybrid Synthetic Data
    • Y to o to Y Growth Trend Analysis By Offering, 2020 to 2024
    • Absolute $ Opportunity Analysis By Offering, 2025 to 2035
  9. Global Market Analysis 2020 to 2024 and Forecast 2025 to 2035, By Application
    • Introduction / Key Findings
    • Historical Market Size Value (USD Million) Analysis By Application, 2020 to 2024
    • Current and Future Market Size Value (USD Million) Analysis and Forecast By Application, 2025 to 2035
      • Predictive Analytics
      • Data Protection
      • Data Sharing
      • Natural Language Processing
      • Computer Vision Algorithms
      • Others
    • Y to o to Y Growth Trend Analysis By Application, 2020 to 2024
    • Absolute $ Opportunity Analysis By Application, 2025 to 2035
  10. Global Market Analysis 2020 to 2024 and Forecast 2025 to 2035, By End Use
    • Introduction / Key Findings
    • Historical Market Size Value (USD Million) Analysis By End Use, 2020 to 2024
    • Current and Future Market Size Value (USD Million) Analysis and Forecast By End Use, 2025 to 2035
      • Healthcare And Life Sciences
      • BFSI
      • Transportation And Logistics
      • IT And Telecommunication
      • Retail And E-Commerce
      • Manufacturing
      • Consumer Electronics
      • Others
    • Y to o to Y Growth Trend Analysis By End Use, 2020 to 2024
    • Absolute $ Opportunity Analysis By End Use, 2025 to 2035
  11. Global Market Analysis 2020 to 2024 and Forecast 2025 to 2035, By Region
    • Introduction
    • Historical Market Size Value (USD Million) Analysis By Region, 2020 to 2024
    • Current Market Size Value (USD Million) Analysis and Forecast By Region, 2025 to 2035
      • North America
      • Latin America
      • Western Europe
      • Eastern Europe
      • East Asia
      • South Asia and Pacific
      • Middle East & Africa
    • Market Attractiveness Analysis By Region
  12. North America Market Analysis 2020 to 2024 and Forecast 2025 to 2035, By Country
    • Historical Market Size Value (USD Million) Trend Analysis By Market Taxonomy, 2020 to 2024
    • Market Size Value (USD Million) Forecast By Market Taxonomy, 2025 to 2035
      • By Country
        • USA
        • Canada
        • Mexico
      • By Data Type
      • By Modeling Type
      • By Offering
      • By Application
      • By End Use
    • Market Attractiveness Analysis
      • By Country
      • By Data Type
      • By Modeling Type
      • By Offering
      • By Application
      • By End Use
    • Key Takeaways
  13. Latin America Market Analysis 2020 to 2024 and Forecast 2025 to 2035, By Country
    • Historical Market Size Value (USD Million) Trend Analysis By Market Taxonomy, 2020 to 2024
    • Market Size Value (USD Million) Forecast By Market Taxonomy, 2025 to 2035
      • By Country
        • Brazil
        • Chile
        • Rest of Latin America
      • By Data Type
      • By Modeling Type
      • By Offering
      • By Application
      • By End Use
    • Market Attractiveness Analysis
      • By Country
      • By Data Type
      • By Modeling Type
      • By Offering
      • By Application
      • By End Use
    • Key Takeaways
  14. Western Europe Market Analysis 2020 to 2024 and Forecast 2025 to 2035, By Country
    • Historical Market Size Value (USD Million) Trend Analysis By Market Taxonomy, 2020 to 2024
    • Market Size Value (USD Million) Forecast By Market Taxonomy, 2025 to 2035
      • By Country
        • Germany
        • UK
        • Italy
        • Spain
        • France
        • Nordic
        • BENELUX
        • Rest of Western Europe
      • By Data Type
      • By Modeling Type
      • By Offering
      • By Application
      • By End Use
    • Market Attractiveness Analysis
      • By Country
      • By Data Type
      • By Modeling Type
      • By Offering
      • By Application
      • By End Use
    • Key Takeaways
  15. Eastern Europe Market Analysis 2020 to 2024 and Forecast 2025 to 2035, By Country
    • Historical Market Size Value (USD Million) Trend Analysis By Market Taxonomy, 2020 to 2024
    • Market Size Value (USD Million) Forecast By Market Taxonomy, 2025 to 2035
      • By Country
        • Russia
        • Poland
        • Hungary
        • Balkan & Baltic
        • Rest of Eastern Europe
      • By Data Type
      • By Modeling Type
      • By Offering
      • By Application
      • By End Use
    • Market Attractiveness Analysis
      • By Country
      • By Data Type
      • By Modeling Type
      • By Offering
      • By Application
      • By End Use
    • Key Takeaways
  16. East Asia Market Analysis 2020 to 2024 and Forecast 2025 to 2035, By Country
    • Historical Market Size Value (USD Million) Trend Analysis By Market Taxonomy, 2020 to 2024
    • Market Size Value (USD Million) Forecast By Market Taxonomy, 2025 to 2035
      • By Country
        • China
        • Japan
        • South Korea
      • By Data Type
      • By Modeling Type
      • By Offering
      • By Application
      • By End Use
    • Market Attractiveness Analysis
      • By Country
      • By Data Type
      • By Modeling Type
      • By Offering
      • By Application
      • By End Use
    • Key Takeaways
  17. South Asia and Pacific Market Analysis 2020 to 2024 and Forecast 2025 to 2035, By Country
    • Historical Market Size Value (USD Million) Trend Analysis By Market Taxonomy, 2020 to 2024
    • Market Size Value (USD Million) Forecast By Market Taxonomy, 2025 to 2035
      • By Country
        • India
        • ASEAN
        • Australia & New Zealand
        • Rest of South Asia and Pacific
      • By Data Type
      • By Modeling Type
      • By Offering
      • By Application
      • By End Use
    • Market Attractiveness Analysis
      • By Country
      • By Data Type
      • By Modeling Type
      • By Offering
      • By Application
      • By End Use
    • Key Takeaways
  18. Middle East & Africa Market Analysis 2020 to 2024 and Forecast 2025 to 2035, By Country
    • Historical Market Size Value (USD Million) Trend Analysis By Market Taxonomy, 2020 to 2024
    • Market Size Value (USD Million) Forecast By Market Taxonomy, 2025 to 2035
      • By Country
        • Kingdom of Saudi Arabia
        • Other GCC Countries
        • Turkiye
        • South Africa
        • Other African Union
        • Rest of Middle East & Africa
      • By Data Type
      • By Modeling Type
      • By Offering
      • By Application
      • By End Use
    • Market Attractiveness Analysis
      • By Country
      • By Data Type
      • By Modeling Type
      • By Offering
      • By Application
      • By End Use
    • Key Takeaways
  19. Key Countries Market Analysis
    • USA
      • Pricing Analysis
      • Market Share Analysis, 2024
        • By Data Type
        • By Modeling Type
        • By Offering
        • By Application
        • By End Use
    • Canada
      • Pricing Analysis
      • Market Share Analysis, 2024
        • By Data Type
        • By Modeling Type
        • By Offering
        • By Application
        • By End Use
    • Mexico
      • Pricing Analysis
      • Market Share Analysis, 2024
        • By Data Type
        • By Modeling Type
        • By Offering
        • By Application
        • By End Use
    • Brazil
      • Pricing Analysis
      • Market Share Analysis, 2024
        • By Data Type
        • By Modeling Type
        • By Offering
        • By Application
        • By End Use
    • Chile
      • Pricing Analysis
      • Market Share Analysis, 2024
        • By Data Type
        • By Modeling Type
        • By Offering
        • By Application
        • By End Use
    • Germany
      • Pricing Analysis
      • Market Share Analysis, 2024
        • By Data Type
        • By Modeling Type
        • By Offering
        • By Application
        • By End Use
    • UK
      • Pricing Analysis
      • Market Share Analysis, 2024
        • By Data Type
        • By Modeling Type
        • By Offering
        • By Application
        • By End Use
    • Italy
      • Pricing Analysis
      • Market Share Analysis, 2024
        • By Data Type
        • By Modeling Type
        • By Offering
        • By Application
        • By End Use
    • Spain
      • Pricing Analysis
      • Market Share Analysis, 2024
        • By Data Type
        • By Modeling Type
        • By Offering
        • By Application
        • By End Use
    • France
      • Pricing Analysis
      • Market Share Analysis, 2024
        • By Data Type
        • By Modeling Type
        • By Offering
        • By Application
        • By End Use
    • India
      • Pricing Analysis
      • Market Share Analysis, 2024
        • By Data Type
        • By Modeling Type
        • By Offering
        • By Application
        • By End Use
    • ASEAN
      • Pricing Analysis
      • Market Share Analysis, 2024
        • By Data Type
        • By Modeling Type
        • By Offering
        • By Application
        • By End Use
    • Australia & New Zealand
      • Pricing Analysis
      • Market Share Analysis, 2024
        • By Data Type
        • By Modeling Type
        • By Offering
        • By Application
        • By End Use
    • China
      • Pricing Analysis
      • Market Share Analysis, 2024
        • By Data Type
        • By Modeling Type
        • By Offering
        • By Application
        • By End Use
    • Japan
      • Pricing Analysis
      • Market Share Analysis, 2024
        • By Data Type
        • By Modeling Type
        • By Offering
        • By Application
        • By End Use
    • South Korea
      • Pricing Analysis
      • Market Share Analysis, 2024
        • By Data Type
        • By Modeling Type
        • By Offering
        • By Application
        • By End Use
    • Russia
      • Pricing Analysis
      • Market Share Analysis, 2024
        • By Data Type
        • By Modeling Type
        • By Offering
        • By Application
        • By End Use
    • Poland
      • Pricing Analysis
      • Market Share Analysis, 2024
        • By Data Type
        • By Modeling Type
        • By Offering
        • By Application
        • By End Use
    • Hungary
      • Pricing Analysis
      • Market Share Analysis, 2024
        • By Data Type
        • By Modeling Type
        • By Offering
        • By Application
        • By End Use
    • Kingdom of Saudi Arabia
      • Pricing Analysis
      • Market Share Analysis, 2024
        • By Data Type
        • By Modeling Type
        • By Offering
        • By Application
        • By End Use
    • Turkiye
      • Pricing Analysis
      • Market Share Analysis, 2024
        • By Data Type
        • By Modeling Type
        • By Offering
        • By Application
        • By End Use
    • South Africa
      • Pricing Analysis
      • Market Share Analysis, 2024
        • By Data Type
        • By Modeling Type
        • By Offering
        • By Application
        • By End Use
  20. Market Structure Analysis
    • Competition Dashboard
    • Competition Benchmarking
    • Market Share Analysis of Top Players
      • By Regional
      • By Data Type
      • By Modeling Type
      • By Offering
      • By Application
      • By End Use
  21. Competition Analysis
    • Competition Deep Dive
      • NVIDIA Corporation
        • Overview
        • Product Portfolio
        • Profitability by Market Segments (Product/Age /Sales Channel/Region)
        • Sales Footprint
        • Strategy Overview
          • Marketing Strategy
          • Product Strategy
          • Channel Strategy
      • Mostly AI
      • CVEDIA Inc.
      • Gretel Labs
      • Datagen
      • Synthesis AI
      • Amazon.com, Inc.
      • Microsoft Corporation
      • IBM Corporation
      • Meta
  22. Assumptions & Acronyms Used
  23. Research Methodology

List of Tables

  • Table 1: Global Market Value (USD Million) Forecast by Region, 2020 to 2035
  • Table 2: Global Market Value (USD Million) Forecast by Data Type , 2020 to 2035
  • Table 3: Global Market Value (USD Million) Forecast by Modeling Type, 2020 to 2035
  • Table 4: Global Market Value (USD Million) Forecast by Offering, 2020 to 2035
  • Table 5: Global Market Value (USD Million) Forecast by Application, 2020 to 2035
  • Table 6: Global Market Value (USD Million) Forecast by End Use, 2020 to 2035
  • Table 7: North America Market Value (USD Million) Forecast by Country, 2020 to 2035
  • Table 8: North America Market Value (USD Million) Forecast by Data Type , 2020 to 2035
  • Table 9: North America Market Value (USD Million) Forecast by Modeling Type, 2020 to 2035
  • Table 10: North America Market Value (USD Million) Forecast by Offering, 2020 to 2035
  • Table 11: North America Market Value (USD Million) Forecast by Application, 2020 to 2035
  • Table 12: North America Market Value (USD Million) Forecast by End Use, 2020 to 2035
  • Table 13: Latin America Market Value (USD Million) Forecast by Country, 2020 to 2035
  • Table 14: Latin America Market Value (USD Million) Forecast by Data Type , 2020 to 2035
  • Table 15: Latin America Market Value (USD Million) Forecast by Modeling Type, 2020 to 2035
  • Table 16: Latin America Market Value (USD Million) Forecast by Offering, 2020 to 2035
  • Table 17: Latin America Market Value (USD Million) Forecast by Application, 2020 to 2035
  • Table 18: Latin America Market Value (USD Million) Forecast by End Use, 2020 to 2035
  • Table 19: Western Europe Market Value (USD Million) Forecast by Country, 2020 to 2035
  • Table 20: Western Europe Market Value (USD Million) Forecast by Data Type , 2020 to 2035
  • Table 21: Western Europe Market Value (USD Million) Forecast by Modeling Type, 2020 to 2035
  • Table 22: Western Europe Market Value (USD Million) Forecast by Offering, 2020 to 2035
  • Table 23: Western Europe Market Value (USD Million) Forecast by Application, 2020 to 2035
  • Table 24: Western Europe Market Value (USD Million) Forecast by End Use, 2020 to 2035
  • Table 25: Eastern Europe Market Value (USD Million) Forecast by Country, 2020 to 2035
  • Table 26: Eastern Europe Market Value (USD Million) Forecast by Data Type , 2020 to 2035
  • Table 27: Eastern Europe Market Value (USD Million) Forecast by Modeling Type, 2020 to 2035
  • Table 28: Eastern Europe Market Value (USD Million) Forecast by Offering, 2020 to 2035
  • Table 29: Eastern Europe Market Value (USD Million) Forecast by Application, 2020 to 2035
  • Table 30: Eastern Europe Market Value (USD Million) Forecast by End Use, 2020 to 2035
  • Table 31: East Asia Market Value (USD Million) Forecast by Country, 2020 to 2035
  • Table 32: East Asia Market Value (USD Million) Forecast by Data Type , 2020 to 2035
  • Table 33: East Asia Market Value (USD Million) Forecast by Modeling Type, 2020 to 2035
  • Table 34: East Asia Market Value (USD Million) Forecast by Offering, 2020 to 2035
  • Table 35: East Asia Market Value (USD Million) Forecast by Application, 2020 to 2035
  • Table 36: East Asia Market Value (USD Million) Forecast by End Use, 2020 to 2035
  • Table 37: South Asia and Pacific Market Value (USD Million) Forecast by Country, 2020 to 2035
  • Table 38: South Asia and Pacific Market Value (USD Million) Forecast by Data Type , 2020 to 2035
  • Table 39: South Asia and Pacific Market Value (USD Million) Forecast by Modeling Type, 2020 to 2035
  • Table 40: South Asia and Pacific Market Value (USD Million) Forecast by Offering, 2020 to 2035
  • Table 41: South Asia and Pacific Market Value (USD Million) Forecast by Application, 2020 to 2035
  • Table 42: South Asia and Pacific Market Value (USD Million) Forecast by End Use, 2020 to 2035
  • Table 43: Middle East & Africa Market Value (USD Million) Forecast by Country, 2020 to 2035
  • Table 44: Middle East & Africa Market Value (USD Million) Forecast by Data Type , 2020 to 2035
  • Table 45: Middle East & Africa Market Value (USD Million) Forecast by Modeling Type, 2020 to 2035
  • Table 46: Middle East & Africa Market Value (USD Million) Forecast by Offering, 2020 to 2035
  • Table 47: Middle East & Africa Market Value (USD Million) Forecast by Application, 2020 to 2035
  • Table 48: Middle East & Africa Market Value (USD Million) Forecast by End Use, 2020 to 2035

List of Figures

  • Figure 1: Global Market Pricing Analysis
  • Figure 2: Global Market Value (USD Million) Forecast 2020-2035
  • Figure 3: Global Market Value Share and BPS Analysis by Data Type , 2025 and 2035
  • Figure 4: Global Market Y to o to Y Growth Comparison by Data Type , 2025-2035
  • Figure 5: Global Market Attractiveness Analysis by Data Type
  • Figure 6: Global Market Value Share and BPS Analysis by Modeling Type, 2025 and 2035
  • Figure 7: Global Market Y to o to Y Growth Comparison by Modeling Type, 2025-2035
  • Figure 8: Global Market Attractiveness Analysis by Modeling Type
  • Figure 9: Global Market Value Share and BPS Analysis by Offering, 2025 and 2035
  • Figure 10: Global Market Y to o to Y Growth Comparison by Offering, 2025-2035
  • Figure 11: Global Market Attractiveness Analysis by Offering
  • Figure 12: Global Market Value Share and BPS Analysis by Application, 2025 and 2035
  • Figure 13: Global Market Y to o to Y Growth Comparison by Application, 2025-2035
  • Figure 14: Global Market Attractiveness Analysis by Application
  • Figure 15: Global Market Value Share and BPS Analysis by End Use, 2025 and 2035
  • Figure 16: Global Market Y to o to Y Growth Comparison by End Use, 2025-2035
  • Figure 17: Global Market Attractiveness Analysis by End Use
  • Figure 18: Global Market Value (USD Million) Share and BPS Analysis by Region, 2025 and 2035
  • Figure 19: Global Market Y to o to Y Growth Comparison by Region, 2025-2035
  • Figure 20: Global Market Attractiveness Analysis by Region
  • Figure 21: North America Market Incremental Dollar Opportunity, 2025-2035
  • Figure 22: Latin America Market Incremental Dollar Opportunity, 2025-2035
  • Figure 23: Western Europe Market Incremental Dollar Opportunity, 2025-2035
  • Figure 24: Eastern Europe Market Incremental Dollar Opportunity, 2025-2035
  • Figure 25: East Asia Market Incremental Dollar Opportunity, 2025-2035
  • Figure 26: South Asia and Pacific Market Incremental Dollar Opportunity, 2025-2035
  • Figure 27: Middle East & Africa Market Incremental Dollar Opportunity, 2025-2035
  • Figure 28: North America Market Value Share and BPS Analysis by Country, 2025 and 2035
  • Figure 29: North America Market Value Share and BPS Analysis by Data Type , 2025 and 2035
  • Figure 30: North America Market Y to o to Y Growth Comparison by Data Type , 2025-2035
  • Figure 31: North America Market Attractiveness Analysis by Data Type
  • Figure 32: North America Market Value Share and BPS Analysis by Modeling Type, 2025 and 2035
  • Figure 33: North America Market Y to o to Y Growth Comparison by Modeling Type, 2025-2035
  • Figure 34: North America Market Attractiveness Analysis by Modeling Type
  • Figure 35: North America Market Value Share and BPS Analysis by Offering, 2025 and 2035
  • Figure 36: North America Market Y to o to Y Growth Comparison by Offering, 2025-2035
  • Figure 37: North America Market Attractiveness Analysis by Offering
  • Figure 38: North America Market Value Share and BPS Analysis by Application, 2025 and 2035
  • Figure 39: North America Market Y to o to Y Growth Comparison by Application, 2025-2035
  • Figure 40: North America Market Attractiveness Analysis by Application
  • Figure 41: North America Market Value Share and BPS Analysis by End Use, 2025 and 2035
  • Figure 42: North America Market Y to o to Y Growth Comparison by End Use, 2025-2035
  • Figure 43: North America Market Attractiveness Analysis by End Use
  • Figure 44: Latin America Market Value Share and BPS Analysis by Country, 2025 and 2035
  • Figure 45: Latin America Market Value Share and BPS Analysis by Data Type , 2025 and 2035
  • Figure 46: Latin America Market Y to o to Y Growth Comparison by Data Type , 2025-2035
  • Figure 47: Latin America Market Attractiveness Analysis by Data Type
  • Figure 48: Latin America Market Value Share and BPS Analysis by Modeling Type, 2025 and 2035
  • Figure 49: Latin America Market Y to o to Y Growth Comparison by Modeling Type, 2025-2035
  • Figure 50: Latin America Market Attractiveness Analysis by Modeling Type
  • Figure 51: Latin America Market Value Share and BPS Analysis by Offering, 2025 and 2035
  • Figure 52: Latin America Market Y to o to Y Growth Comparison by Offering, 2025-2035
  • Figure 53: Latin America Market Attractiveness Analysis by Offering
  • Figure 54: Latin America Market Value Share and BPS Analysis by Application, 2025 and 2035
  • Figure 55: Latin America Market Y to o to Y Growth Comparison by Application, 2025-2035
  • Figure 56: Latin America Market Attractiveness Analysis by Application
  • Figure 57: Latin America Market Value Share and BPS Analysis by End Use, 2025 and 2035
  • Figure 58: Latin America Market Y to o to Y Growth Comparison by End Use, 2025-2035
  • Figure 59: Latin America Market Attractiveness Analysis by End Use
  • Figure 60: Western Europe Market Value Share and BPS Analysis by Country, 2025 and 2035
  • Figure 61: Western Europe Market Value Share and BPS Analysis by Data Type , 2025 and 2035
  • Figure 62: Western Europe Market Y to o to Y Growth Comparison by Data Type , 2025-2035
  • Figure 63: Western Europe Market Attractiveness Analysis by Data Type
  • Figure 64: Western Europe Market Value Share and BPS Analysis by Modeling Type, 2025 and 2035
  • Figure 65: Western Europe Market Y to o to Y Growth Comparison by Modeling Type, 2025-2035
  • Figure 66: Western Europe Market Attractiveness Analysis by Modeling Type
  • Figure 67: Western Europe Market Value Share and BPS Analysis by Offering, 2025 and 2035
  • Figure 68: Western Europe Market Y to o to Y Growth Comparison by Offering, 2025-2035
  • Figure 69: Western Europe Market Attractiveness Analysis by Offering
  • Figure 70: Western Europe Market Value Share and BPS Analysis by Application, 2025 and 2035
  • Figure 71: Western Europe Market Y to o to Y Growth Comparison by Application, 2025-2035
  • Figure 72: Western Europe Market Attractiveness Analysis by Application
  • Figure 73: Western Europe Market Value Share and BPS Analysis by End Use, 2025 and 2035
  • Figure 74: Western Europe Market Y to o to Y Growth Comparison by End Use, 2025-2035
  • Figure 75: Western Europe Market Attractiveness Analysis by End Use
  • Figure 76: Eastern Europe Market Value Share and BPS Analysis by Country, 2025 and 2035
  • Figure 77: Eastern Europe Market Value Share and BPS Analysis by Data Type , 2025 and 2035
  • Figure 78: Eastern Europe Market Y to o to Y Growth Comparison by Data Type , 2025-2035
  • Figure 79: Eastern Europe Market Attractiveness Analysis by Data Type
  • Figure 80: Eastern Europe Market Value Share and BPS Analysis by Modeling Type, 2025 and 2035
  • Figure 81: Eastern Europe Market Y to o to Y Growth Comparison by Modeling Type, 2025-2035
  • Figure 82: Eastern Europe Market Attractiveness Analysis by Modeling Type
  • Figure 83: Eastern Europe Market Value Share and BPS Analysis by Offering, 2025 and 2035
  • Figure 84: Eastern Europe Market Y to o to Y Growth Comparison by Offering, 2025-2035
  • Figure 85: Eastern Europe Market Attractiveness Analysis by Offering
  • Figure 86: Eastern Europe Market Value Share and BPS Analysis by Application, 2025 and 2035
  • Figure 87: Eastern Europe Market Y to o to Y Growth Comparison by Application, 2025-2035
  • Figure 88: Eastern Europe Market Attractiveness Analysis by Application
  • Figure 89: Eastern Europe Market Value Share and BPS Analysis by End Use, 2025 and 2035
  • Figure 90: Eastern Europe Market Y to o to Y Growth Comparison by End Use, 2025-2035
  • Figure 91: Eastern Europe Market Attractiveness Analysis by End Use
  • Figure 92: East Asia Market Value Share and BPS Analysis by Country, 2025 and 2035
  • Figure 93: East Asia Market Value Share and BPS Analysis by Data Type , 2025 and 2035
  • Figure 94: East Asia Market Y to o to Y Growth Comparison by Data Type , 2025-2035
  • Figure 95: East Asia Market Attractiveness Analysis by Data Type
  • Figure 96: East Asia Market Value Share and BPS Analysis by Modeling Type, 2025 and 2035
  • Figure 97: East Asia Market Y to o to Y Growth Comparison by Modeling Type, 2025-2035
  • Figure 98: East Asia Market Attractiveness Analysis by Modeling Type
  • Figure 99: East Asia Market Value Share and BPS Analysis by Offering, 2025 and 2035
  • Figure 100: East Asia Market Y to o to Y Growth Comparison by Offering, 2025-2035
  • Figure 101: East Asia Market Attractiveness Analysis by Offering
  • Figure 102: East Asia Market Value Share and BPS Analysis by Application, 2025 and 2035
  • Figure 103: East Asia Market Y to o to Y Growth Comparison by Application, 2025-2035
  • Figure 104: East Asia Market Attractiveness Analysis by Application
  • Figure 105: East Asia Market Value Share and BPS Analysis by End Use, 2025 and 2035
  • Figure 106: East Asia Market Y to o to Y Growth Comparison by End Use, 2025-2035
  • Figure 107: East Asia Market Attractiveness Analysis by End Use
  • Figure 108: South Asia and Pacific Market Value Share and BPS Analysis by Country, 2025 and 2035
  • Figure 109: South Asia and Pacific Market Value Share and BPS Analysis by Data Type , 2025 and 2035
  • Figure 110: South Asia and Pacific Market Y to o to Y Growth Comparison by Data Type , 2025-2035
  • Figure 111: South Asia and Pacific Market Attractiveness Analysis by Data Type
  • Figure 112: South Asia and Pacific Market Value Share and BPS Analysis by Modeling Type, 2025 and 2035
  • Figure 113: South Asia and Pacific Market Y to o to Y Growth Comparison by Modeling Type, 2025-2035
  • Figure 114: South Asia and Pacific Market Attractiveness Analysis by Modeling Type
  • Figure 115: South Asia and Pacific Market Value Share and BPS Analysis by Offering, 2025 and 2035
  • Figure 116: South Asia and Pacific Market Y to o to Y Growth Comparison by Offering, 2025-2035
  • Figure 117: South Asia and Pacific Market Attractiveness Analysis by Offering
  • Figure 118: South Asia and Pacific Market Value Share and BPS Analysis by Application, 2025 and 2035
  • Figure 119: South Asia and Pacific Market Y to o to Y Growth Comparison by Application, 2025-2035
  • Figure 120: South Asia and Pacific Market Attractiveness Analysis by Application
  • Figure 121: South Asia and Pacific Market Value Share and BPS Analysis by End Use, 2025 and 2035
  • Figure 122: South Asia and Pacific Market Y to o to Y Growth Comparison by End Use, 2025-2035
  • Figure 123: South Asia and Pacific Market Attractiveness Analysis by End Use
  • Figure 124: Middle East & Africa Market Value Share and BPS Analysis by Country, 2025 and 2035
  • Figure 125: Middle East & Africa Market Value Share and BPS Analysis by Data Type , 2025 and 2035
  • Figure 126: Middle East & Africa Market Y to o to Y Growth Comparison by Data Type , 2025-2035
  • Figure 127: Middle East & Africa Market Attractiveness Analysis by Data Type
  • Figure 128: Middle East & Africa Market Value Share and BPS Analysis by Modeling Type, 2025 and 2035
  • Figure 129: Middle East & Africa Market Y to o to Y Growth Comparison by Modeling Type, 2025-2035
  • Figure 130: Middle East & Africa Market Attractiveness Analysis by Modeling Type
  • Figure 131: Middle East & Africa Market Value Share and BPS Analysis by Offering, 2025 and 2035
  • Figure 132: Middle East & Africa Market Y to o to Y Growth Comparison by Offering, 2025-2035
  • Figure 133: Middle East & Africa Market Attractiveness Analysis by Offering
  • Figure 134: Middle East & Africa Market Value Share and BPS Analysis by Application, 2025 and 2035
  • Figure 135: Middle East & Africa Market Y to o to Y Growth Comparison by Application, 2025-2035
  • Figure 136: Middle East & Africa Market Attractiveness Analysis by Application
  • Figure 137: Middle East & Africa Market Value Share and BPS Analysis by End Use, 2025 and 2035
  • Figure 138: Middle East & Africa Market Y to o to Y Growth Comparison by End Use, 2025-2035
  • Figure 139: Middle East & Africa Market Attractiveness Analysis by End Use
  • Figure 140: Global Market - Tier Structure Analysis
  • Figure 141: Global Market - Company Share Analysis
Dashboard
Dashboard
Dashboard
Dashboard
Dashboard
Dashboard

Full Research Suite comprises of:

Market outlook & trends analysis

Market outlook & trends analysis

Interviews & case studies

Interviews & case studies

Strategic recommendations

Strategic recommendations

Vendor profiles & capabilities analysis

Vendor profiles & capabilities analysis

5-year forecasts

5-year forecasts

8 regions and 60+ country-level data splits

8 regions and 60+ country-level data splits

Market segment data splits

Market segment data splits

12 months of continuous data updates

12 months of continuous data updates

DELIVERED AS:

PDF EXCEL ONLINE

Full Research Suite


$5000

$7500

$10000

Buy Report Now
Similar Industry Reports

Similar Industry Reports

Synthetic Dye Market

Synthetic Dye Market Forecast Outlook 2025 to 2035

Synthetic Biology Market

Synthetic Biology Market Size and Share Forecast Outlook 2025 to 2035

Synthetic Abrasives Market

Synthetic Abrasives Market Size and Share Forecast Outlook 2025 to 2035

Synthetic Zeolite Y Adsorbent Market

Synthetic Zeolite Y Adsorbent Market Size and Share Forecast Outlook 2025 to 2035

Synthetic Musk Market

Synthetic Musk Market Size and Share Forecast Outlook 2025 to 2035

Synthetic Tackifiers Market

Synthetic Tackifiers Market Size and Share Forecast Outlook 2025 to 2035

Synthetic Spider Silk Proteins Market

Synthetic Spider Silk Proteins Market Analysis - Size, Share, and Forecast Outlook 2025 to 2035

Synthetic Polymer Wax Market

Synthetic Polymer Wax Market Size and Share Forecast Outlook 2025 to 2035

Synthetic Aperture Radar (SAR) Market

Synthetic Aperture Radar (SAR) Market Size and Share Forecast Outlook 2025 to 2035

Synthetic Diamond Market

Synthetic Diamond Market Size and Share Forecast Outlook 2025 to 2035

Synthetic Turf Market

Synthetic Turf Market Size and Share Forecast Outlook 2025 to 2035

Synthetic Food Market

Synthetic Food Market Size and Share Forecast Outlook 2025 to 2035

Synthetic Polyisoprene Rubber Market

Synthetic Polyisoprene Rubber Market Report – Trends & Innovations 2025–2035

Synthetic and Bio Emulsion Polymer Market

Synthetic and Bio Emulsion Polymer Market Size and Share Forecast Outlook 2025 to 2035

Synthetic And Bio Based PMMA Polymethyl Methacrylate Size Market

Synthetic And Bio Based PMMA Polymethyl Methacrylate Size Market Size and Share Forecast Outlook 2025 to 2035

Synthetic Quartz Market

Synthetic Quartz Market Size and Share Forecast Outlook 2025 to 2035

Synthetic Leather Market

Synthetic Leather Market Forecast & Growth 2025 to 2035

Synthetic Quartz Industry Analysis in Japan

Synthetic Quartz Industry Analysis in Japan - Size, Share, & Forecast Outlook 2025 to 2035

Synthetic Food Color Market

Synthetic Food Color Market Analysis - Size, Share, and Forecast Outlook 2025 to 2035

Synthetic Paper Market

Synthetic Paper Market Insights - Growth & Trends Forecast 2025 to 2035

Future Market Insights

Synthetic Data Generation Market

Chat With MaRIA

Chat With

MaRIA

Hi There, I am MaRIA, Your Market Research Intelligence Assistant. How may I help you?