Synthetic Zeolite Y Adsorbent Market Size and Share Forecast Outlook 2025 to 2035

The Synthetic Zeolite Y Adsorbent Market is estimated to be valued at USD 1304.7 million in 2025 and is projected to reach USD 1968.7 million by 2035, registering a compound annual growth rate (CAGR) of 4.2% over the forecast period.
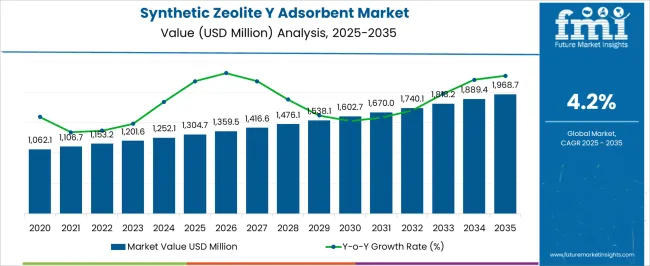
Quick Stats for Synthetic Zeolite Y Adsorbent Market

  • Synthetic Zeolite Y Adsorbent Market Industry Value (2025): USD 1304.7 million
  • Synthetic Zeolite Y Adsorbent Market Forecast Value (2035): USD 1968.7 million
  • Synthetic Zeolite Y Adsorbent Market Forecast CAGR: 4.2%
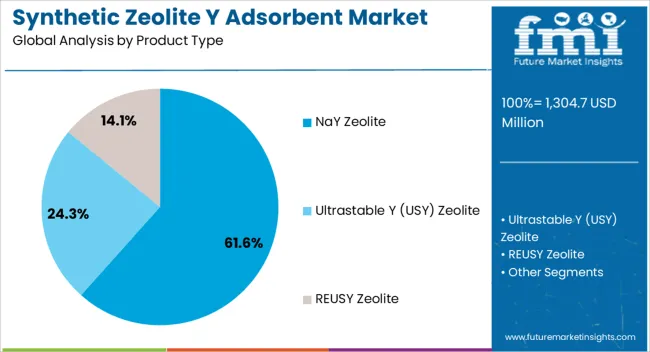
  • Leading Segment in Synthetic Zeolite Y Adsorbent Market in 2025: NaY Zeolite (61.6%)
  • Key Growth Region in Synthetic Zeolite Y Adsorbent Market: North America, Asia-Pacific, Europe
  • Top Key Players in Synthetic Zeolite Y Adsorbent Market: TOSOH Corporation, Clariant AG, Arkema S.A, Ecovyst Inc., W.R. Grace & Co., Honeywell International Inc., CPH Group, PQ Corp., Luoyang Jalon Micro-Nano New Materials Co., Ltd, Albemarle Corporation, BASF SE, Spectrum Chemical, KNT Group, KMI Zeolite Inc., Silkem d.o.o.

Synthetic Zeolite Y Adsorbent Market Market Value Analysis

Metric Value
Synthetic Zeolite Y Adsorbent Market Estimated Value in (2025 E) USD 1304.7 million
Synthetic Zeolite Y Adsorbent Market Forecast Value in (2035 F) USD 1968.7 million
Forecast CAGR (2025 to 2035) 4.2%

Rationale for Segmental Growth in the Synthetic Zeolite Y Adsorbent Market

The synthetic zeolite Y adsorbent market is witnessing sustained growth, driven by its critical role in catalysis, adsorption, and separation processes across industries. High demand from the petrochemical, refining, and chemical sectors has strengthened its positioning, supported by its uniform pore structure, ion-exchange capacity, and thermal stability.

The current market scenario is characterized by increasing replacement of traditional adsorbents with zeolite-based solutions due to higher efficiency and selectivity. Hydrocarbon processing and fluid catalytic cracking remain key growth drivers, while emerging applications in environmental remediation and gas purification are broadening the scope of adoption.

Continuous advancements in synthesis methods and material engineering are further enhancing product performance. The market outlook remains favorable, with rising energy demand, refinery capacity expansions, and environmental regulations supporting long-term growth.
Segmental Analysis

Insights into the NaY Zeolite Segment

Synthetic Zeolite Y Adsorbent Market Analysis By Product Type

The NaY zeolite segment dominates the product type category, holding approximately 61.6% share in the synthetic zeolite Y adsorbent market. Its dominance is attributed to its superior ion-exchange properties and structural adaptability, which make it a preferred material in catalytic cracking and hydrocarbon processing.

NaY zeolite’s cost-effectiveness and scalability in production further contribute to its widespread use in large-scale industrial applications. Demand for this product type has been reinforced by its proven performance in extending catalyst lifespans and improving refinery throughput.

With ongoing expansion in petrochemical and refining industries, the NaY zeolite segment is expected to sustain its leadership in the coming years.
Insights into the Hydrothermal Synthesis Segment:

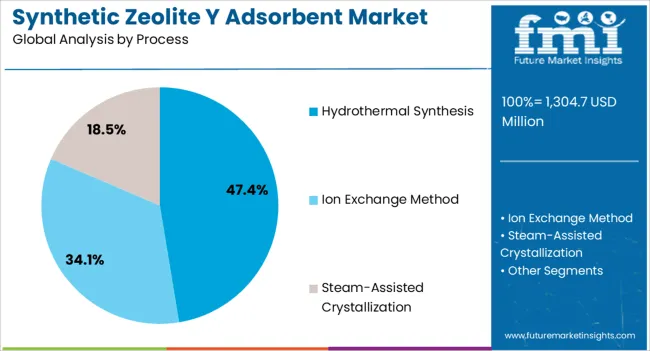
Synthetic Zeolite Y Adsorbent Market Analysis By Process

The hydrothermal synthesis segment leads the process category with approximately 47.4% share, driven by its reliability in producing high-purity zeolite structures with consistent quality. This process allows for controlled crystallization, ensuring uniform pore sizes and structural stability, which are critical for industrial performance.

Hydrothermal methods are well-established, enabling large-scale production aligned with refinery and chemical sector demands. The segment benefits from ongoing innovations aimed at optimizing synthesis parameters to reduce costs and energy consumption.

With the increasing requirement for efficiency in adsorbents and catalysts, hydrothermal synthesis is expected to maintain its position as the preferred manufacturing route in the synthetic zeolite Y adsorbent market.
Insights into the Powder Segment:

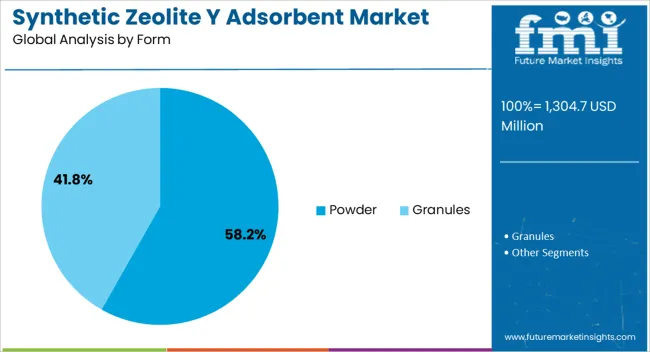
Synthetic Zeolite Y Adsorbent Market Analysis By Form

The powder segment dominates the form category, holding approximately 58.2% share of the market. Powdered synthetic zeolite Y adsorbents are highly valued for their versatility, ease of dispersion, and effectiveness in various catalytic and adsorption processes.

Their widespread use in refining, chemical synthesis, and gas separation has solidified their dominance. The segment benefits from simple handling, compatibility with different formulations, and high surface area exposure, which enhances performance efficiency.

Ongoing demand from industrial and environmental applications is expected to reinforce the powder segment’s leading position, ensuring continued market relevance over the forecast horizon.

Key Highlights Driving the Synthetic Zeolite Y Adsorbent Industry

Market to Expand Over 1.5X through 2035

The global synthetic zeolite Y adsorbent market is predicted to expand over 1.5x through 2035, amid a 1.4% increase in expected CAGR compared to the historical one. This is due to the growing demand for gas separation and purification in a wide range of applications such as oxygen (O2) enrichment, carbon dioxide (CO2) separation, and more.

Global sales of synthetic zeolite Y adsorbents are expected to rise due to increasing government initiatives for developing water infrastructure and high demand for advanced gas separation technologies. By 2035, the total market revenue is set to reach USD 1,888.2 million.

North America Continues to Dominate Synthetic Zeolite Y Adsorbent Market

North America is expected to dominate the global synthetic zeolite Y adsorbent market during the forecast period. It is set to hold around 25.7% of the worldwide market share in 2035. This is attributed to the following factors:

  • Rising Demand in Gas Separation Technologies: North America's dominance in the synthetic zeolite Y adsorbent market is propelled by the increasing demand for gas separation and purification technologies. The region's robust growth is notably driven by applications such as carbon dioxide separation, oxygen enrichment, and natural gas treatment, reflecting a growing emphasis on clean energy production and environmental sustainability.
  • Expansion of Water and Wastewater Treatment Infrastructure: Countries such as the United States, Canada, and Mexico are rigorously investing to develop & expand water and wastewater treatment infrastructure. This creates a high demand for synthetic zeolite Y adsorbents, which is expected to continue through 2035.
  • Innovation and Technological Advancements: North America's leadership in synthetic zeolite Y adsorbents is further solidified by continuous innovation and technological advancements in manufacturing. With a focus on hydrothermal synthesis, ion exchange methods, and steam-assisted crystallization, the region remains at the forefront of developing cutting-edge solutions, attracting investments, and fostering sustainable growth in the global market. This is expected to uplift synthetic zeolite Y adsorbent demand in the region through 2035.

Structural Overview of the Synthetic Zeolite Y Adsorbent Market

Technological advancements in synthetic zeolite Y adsorbent and expanding applications across diverse regions are set to propel market expansion. Growing reliance on synthetic zeolite Y adsorbents for precise gas separation further amplifies market demand and significance.

Increasingly stringent water quality regulations worldwide are projected to augment the adoption of synthetic zeolite Y in water treatment processes. As governments and industries prioritize compliance with strict standards, the adsorbents play a vital role in effectively removing pollutants, safeguarding water quality, and meeting regulatory requirements.

The growing industrial use of water and heightened environmental awareness are expected to fuel the demand for synthetic zeolite Y in water treatment. Industries seeking efficient and sustainable wastewater treatment and purification solutions contribute to the market's growth, reflecting a shared commitment to addressing global water challenges.

Substantial investments are being made in research & development to advance manufacturing processes and meet the escalating demand for zeolite adsorbents in diverse applications, reinforcing industry growth. This strategic focus underscores a commitment to advancing technology and meeting evolving demands for efficient water treatment and gas purification solutions.

Sales Analysis of Synthetic Zeolite Y Adsorbents (2020 to 2024) vs Forecast (2025 to 2035)

Global sales of synthetic zeolite Y adsorbents grew at a CAGR of 2.8% from 2020 to 2025. The market reached a valuation of USD 1,208.4 million in 2025. In the forecast period, the worldwide synthetic zeolite Y adsorbent industry is set to thrive at a CAGR of 4.2%.

Historical CAGR (2020 to 2025) 2.8%
Forecast CAGR (2025 to 2035) 4.2%

The global synthetic zeolite Y adsorbent market witnessed steady growth between 2020 and 2025. This was due to the increased demand for clean drinking water and a high focus on improving product quality in a wide range of applications and end-use industries.

The synthetic zeolite Y adsorbent market faced disruptions during the COVID-19 pandemic, witnessing supply chain challenges and delayed projects. However, the increasing focus on environmental solutions has since spurred recovery and resilience in the industry.

An increasing number of sectors, such as petrochemicals, refining, gas separation, catalysis, and environmental protection, use synthetic zeolite Y adsorbents. These adsorbents' adaptability has aided in their use in several industrial applications.

The petrochemical sector has been the leading user of synthetic zeolite Y adsorbents. Their application in the petrochemical industry's separation and purification processes has been a key factor in the market's expansion.

Future Scope of the Synthetic Zeolite Y Adsorbent Market

Over the forecast period, the global synthetic zeolite Y adsorbent market is poised to exhibit healthy growth. This is due to several factors, including increasing demand for technological advancements in production processes, a shift toward sustainability, and the robust expansion of end-use industries.

The future outlook for the synthetic zeolite Y adsorbent market foresees a heightened demand for cutting-edge gas separation technologies. The imperative shift toward clean energy and eco-friendly industrial processes fuels this surge.

Zeolite-based solutions are gaining increased recognition, particularly in CO2 separation, oxygen enrichment, and natural gas treatment applications. As industries prioritize reducing their carbon footprint and optimizing operational efficiency, zeolite adsorbents are pivotal in meeting the evolving requirements for advanced gas separation and purification technologies.

Emerging Trends Transforming the Synthetic Zeolite Y Adsorbent Market

  • To cut emissions and pollutants, adsorbents like synthetic zeolite Y are in high demand across the petrochemical and automotive sectors.
  • The ongoing research and development goal is to optimize synthetic zeolite Y's manufacturing procedures to boost productivity, lower production costs, and guarantee a reliable, high-quality product.
  • Researchers are extending the use of synthetic zeolite Y adsorbents beyond conventional applications by investigating new uses for them. This includes applications in environmental cleanup, the pharmaceutical industry, and other cutting-edge fields.
  • Escalating concerns over water scarcity globally propels the demand for synthetic zeolite Y adsorbents. Their effectiveness in removing contaminants and impurities from water sources addresses the urgent need for advanced water treatment solutions, ensuring a sustainable and accessible supply of clean and safe water.
  • Growing awareness of volatile organic compounds (VOCs) as significant air pollutants is anticipated to fuel the demand for synthetic zeolite Y adsorbents. Their proven ability to adsorb and mitigate VOCs is driving industries to adopt advanced solutions for VOC treatment to improve air quality.

Key Restraints Impacting Growth in the Synthetic Zeolite Y Adsorbent Sector

Growing Competition from Alternative Adsorbents

Alternative adsorbents, including activated carbon and silica gel, challenge the synthetic zeolite Y market. Industries exploring diverse options are set to choose alternative materials based on specific application requirements, hindering the sustained growth of zeolite Y in a competitive landscape.

Rapid advancements in adsorption technologies, such as graphene-based materials and advanced polymers, threaten the conventional dominance of synthetic zeolite Y. Emerging technologies often offer improved adsorption capacities and selectivity, diverting attention and investments away from traditional zeolite Y applications.

Increasing Regulatory Requirements for Environmental Safety

Due to heightened regulatory requirements, obtaining approvals for synthetic zeolite Y adsorbents in several applications is set to become resource-intensive. Industries may need help securing the necessary certifications, impeding the smooth adoption of zeolite Y in water treatment, nuclear waste remediation, and VOC treatment processes.
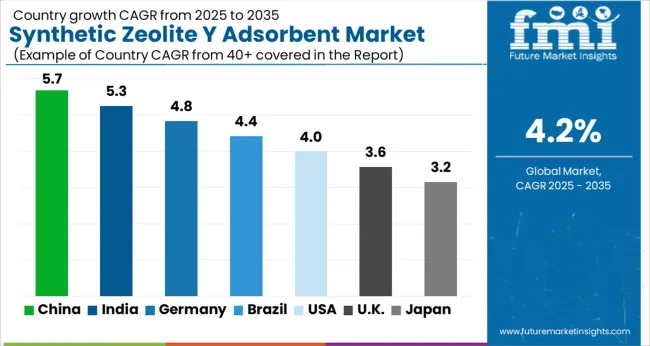
Analysis of Top Countries Manufacturing and Using Zeolite Y Adsorbents

Synthetic Zeolite Y Adsorbent Market Cagr Analysis By Country

The table below highlights key countries’ synthetic zeolite Y adsorbent market revenues. The United States, China, and Canada are expected to remain the top three consumers of synthetic zeolite Y adsorbents, with expected valuations of USD 1968.7.0 million, USD 222 million, and USD 125 million, respectively, in 2035.

The table below shows the estimated growth rates of the top six countries. South Africa, Turkiye, and South Korea are set to record high CAGRs of 6.9%, 6.3%, and 6.2%, respectively, through 2035.

Growing Interest in Water Treatment in the United States Inflating Market Growth

The United States synthetic zeolite Y adsorbent market is projected to reach USD 1968.7.0 million by 2035. The factors responsible for this growth are as follows:

  • The United States’ strong water treatment infrastructure, adherence to quality standards, and strict regulations contribute to the significant growth of the market.
  • Growing investments in water treatment infrastructure by government agencies in the United States are expected to propel the market.
  • Expanding chemical, petroleum, and water treatment facilities in the United States drive the demand, as stringent regulations necessitate effective solutions for hazardous gas and liquid emissions.

Rapid Industrialization and Urbanization in China Attracting Market Players

Sales of synthetic zeolite Y adsorbents in China are anticipated to reach USD 222 million by 2035. The factors driving the market growth are as follows:

  • China's rapid industrialization and urbanization are driving the demand for water treatment and chemical manufacturing.
  • China's growing population and urban development are set to contribute to high water treatment demands, driving the need for synthetic zeolite Y adsorbents in municipal water supply systems.
  • Environmental regulations, industrial growth, and increased demand for clean water are expected to make synthetic zeolite Y adsorbents a crucial product in China.

Robust Industrial Infrastructure of Canada to Surge Demand by 2035

Canada's synthetic zeolite Y adsorbent market value is anticipated to reach USD 125 million by 2035. Emerging patterns in Canada’s market are as follows:
  • The country's commitment to environmental sustainability and stringent regulations drives the adoption of zeolite-based solutions in carbon dioxide separation, oxygen enrichment, and other gas separation processes.
  • Canada’s strong industrial infrastructure and focus on sustainable practices position the country as a key player in the global market.
  • Canada presents ample opportunities for manufacturers looking to capitalize on the growing demand for synthetic zeolite Y adsorbents with a stable economy and a commitment to innovation.

Expansion of South Korea’s Petrochemical Sector Paving the Road for Success

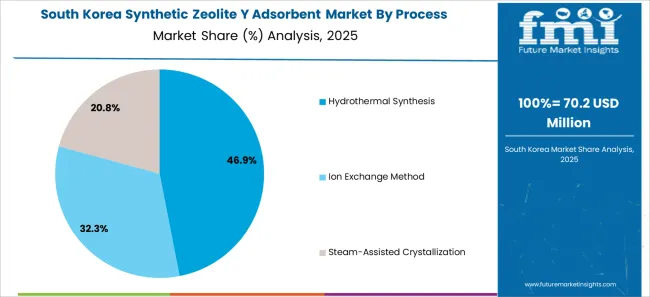
Synthetic Zeolite Y Adsorbent Market South Korea Market Share Analysis By Process

South Korea’s synthetic zeolite Y adsorbent market is assessed to register a CAGR of 6.2% through 2035. The deployment of synthetic zeolite Y adsorbents is increasing on account of the following:

  • Growing industrial activity, especially in petrochemicals, refining, and environmental applications, is propelling market expansion in South Korea.
  • The expansion of South Korea's petrochemical sector is significantly fueling the demand for synthetic zeolite Y adsorbents. The industry employs these materials for several procedures, such as purification and separation.

Rising Research and Development Activities in Turkiye to Gain Traction

Key players are significantly investing in Turkiye, as the country is offering several growth opportunities. Through 2035, Turkiye is projected to expand at a CAGR of 6.3%, driven by the following factors:

  • Turkiye's research and development efforts are focused on increasing product efficiency, refining manufacturing procedures, and investigating novel uses for synthetic zeolite Y.
  • The demand for synthetic zeolite Y adsorbents is directly impacted by Turkiye's general infrastructure and expansion of industrial development.
  • Turkiye's participation as a manufacturer and consumer in the international trade of synthetic zeolite Y adsorbents is influencing the market dynamics.

Synthetic Zeolite Y Adsorbent Industry Analysis by Top Investment Segments

The section below shows the NaY zeolite segment dominating based on product type. It is forecast to thrive at a 3.8% CAGR between 2025 and 2035. Based on application, the water treatment segment is anticipated to hold a dominant share through 2035. It is set to exhibit a CAGR of 3.5% during the forecast period.

Adoption of NaY Zeolite in Terms of Product Type to Surge Through 2035

Top Segment (Product Type) NaY Zeolite
Predicted CAGR (2025 to 2035) 3.8%

NaY zeolite is a sodium-based zeolite known for its exceptional ion exchange capacity and high thermal stability. NaY zeolite is set to exhibit superior adsorption properties for water treatment, selectively removing contaminants widely employed in catalysis and gas separation applications.

Its unique crystal structure and chemical composition make it a versatile choice for several industrial processes, reflecting its significance in addressing water purification challenges. Rising usage of NaY zeolite in the synthetic Y adsorbent market in gas separation and purification is set to boost the target segment.

It is anticipated to hold a significant volume share of 61.6% in 2025. Demand for NaY zeolite is forecast to rise at a CAGR of 3.8% over the period.

Demand for Synthetic Zeolite Y Adsorbents to Remain High for Water Treatment

Top Segment (Application) Water Treatment
Projected CAGR (2025 to 2035) 3.5%

Based on application, the water treatment segment is projected to thrive at a 3.5% CAGR during the forecast period. Water treatment emerges as a paramount application within the dynamic landscape of the synthetic zeolite Y adsorbent market.

The adsorbents are pivotal in removing contaminants and ensuring access to clean & safe water featuring NaY, USY, and REUSY zeolites. From municipal water purification to industrial wastewater treatment, zeolite adsorbents significantly enhance water quality and support sustainable resource management practices.
Competitive Landscape of the Synthetic Zeolite Y Adsorbent Market

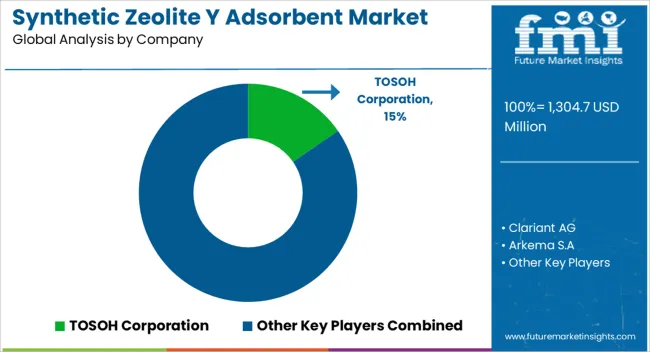
Synthetic Zeolite Y Adsorbent Market Analysis By Company

The global synthetic zeolite Y adsorbent market is fragmented, with leading players accounting for a significant share. The report lists TOSOH Corporation, Clariant AG, Arkema S.A, Ecovyst Inc., W.R. Grace & Co., and Honeywell International Inc. as the leading manufacturers and suppliers of synthetic zeolite Y adsorbents.

Key synthetic zeolite Y adsorbent companies are investing in continuous research to produce new solutions and increase their production capacity to meet end-user demand. To increase their presence, key players are displaying a propensity to implement growth strategies such as collaborations, acquisitions, mergers, and facility expansions.

Recent Developments

  • On September 22, 2024, Standard Industries, a privately held global industrial company, acquired Grace.
  • On June 15, 2024, Honeywell collaborated with DRDO and CSIR–IIP in India to provide molecular sieve adsorbents for Medical Oxygen Plants, addressing the pandemic's oxygen demand.
  • On May 10, 2024, Maruti Suzuki India Limited (MSIL) collaborated with Airox Nigen Equipments and SAM Gas Projects to enhance Oxygen PSA plant production in India.

Leading Companies Profiled in the Synthetic Zeolite Y Adsorbent Industry

  • TOSOH Corporation
  • Clariant AG
  • Arkema S.A
  • Ecovyst Inc.
  • W.R. Grace & Co.
  • Honeywell International Inc.
  • CPH Group
  • PQ Corp.
  • Luoyang Jalon Micro-Nano New Materials Co., Ltd
  • Albemarle Corporation
  • BASF SE
  • Spectrum Chemical
  • KNT Group
  • KMI Zeolite Inc.
  • Silkem d.o.o.

Top Segments Studied in the Synthetic Zeolite Y Adsorbent Market

By Product Type:

  • NaY Zeolite
  • Ultrastable Y (USY) Zeolite
  • REUSY Zeolite

By Process:

  • Hydrothermal Synthesis
  • Ion Exchange Method
  • Steam-assisted Crystallization

By Form:

  • Powder
  • Granules

By Application:

  • Water Treatment
  • Nuclear Waste Treatment
  • Gas Separation and Purification
    • Carbon Dioxide (CO2) Separation
    • Oxygen (O2) Enrichment
    • Nitrogen (N2) Separation
    • Xenon Separation
    • Krypton Separation
    • Argon Separation
    • Helium Separation
    • Natural Gas Treatment
    • Other Gas Separation (CH4, H2, SO2)
  • VOC (Volatile Organic Compounds) Treatment

By Region:

  • North America
  • Latin America
  • Western Europe
  • Eastern Europe
  • Asia Pacific (excl. China)
  • China
  • Middle East and Africa

Frequently Asked Questions

How big is the synthetic zeolite Y adsorbent market in 2025?

The global synthetic zeolite Y adsorbent market is estimated to be valued at USD 1,304.7 million in 2025.

What will be the size of synthetic zeolite Y adsorbent market in 2035?

The market size for the synthetic zeolite Y adsorbent market is projected to reach USD 1,968.7 million by 2035.

How much will be the synthetic zeolite Y adsorbent market growth between 2025 and 2035?

The synthetic zeolite Y adsorbent market is expected to grow at a 4.2% CAGR between 2025 and 2035.

What are the key product types in the synthetic zeolite Y adsorbent market?

The key product types in synthetic zeolite Y adsorbent market are nay zeolite, ultrastable Y (usy) zeolite and reusy zeolite.

Which process segment to contribute significant share in the synthetic zeolite Y adsorbent market in 2025?

In terms of process, hydrothermal synthesis segment to command 47.4% share in the synthetic zeolite Y adsorbent market in 2025.

Table of Content

  1. Executive Summary
    • Global Market Outlook
    • Demand-side Trends
    • Supply-side Trends
    • Technology Roadmap Analysis
    • Analysis and Recommendations
  2. Market Overview
    • Market Coverage / Taxonomy
    • Market Definition / Scope / Limitations
  3. Market Background
    • Market Dynamics
      • Drivers
      • Restraints
      • Opportunity
      • Trends
    • Scenario Forecast
      • Demand in Optimistic Scenario
      • Demand in Likely Scenario
      • Demand in Conservative Scenario
    • Opportunity Map Analysis
    • Product Life Cycle Analysis
    • Supply Chain Analysis
    • Investment Feasibility Matrix
    • Value Chain Analysis
    • PESTLE and Porter’s Analysis
    • Regulatory Landscape
    • Regional Parent Market Outlook
    • Production and Consumption Statistics
    • Import and Export Statistics
  4. Global Market Analysis 2020 to 2024 and Forecast, 2025 to 2035
    • Historical Market Size Value (USD Million) Analysis, 2020 to 2024
    • Current and Future Market Size Value (USD Million) Projections, 2025 to 2035
      • Y-o-Y Growth Trend Analysis
      • Absolute $ Opportunity Analysis
  5. Global Market Pricing Analysis 2020 to 2024 and Forecast 2025 to 2035
  6. Global Market Analysis 2020 to 2024 and Forecast 2025 to 2035, By Product Type
    • Introduction / Key Findings
    • Historical Market Size Value (USD Million) Analysis By Product Type , 2020 to 2024
    • Current and Future Market Size Value (USD Million) Analysis and Forecast By Product Type , 2025 to 2035
      • NaY Zeolite
      • Ultrastable Y (USY) Zeolite
      • REUSY Zeolite
    • Y-o-Y Growth Trend Analysis By Product Type , 2020 to 2024
    • Absolute $ Opportunity Analysis By Product Type , 2025 to 2035
  7. Global Market Analysis 2020 to 2024 and Forecast 2025 to 2035, By Process
    • Introduction / Key Findings
    • Historical Market Size Value (USD Million) Analysis By Process, 2020 to 2024
    • Current and Future Market Size Value (USD Million) Analysis and Forecast By Process, 2025 to 2035
      • Hydrothermal Synthesis
      • Ion Exchange Method
      • Steam-Assisted Crystallization
    • Y-o-Y Growth Trend Analysis By Process, 2020 to 2024
    • Absolute $ Opportunity Analysis By Process, 2025 to 2035
  8. Global Market Analysis 2020 to 2024 and Forecast 2025 to 2035, By Form
    • Introduction / Key Findings
    • Historical Market Size Value (USD Million) Analysis By Form, 2020 to 2024
    • Current and Future Market Size Value (USD Million) Analysis and Forecast By Form, 2025 to 2035
      • Powder
      • Granules
    • Y-o-Y Growth Trend Analysis By Form, 2020 to 2024
    • Absolute $ Opportunity Analysis By Form, 2025 to 2035
  9. Global Market Analysis 2020 to 2024 and Forecast 2025 to 2035, By Application
    • Introduction / Key Findings
    • Historical Market Size Value (USD Million) Analysis By Application, 2020 to 2024
    • Current and Future Market Size Value (USD Million) Analysis and Forecast By Application, 2025 to 2035
      • Water Treatment
      • Nuclear Waste Treatment
      • Gas Separation And Purification
      • VOC (Volatile Organic Compounds) Treatment
    • Y-o-Y Growth Trend Analysis By Application, 2020 to 2024
    • Absolute $ Opportunity Analysis By Application, 2025 to 2035
  10. Global Market Analysis 2020 to 2024 and Forecast 2025 to 2035, By Region
    • Introduction
    • Historical Market Size Value (USD Million) Analysis By Region, 2020 to 2024
    • Current Market Size Value (USD Million) Analysis and Forecast By Region, 2025 to 2035
      • North America
      • Latin America
      • Western Europe
      • Eastern Europe
      • East Asia
      • South Asia and Pacific
      • Middle East & Africa
    • Market Attractiveness Analysis By Region
  11. North America Market Analysis 2020 to 2024 and Forecast 2025 to 2035, By Country
    • Historical Market Size Value (USD Million) Trend Analysis By Market Taxonomy, 2020 to 2024
    • Market Size Value (USD Million) Forecast By Market Taxonomy, 2025 to 2035
      • By Country
        • USA
        • Canada
        • Mexico
      • By Product Type
      • By Process
      • By Form
      • By Application
    • Market Attractiveness Analysis
      • By Country
      • By Product Type
      • By Process
      • By Form
      • By Application
    • Key Takeaways
  12. Latin America Market Analysis 2020 to 2024 and Forecast 2025 to 2035, By Country
    • Historical Market Size Value (USD Million) Trend Analysis By Market Taxonomy, 2020 to 2024
    • Market Size Value (USD Million) Forecast By Market Taxonomy, 2025 to 2035
      • By Country
        • Brazil
        • Chile
        • Rest of Latin America
      • By Product Type
      • By Process
      • By Form
      • By Application
    • Market Attractiveness Analysis
      • By Country
      • By Product Type
      • By Process
      • By Form
      • By Application
    • Key Takeaways
  13. Western Europe Market Analysis 2020 to 2024 and Forecast 2025 to 2035, By Country
    • Historical Market Size Value (USD Million) Trend Analysis By Market Taxonomy, 2020 to 2024
    • Market Size Value (USD Million) Forecast By Market Taxonomy, 2025 to 2035
      • By Country
        • Germany
        • UK
        • Italy
        • Spain
        • France
        • Nordic
        • BENELUX
        • Rest of Western Europe
      • By Product Type
      • By Process
      • By Form
      • By Application
    • Market Attractiveness Analysis
      • By Country
      • By Product Type
      • By Process
      • By Form
      • By Application
    • Key Takeaways
  14. Eastern Europe Market Analysis 2020 to 2024 and Forecast 2025 to 2035, By Country
    • Historical Market Size Value (USD Million) Trend Analysis By Market Taxonomy, 2020 to 2024
    • Market Size Value (USD Million) Forecast By Market Taxonomy, 2025 to 2035
      • By Country
        • Russia
        • Poland
        • Hungary
        • Balkan & Baltic
        • Rest of Eastern Europe
      • By Product Type
      • By Process
      • By Form
      • By Application
    • Market Attractiveness Analysis
      • By Country
      • By Product Type
      • By Process
      • By Form
      • By Application
    • Key Takeaways
  15. East Asia Market Analysis 2020 to 2024 and Forecast 2025 to 2035, By Country
    • Historical Market Size Value (USD Million) Trend Analysis By Market Taxonomy, 2020 to 2024
    • Market Size Value (USD Million) Forecast By Market Taxonomy, 2025 to 2035
      • By Country
        • China
        • Japan
        • South Korea
      • By Product Type
      • By Process
      • By Form
      • By Application
    • Market Attractiveness Analysis
      • By Country
      • By Product Type
      • By Process
      • By Form
      • By Application
    • Key Takeaways
  16. South Asia and Pacific Market Analysis 2020 to 2024 and Forecast 2025 to 2035, By Country
    • Historical Market Size Value (USD Million) Trend Analysis By Market Taxonomy, 2020 to 2024
    • Market Size Value (USD Million) Forecast By Market Taxonomy, 2025 to 2035
      • By Country
        • India
        • ASEAN
        • Australia & New Zealand
        • Rest of South Asia and Pacific
      • By Product Type
      • By Process
      • By Form
      • By Application
    • Market Attractiveness Analysis
      • By Country
      • By Product Type
      • By Process
      • By Form
      • By Application
    • Key Takeaways
  17. Middle East & Africa Market Analysis 2020 to 2024 and Forecast 2025 to 2035, By Country
    • Historical Market Size Value (USD Million) Trend Analysis By Market Taxonomy, 2020 to 2024
    • Market Size Value (USD Million) Forecast By Market Taxonomy, 2025 to 2035
      • By Country
        • Kingdom of Saudi Arabia
        • Other GCC Countries
        • Turkiye
        • South Africa
        • Other African Union
        • Rest of Middle East & Africa
      • By Product Type
      • By Process
      • By Form
      • By Application
    • Market Attractiveness Analysis
      • By Country
      • By Product Type
      • By Process
      • By Form
      • By Application
    • Key Takeaways
  18. Key Countries Market Analysis
    • USA
      • Pricing Analysis
      • Market Share Analysis, 2024
        • By Product Type
        • By Process
        • By Form
        • By Application
    • Canada
      • Pricing Analysis
      • Market Share Analysis, 2024
        • By Product Type
        • By Process
        • By Form
        • By Application
    • Mexico
      • Pricing Analysis
      • Market Share Analysis, 2024
        • By Product Type
        • By Process
        • By Form
        • By Application
    • Brazil
      • Pricing Analysis
      • Market Share Analysis, 2024
        • By Product Type
        • By Process
        • By Form
        • By Application
    • Chile
      • Pricing Analysis
      • Market Share Analysis, 2024
        • By Product Type
        • By Process
        • By Form
        • By Application
    • Germany
      • Pricing Analysis
      • Market Share Analysis, 2024
        • By Product Type
        • By Process
        • By Form
        • By Application
    • UK
      • Pricing Analysis
      • Market Share Analysis, 2024
        • By Product Type
        • By Process
        • By Form
        • By Application
    • Italy
      • Pricing Analysis
      • Market Share Analysis, 2024
        • By Product Type
        • By Process
        • By Form
        • By Application
    • Spain
      • Pricing Analysis
      • Market Share Analysis, 2024
        • By Product Type
        • By Process
        • By Form
        • By Application
    • France
      • Pricing Analysis
      • Market Share Analysis, 2024
        • By Product Type
        • By Process
        • By Form
        • By Application
    • India
      • Pricing Analysis
      • Market Share Analysis, 2024
        • By Product Type
        • By Process
        • By Form
        • By Application
    • ASEAN
      • Pricing Analysis
      • Market Share Analysis, 2024
        • By Product Type
        • By Process
        • By Form
        • By Application
    • Australia & New Zealand
      • Pricing Analysis
      • Market Share Analysis, 2024
        • By Product Type
        • By Process
        • By Form
        • By Application
    • China
      • Pricing Analysis
      • Market Share Analysis, 2024
        • By Product Type
        • By Process
        • By Form
        • By Application
    • Japan
      • Pricing Analysis
      • Market Share Analysis, 2024
        • By Product Type
        • By Process
        • By Form
        • By Application
    • South Korea
      • Pricing Analysis
      • Market Share Analysis, 2024
        • By Product Type
        • By Process
        • By Form
        • By Application
    • Russia
      • Pricing Analysis
      • Market Share Analysis, 2024
        • By Product Type
        • By Process
        • By Form
        • By Application
    • Poland
      • Pricing Analysis
      • Market Share Analysis, 2024
        • By Product Type
        • By Process
        • By Form
        • By Application
    • Hungary
      • Pricing Analysis
      • Market Share Analysis, 2024
        • By Product Type
        • By Process
        • By Form
        • By Application
    • Kingdom of Saudi Arabia
      • Pricing Analysis
      • Market Share Analysis, 2024
        • By Product Type
        • By Process
        • By Form
        • By Application
    • Turkiye
      • Pricing Analysis
      • Market Share Analysis, 2024
        • By Product Type
        • By Process
        • By Form
        • By Application
    • South Africa
      • Pricing Analysis
      • Market Share Analysis, 2024
        • By Product Type
        • By Process
        • By Form
        • By Application
  19. Market Structure Analysis
    • Competition Dashboard
    • Competition Benchmarking
    • Market Share Analysis of Top Players
      • By Regional
      • By Product Type
      • By Process
      • By Form
      • By Application
  20. Competition Analysis
    • Competition Deep Dive
      • TOSOH Corporation
        • Overview
        • Product Portfolio
        • Profitability by Market Segments (Product/Age /Sales Channel/Region)
        • Sales Footprint
        • Strategy Overview
          • Marketing Strategy
          • Product Strategy
          • Channel Strategy
      • Clariant AG
      • Arkema S.A
      • Ecovyst Inc.
      • W.R. Grace & Co.
      • Honeywell International Inc.
      • CPH Group
      • PQ Corp.
      • Luoyang Jalon Micro-Nano New Materials Co., Ltd
      • Albemarle Corporation
      • BASF SE
      • Spectrum Chemical
      • KNT Group
      • KMI Zeolite Inc.
      • Silkem d.o.o.
  21. Assumptions & Acronyms Used
  22. Research Methodology

List of Tables

  • Table 1: Global Market Value (USD Million) Forecast by Region, 2020 to 2035
  • Table 2: Global Market Value (USD Million) Forecast by Product Type , 2020 to 2035
  • Table 3: Global Market Value (USD Million) Forecast by Process, 2020 to 2035
  • Table 4: Global Market Value (USD Million) Forecast by Form, 2020 to 2035
  • Table 5: Global Market Value (USD Million) Forecast by Application, 2020 to 2035
  • Table 6: North America Market Value (USD Million) Forecast by Country, 2020 to 2035
  • Table 7: North America Market Value (USD Million) Forecast by Product Type , 2020 to 2035
  • Table 8: North America Market Value (USD Million) Forecast by Process, 2020 to 2035
  • Table 9: North America Market Value (USD Million) Forecast by Form, 2020 to 2035
  • Table 10: North America Market Value (USD Million) Forecast by Application, 2020 to 2035
  • Table 11: Latin America Market Value (USD Million) Forecast by Country, 2020 to 2035
  • Table 12: Latin America Market Value (USD Million) Forecast by Product Type , 2020 to 2035
  • Table 13: Latin America Market Value (USD Million) Forecast by Process, 2020 to 2035
  • Table 14: Latin America Market Value (USD Million) Forecast by Form, 2020 to 2035
  • Table 15: Latin America Market Value (USD Million) Forecast by Application, 2020 to 2035
  • Table 16: Western Europe Market Value (USD Million) Forecast by Country, 2020 to 2035
  • Table 17: Western Europe Market Value (USD Million) Forecast by Product Type , 2020 to 2035
  • Table 18: Western Europe Market Value (USD Million) Forecast by Process, 2020 to 2035
  • Table 19: Western Europe Market Value (USD Million) Forecast by Form, 2020 to 2035
  • Table 20: Western Europe Market Value (USD Million) Forecast by Application, 2020 to 2035
  • Table 21: Eastern Europe Market Value (USD Million) Forecast by Country, 2020 to 2035
  • Table 22: Eastern Europe Market Value (USD Million) Forecast by Product Type , 2020 to 2035
  • Table 23: Eastern Europe Market Value (USD Million) Forecast by Process, 2020 to 2035
  • Table 24: Eastern Europe Market Value (USD Million) Forecast by Form, 2020 to 2035
  • Table 25: Eastern Europe Market Value (USD Million) Forecast by Application, 2020 to 2035
  • Table 26: East Asia Market Value (USD Million) Forecast by Country, 2020 to 2035
  • Table 27: East Asia Market Value (USD Million) Forecast by Product Type , 2020 to 2035
  • Table 28: East Asia Market Value (USD Million) Forecast by Process, 2020 to 2035
  • Table 29: East Asia Market Value (USD Million) Forecast by Form, 2020 to 2035
  • Table 30: East Asia Market Value (USD Million) Forecast by Application, 2020 to 2035
  • Table 31: South Asia and Pacific Market Value (USD Million) Forecast by Country, 2020 to 2035
  • Table 32: South Asia and Pacific Market Value (USD Million) Forecast by Product Type , 2020 to 2035
  • Table 33: South Asia and Pacific Market Value (USD Million) Forecast by Process, 2020 to 2035
  • Table 34: South Asia and Pacific Market Value (USD Million) Forecast by Form, 2020 to 2035
  • Table 35: South Asia and Pacific Market Value (USD Million) Forecast by Application, 2020 to 2035
  • Table 36: Middle East & Africa Market Value (USD Million) Forecast by Country, 2020 to 2035
  • Table 37: Middle East & Africa Market Value (USD Million) Forecast by Product Type , 2020 to 2035
  • Table 38: Middle East & Africa Market Value (USD Million) Forecast by Process, 2020 to 2035
  • Table 39: Middle East & Africa Market Value (USD Million) Forecast by Form, 2020 to 2035
  • Table 40: Middle East & Africa Market Value (USD Million) Forecast by Application, 2020 to 2035

List of Figures

  • Figure 1: Global Market Pricing Analysis
  • Figure 2: Global Market Value (USD Million) Forecast 2020-2035
  • Figure 3: Global Market Value Share and BPS Analysis by Product Type , 2025 and 2035
  • Figure 4: Global Market Y-o-Y Growth Comparison by Product Type , 2025-2035
  • Figure 5: Global Market Attractiveness Analysis by Product Type
  • Figure 6: Global Market Value Share and BPS Analysis by Process, 2025 and 2035
  • Figure 7: Global Market Y-o-Y Growth Comparison by Process, 2025-2035
  • Figure 8: Global Market Attractiveness Analysis by Process
  • Figure 9: Global Market Value Share and BPS Analysis by Form, 2025 and 2035
  • Figure 10: Global Market Y-o-Y Growth Comparison by Form, 2025-2035
  • Figure 11: Global Market Attractiveness Analysis by Form
  • Figure 12: Global Market Value Share and BPS Analysis by Application, 2025 and 2035
  • Figure 13: Global Market Y-o-Y Growth Comparison by Application, 2025-2035
  • Figure 14: Global Market Attractiveness Analysis by Application
  • Figure 15: Global Market Value (USD Million) Share and BPS Analysis by Region, 2025 and 2035
  • Figure 16: Global Market Y-o-Y Growth Comparison by Region, 2025-2035
  • Figure 17: Global Market Attractiveness Analysis by Region
  • Figure 18: North America Market Incremental Dollar Opportunity, 2025-2035
  • Figure 19: Latin America Market Incremental Dollar Opportunity, 2025-2035
  • Figure 20: Western Europe Market Incremental Dollar Opportunity, 2025-2035
  • Figure 21: Eastern Europe Market Incremental Dollar Opportunity, 2025-2035
  • Figure 22: East Asia Market Incremental Dollar Opportunity, 2025-2035
  • Figure 23: South Asia and Pacific Market Incremental Dollar Opportunity, 2025-2035
  • Figure 24: Middle East & Africa Market Incremental Dollar Opportunity, 2025-2035
  • Figure 25: North America Market Value Share and BPS Analysis by Country, 2025 and 2035
  • Figure 26: North America Market Value Share and BPS Analysis by Product Type , 2025 and 2035
  • Figure 27: North America Market Y-o-Y Growth Comparison by Product Type , 2025-2035
  • Figure 28: North America Market Attractiveness Analysis by Product Type
  • Figure 29: North America Market Value Share and BPS Analysis by Process, 2025 and 2035
  • Figure 30: North America Market Y-o-Y Growth Comparison by Process, 2025-2035
  • Figure 31: North America Market Attractiveness Analysis by Process
  • Figure 32: North America Market Value Share and BPS Analysis by Form, 2025 and 2035
  • Figure 33: North America Market Y-o-Y Growth Comparison by Form, 2025-2035
  • Figure 34: North America Market Attractiveness Analysis by Form
  • Figure 35: North America Market Value Share and BPS Analysis by Application, 2025 and 2035
  • Figure 36: North America Market Y-o-Y Growth Comparison by Application, 2025-2035
  • Figure 37: North America Market Attractiveness Analysis by Application
  • Figure 38: Latin America Market Value Share and BPS Analysis by Country, 2025 and 2035
  • Figure 39: Latin America Market Value Share and BPS Analysis by Product Type , 2025 and 2035
  • Figure 40: Latin America Market Y-o-Y Growth Comparison by Product Type , 2025-2035
  • Figure 41: Latin America Market Attractiveness Analysis by Product Type
  • Figure 42: Latin America Market Value Share and BPS Analysis by Process, 2025 and 2035
  • Figure 43: Latin America Market Y-o-Y Growth Comparison by Process, 2025-2035
  • Figure 44: Latin America Market Attractiveness Analysis by Process
  • Figure 45: Latin America Market Value Share and BPS Analysis by Form, 2025 and 2035
  • Figure 46: Latin America Market Y-o-Y Growth Comparison by Form, 2025-2035
  • Figure 47: Latin America Market Attractiveness Analysis by Form
  • Figure 48: Latin America Market Value Share and BPS Analysis by Application, 2025 and 2035
  • Figure 49: Latin America Market Y-o-Y Growth Comparison by Application, 2025-2035
  • Figure 50: Latin America Market Attractiveness Analysis by Application
  • Figure 51: Western Europe Market Value Share and BPS Analysis by Country, 2025 and 2035
  • Figure 52: Western Europe Market Value Share and BPS Analysis by Product Type , 2025 and 2035
  • Figure 53: Western Europe Market Y-o-Y Growth Comparison by Product Type , 2025-2035
  • Figure 54: Western Europe Market Attractiveness Analysis by Product Type
  • Figure 55: Western Europe Market Value Share and BPS Analysis by Process, 2025 and 2035
  • Figure 56: Western Europe Market Y-o-Y Growth Comparison by Process, 2025-2035
  • Figure 57: Western Europe Market Attractiveness Analysis by Process
  • Figure 58: Western Europe Market Value Share and BPS Analysis by Form, 2025 and 2035
  • Figure 59: Western Europe Market Y-o-Y Growth Comparison by Form, 2025-2035
  • Figure 60: Western Europe Market Attractiveness Analysis by Form
  • Figure 61: Western Europe Market Value Share and BPS Analysis by Application, 2025 and 2035
  • Figure 62: Western Europe Market Y-o-Y Growth Comparison by Application, 2025-2035
  • Figure 63: Western Europe Market Attractiveness Analysis by Application
  • Figure 64: Eastern Europe Market Value Share and BPS Analysis by Country, 2025 and 2035
  • Figure 65: Eastern Europe Market Value Share and BPS Analysis by Product Type , 2025 and 2035
  • Figure 66: Eastern Europe Market Y-o-Y Growth Comparison by Product Type , 2025-2035
  • Figure 67: Eastern Europe Market Attractiveness Analysis by Product Type
  • Figure 68: Eastern Europe Market Value Share and BPS Analysis by Process, 2025 and 2035
  • Figure 69: Eastern Europe Market Y-o-Y Growth Comparison by Process, 2025-2035
  • Figure 70: Eastern Europe Market Attractiveness Analysis by Process
  • Figure 71: Eastern Europe Market Value Share and BPS Analysis by Form, 2025 and 2035
  • Figure 72: Eastern Europe Market Y-o-Y Growth Comparison by Form, 2025-2035
  • Figure 73: Eastern Europe Market Attractiveness Analysis by Form
  • Figure 74: Eastern Europe Market Value Share and BPS Analysis by Application, 2025 and 2035
  • Figure 75: Eastern Europe Market Y-o-Y Growth Comparison by Application, 2025-2035
  • Figure 76: Eastern Europe Market Attractiveness Analysis by Application
  • Figure 77: East Asia Market Value Share and BPS Analysis by Country, 2025 and 2035
  • Figure 78: East Asia Market Value Share and BPS Analysis by Product Type , 2025 and 2035
  • Figure 79: East Asia Market Y-o-Y Growth Comparison by Product Type , 2025-2035
  • Figure 80: East Asia Market Attractiveness Analysis by Product Type
  • Figure 81: East Asia Market Value Share and BPS Analysis by Process, 2025 and 2035
  • Figure 82: East Asia Market Y-o-Y Growth Comparison by Process, 2025-2035
  • Figure 83: East Asia Market Attractiveness Analysis by Process
  • Figure 84: East Asia Market Value Share and BPS Analysis by Form, 2025 and 2035
  • Figure 85: East Asia Market Y-o-Y Growth Comparison by Form, 2025-2035
  • Figure 86: East Asia Market Attractiveness Analysis by Form
  • Figure 87: East Asia Market Value Share and BPS Analysis by Application, 2025 and 2035
  • Figure 88: East Asia Market Y-o-Y Growth Comparison by Application, 2025-2035
  • Figure 89: East Asia Market Attractiveness Analysis by Application
  • Figure 90: South Asia and Pacific Market Value Share and BPS Analysis by Country, 2025 and 2035
  • Figure 91: South Asia and Pacific Market Value Share and BPS Analysis by Product Type , 2025 and 2035
  • Figure 92: South Asia and Pacific Market Y-o-Y Growth Comparison by Product Type , 2025-2035
  • Figure 93: South Asia and Pacific Market Attractiveness Analysis by Product Type
  • Figure 94: South Asia and Pacific Market Value Share and BPS Analysis by Process, 2025 and 2035
  • Figure 95: South Asia and Pacific Market Y-o-Y Growth Comparison by Process, 2025-2035
  • Figure 96: South Asia and Pacific Market Attractiveness Analysis by Process
  • Figure 97: South Asia and Pacific Market Value Share and BPS Analysis by Form, 2025 and 2035
  • Figure 98: South Asia and Pacific Market Y-o-Y Growth Comparison by Form, 2025-2035
  • Figure 99: South Asia and Pacific Market Attractiveness Analysis by Form
  • Figure 100: South Asia and Pacific Market Value Share and BPS Analysis by Application, 2025 and 2035
  • Figure 101: South Asia and Pacific Market Y-o-Y Growth Comparison by Application, 2025-2035
  • Figure 102: South Asia and Pacific Market Attractiveness Analysis by Application
  • Figure 103: Middle East & Africa Market Value Share and BPS Analysis by Country, 2025 and 2035
  • Figure 104: Middle East & Africa Market Value Share and BPS Analysis by Product Type , 2025 and 2035
  • Figure 105: Middle East & Africa Market Y-o-Y Growth Comparison by Product Type , 2025-2035
  • Figure 106: Middle East & Africa Market Attractiveness Analysis by Product Type
  • Figure 107: Middle East & Africa Market Value Share and BPS Analysis by Process, 2025 and 2035
  • Figure 108: Middle East & Africa Market Y-o-Y Growth Comparison by Process, 2025-2035
  • Figure 109: Middle East & Africa Market Attractiveness Analysis by Process
  • Figure 110: Middle East & Africa Market Value Share and BPS Analysis by Form, 2025 and 2035
  • Figure 111: Middle East & Africa Market Y-o-Y Growth Comparison by Form, 2025-2035
  • Figure 112: Middle East & Africa Market Attractiveness Analysis by Form
  • Figure 113: Middle East & Africa Market Value Share and BPS Analysis by Application, 2025 and 2035
  • Figure 114: Middle East & Africa Market Y-o-Y Growth Comparison by Application, 2025-2035
  • Figure 115: Middle East & Africa Market Attractiveness Analysis by Application
  • Figure 116: Global Market - Tier Structure Analysis
  • Figure 117: Global Market - Company Share Analysis
Dashboard
Dashboard
Dashboard
Dashboard
Dashboard
Dashboard

Full Research Suite comprises of:

Market outlook & trends analysis

Market outlook & trends analysis

Interviews & case studies

Interviews & case studies

Strategic recommendations

Strategic recommendations

Vendor profiles & capabilities analysis

Vendor profiles & capabilities analysis

5-year forecasts

5-year forecasts

8 regions and 60+ country-level data splits

8 regions and 60+ country-level data splits

Market segment data splits

Market segment data splits

12 months of continuous data updates

12 months of continuous data updates

DELIVERED AS:

PDF EXCEL ONLINE

Full Research Suite


$5000

$7500

$10000

Buy Report Now
Similar Industry Reports

Similar Industry Reports

Synthetic Biology Market

Synthetic Biology Market Size and Share Forecast Outlook 2025 to 2035

Synthetic Abrasives Market

Synthetic Abrasives Market Size and Share Forecast Outlook 2025 to 2035

Synthetic Musk Market

Synthetic Musk Market Size and Share Forecast Outlook 2025 to 2035

Synthetic Tackifiers Market

Synthetic Tackifiers Market Size and Share Forecast Outlook 2025 to 2035

Synthetic Spider Silk Proteins Market

Synthetic Spider Silk Proteins Market Analysis - Size, Share, and Forecast Outlook 2025 to 2035

Synthetic Polymer Wax Market

Synthetic Polymer Wax Market Size and Share Forecast Outlook 2025 to 2035

Synthetic Aperture Radar (SAR) Market

Synthetic Aperture Radar (SAR) Market Size and Share Forecast Outlook 2025 to 2035

Synthetic Diamond Market

Synthetic Diamond Market Size and Share Forecast Outlook 2025 to 2035

Synthetic Turf Market

Synthetic Turf Market Size and Share Forecast Outlook 2025 to 2035

Synthetic Food Market

Synthetic Food Market Size and Share Forecast Outlook 2025 to 2035

Synthetic Polyisoprene Rubber Market

Synthetic Polyisoprene Rubber Market Report – Trends & Innovations 2025–2035

Synthetic and Bio Emulsion Polymer Market

Synthetic and Bio Emulsion Polymer Market Size and Share Forecast Outlook 2025 to 2035

Synthetic And Bio Based PMMA Polymethyl Methacrylate Size Market

Synthetic And Bio Based PMMA Polymethyl Methacrylate Size Market Size and Share Forecast Outlook 2025 to 2035

Synthetic Quartz Market

Synthetic Quartz Market Size and Share Forecast Outlook 2025 to 2035

Synthetic Leather Market

Synthetic Leather Market Forecast & Growth 2025 to 2035

Synthetic Quartz Industry Analysis in Japan

Synthetic Quartz Industry Analysis in Japan - Size, Share, & Forecast Outlook 2025 to 2035

Synthetic Food Color Market

Synthetic Food Color Market Analysis - Size, Share, and Forecast Outlook 2025 to 2035

Synthetic Paper Market

Synthetic Paper Market Insights - Growth & Trends Forecast 2025 to 2035

Synthetic Lubricants and Functional Fluids Market

Synthetic Lubricants and Functional Fluids Market - Growth & Demand 2025 to 2035

Synthetic Cinnamaldehyde Market

Synthetic Cinnamaldehyde Market Growth - Trends & Forecast 2025 to 2035

Future Market Insights

Synthetic Zeolite Y Adsorbent Market

Chat With MaRIA

Chat With

MaRIA

Hi There, I am MaRIA, Your Market Research Intelligence Assistant. How may I help you?