Synthetic Dye Market Size and Share Forecast Outlook From 2024 to 2034

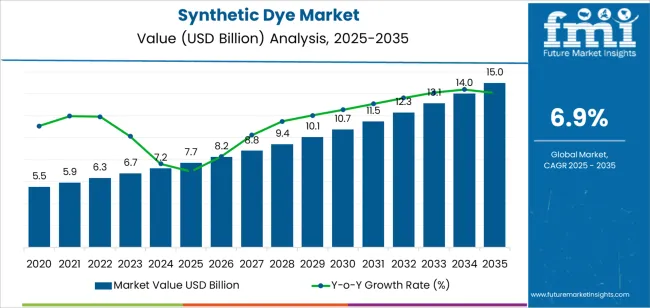
The synthetic dye market is evaluated to be sized at USD 7.2 billion in 2024. From 2024 to 2034, the market is expected to progress at a promising pace, registering a CAGR of 6.9%. By 2034, the synthetic dye industry is anticipated to reach a valuation of USD 14.1 billion.

Attributes Details
Estimated Synthetic Dye Market Value for 2024 USD 7.2 billion
Projected Market Value by 2034 USD 14.1 billion
Value-based CAGR of the Market from 2024 to 2034 6.9%

Top Market Insights and Industry Overview for Synthetic Dyes

  • Textiles have been the cornerstone sector when it comes to the demand for synthetic dyes. Therefore, with textile manufacturing reaching new heights, the demand for synthetic dyes is rapidly increasing.
  • Synthetic dyes are used in pulp and paper to provide them with the appropriate color for optimal use in end-use industries, such as publishing or packaging.
  • The demand for fashionable leather accessories is increasing among younger generations, and to give the leather vibrant and trendy colors, synthetic dyes are being utilized.
  • Colored food and beverages remain popular, and as demand for them increases with the introduction of new products, the synthetic dye industry stands to benefit.
  • Personal care products use synthetic dyes to have a more appealing appearance to consumers or to enhance the perception of the ingredients in consumers' minds, thereby aiding the growth of the market.
  • Colorants are being extensively used in various end-user industries, such as plastic coloring. Thus, the use of acids and colorants is paving the way for the increased adoption of synthetic dyes.

Key Trends Shaping the Synthetic Dye Market

  • Synthetic dyes are being manufactured inexpensively in emerging economies, and companies in the developed world are taking advantage by outsourcing production to these developing regions.
  • With the construction industry booming due to the ever-growing need for homes and office buildings, the use of synthetic dyes in the construction sector is also on the rise.
  • In line with sustainability trends, synthetic dye manufacturers are moving towards the production of eco-friendly dyes.
  • Digital textile printing is an emerging trend with significant potential, and synthetic dyes are being utilized to a greater extent to meet the demands of consumers.
  • With consumers increasingly preferring customized apparel, synthetic dyes are being used for the specific coloring of textiles. On-demand coloring requests are also being fulfilled with the use of coloring dyes.

Factors Restraining the Growth of the Synthetic Dye Market

  • Increasing governmental pressure is forcing manufacturers of synthetic dyes to observe production more closely, making the manufacturing process more strenuous.
  • Worsening geopolitical conditions in some parts of the world have complicated raw material procurement for manufacturers. Oil used in synthetic dyes is especially susceptible to price volatility.

Synthetic Dye Industry Analysis by Top Investment Segments

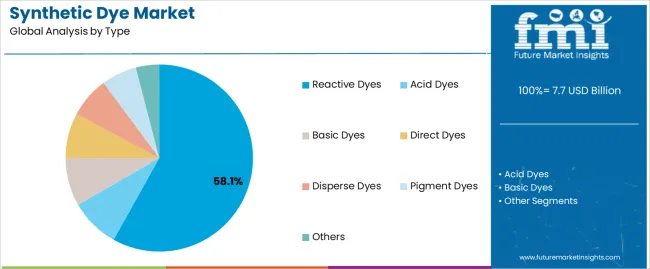
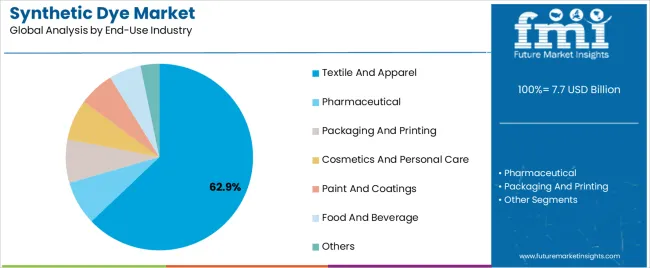
Acid dyes are the predominant type of dye in the market. On the other hand, the textile and apparel industry is the sector that utilizes synthetic dyes most frequently.

Irreplaceability of Acid Dyes in Certain Industrial Applications Propels its Demand

Acid dyes are expected to advance at a CAGR of 6.7% over the forecast period based on type. Some of the factors influencing the progress of acid dyes are:

  • While sustainability measures have seen natural dyes receive a boost in demand, they are still not suited for certain industrial applications, such as synthetic fibers. Thus, acid dyes have become indispensable in certain industrial applications.
  • Acid dyes have earned a reputation for their effectiveness in products such as synthetic leather. Thus, the demand for acid dyes is not dying down and is instead getting multiplied.
Attributes Details
Top Type Acid Dyes
Forecasted CAGR (2024 to 2034) 6.7%

Textile Industry’s Ever-growing Demand for Dyes Makes it a Reliable Source of Application

The textile and apparel application is expected to progress at a CAGR of 6.5% in the end-use industry segment throughout the forecast period. Some of the reasons for the progress of the textile and apparel application of synthetic dyes are:

  • The textile sector has experienced some setbacks in recent years, but the progress of the industry in developing economies keeps the demand for apparel as robust as ever. Thus, the textile and apparel application of synthetic dyes is not expected to slow down anytime soon.
  • The textile and apparel industry often operates at the whims of consumer demand. Synthetic dyes are increasingly sought after to keep up with rapidly changing consumer demands.
Attributes Details
Top End-use Industry Textile and Apparel
Forecasted CAGR (2024 to 2034) 6.5%

Analysis of Top Countries, Producing and Exporting Synthetic Dyes

The Asia Pacific is a fertile region for the market owing to its enormous population and its significant demand for clothing. The food requirements of the region are also substantial, and there is a high demand for colored food and beverages. North America and Europe are prominent regions for luxurious apparel. Thus, the market is also gaining significant attention in these two regions.

Countries Forecasted CAGR (2024 to 2034)
United States 7.2%
United Kingdom 8.1%
China 7.9%
Japan 8.5%
South Korea 9.0%

Demand for Customized Apparel is Expanding the Market’s Scope in South Korea

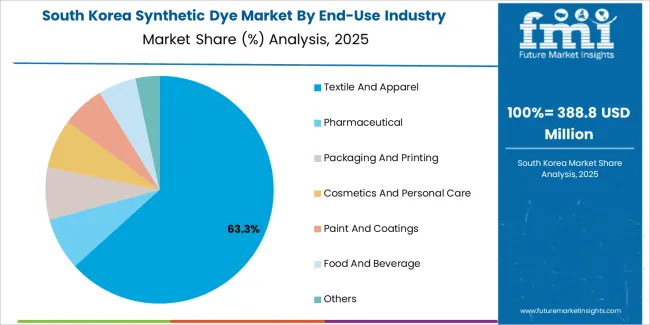
The CAGR of the synthetic dye market in South Korea during the forecast period is anticipated to be 9.0%. Some of the factors influencing the healthy growth of the market in the country are:
  • The pop-culture-obsessed youth in South Korea are demanding customized apparel, and they want it quickly. Thus, synthetic dyes are finding greater use in the country.
  • With eCommerce sales of apparel increasing daily in the country, the digital printing application of synthetic dyes is also increasing in South Korea.

Personal Care Products are Taking Care of Synthetic Dyes’ Positive Progression in Japan

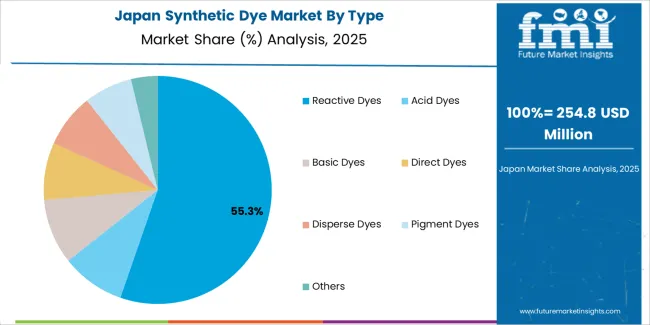
The synthetic dye market is expected to register a CAGR of 8.5% in Japan over the forecast period. Some of the factors contributing to the growth of the market in Japan are:

  • The population in Japan, especially the younger generation, is becoming increasingly focused on appearance. Thus, there is significant demand for beauty and personal care products in the country, benefiting the market for synthetic dyes.
  • The eco-friendly nature of a considerable percentage of Japan’s population is leading to the production of more sustainability-inclined synthetic dyes in the country.

China’s Gargantuan Textile Industry is a Source for the Market’s Beaming Progress in the Country

The synthetic dye market is expected to exhibit a CAGR of 7.9% in China through 2034. Some of the factors responsible for the growth of the market are:

  • China is reputed to have the largest textile manufacturing sector in the world. Thus, synthetic dyes find a home in the country.
  • Many Western companies are setting up synthetic dye manufacturing units in China, owing to the availability of cheap labor and skilled professionals in the country.

Colored Food Being Widely Accepted in the United Kingdom Makes the Country Appealing for the Market

The synthetic dye market is expected to progress at a CAGR of 8.1% in the United Kingdom through 2034. Some factors influencing the progress are:

  • Even with trends toward coloring and additive-free food, colored food and beverages remain popular in the United Kingdom. Thus, the food and beverage sector is driving up the demand for the product in the country.
  • Growing governmental pressure is prompting synthetic dye manufacturers to shift to the production of sustainable dyes in the country.

Increased Needs for Homes and Buildings Leading to More Demand for Synthetic Dies in the Construction Sector in the United States

The market is expected to register a CAGR of 7.2% in the United States between 2024 and 2034. Some factors influencing the growth of the market in the country are:
  • With the construction sector in the United States thriving, the use of synthetic dyes is being bolstered in the country.
  • The United States is a prominent importer of textiles and apparel, and thus, demand originating in the country is positively impacting the synthetic dye market.

Key Players and Market Concentration in the Synthetic Dye Industry

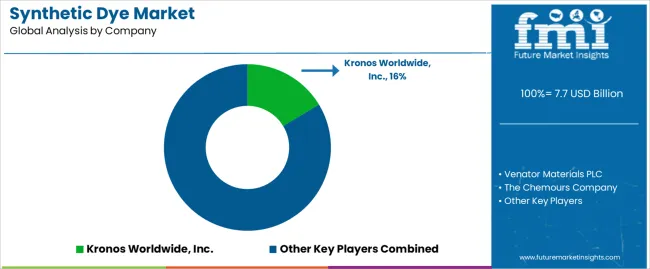
To capitalize on the opportunities present in developing countries, such as cheap labor and the availability of raw materials, Western companies are forming partnerships with outfits in these regions. The Asia Pacific is specifically a region where this practice is flourishing.

The synthetic dyes market has enough room for both established multinational giants and local players. Improving the manufacturing process, for example, by obtaining raw materials more quickly, is a focus for market players.

Recent Developments in the Synthetic Dye Market

  • In March 2022, two new acid dyes were launched by Archroma. These dyes are metal and halogen-free.
  • In May 2019, Lanxess AG wrapped up the expansion of its Macrolex dyes production facility in Germany.
  • In August 2022, researchers from the North Carolina State University demonstrated the potential of a polymer that can remove dyes from water.

Leading Suppliers in the Global Synthetic Dye Market

  • Kronos Worldwide, Inc.
  • Venator Materials PLC
  • The Chemours Company
  • Organic Dyes and Pigments
  • Huntsman International LLC

Key Shifting Preferences Covered in the Synthetic Dye Market Report

  • Synthetic Dyes & Chemicals Market Report
  • Natural Dyes vs Synthetic Dyes Demand Analysis
  • Synthetic Dyes Classification According to Type with Growth Forecasts
  • Synthetic Organic Dyes Demand and Development Analysis
  • Adjacent Synthetic Colorant Market Analysis
  • In-depth Study of Environmental Impact of Synthetic Dyes and its Subsequent Influence on Market Demand

Top Segments Studied in the Synthetic Dye Market

By Type:

  • Acid Dyes
  • Basic Dyes
  • Direct Dyes
  • Disperse Dyes
  • Pigment Dyes
  • Reactive Dyes
  • Others

By End-use Industry:

  • Textile and apparel
  • Pharmaceutical
  • Packaging and Printing
  • Cosmetics and Personal care
  • Paint and Coatings
  • Food and Beverage
  • Others

By Region:

  • North America
  • Latin America
  • Europe
  • South Asia
  • East Asia
  • Oceania
  • Middle East and Africa (MEA)

Table of Content

  • 1. Executive Summary
  • 2. Market Overview
  • 3. Market Background
  • 4. Global Market Analysis 2019 to 2023 and Forecast, 2024 to 2034
  • 5. Global Market Analysis 2019 to 2023 and Forecast 2024 to 2034, By Type
    • 5.1. Acid Dyes
    • 5.2. Basic Dyes
    • 5.3. Direct Dyes
    • 5.4. Disperse Dyes
    • 5.5. Pigment Dyes
    • 5.6. Reactive Dyes
    • 5.7. Others
  • 6. Global Market Analysis 2019 to 2023 and Forecast 2024 to 2034, By End-Use Industry
    • 6.1. Textile and Apparel
    • 6.2. Pharmaceutical
    • 6.3. Packaging and Printing
    • 6.4. Cosmetics and Personal Care
    • 6.5. Paint and Coatings
    • 6.6. Food and Beverage
    • 6.7. Others
  • 7. Global Market Analysis 2019 to 2023 and Forecast 2024 to 2034, By Region
    • 7.1. North America
    • 7.2. Latin America
    • 7.3. Europe
    • 7.4. East Asia
    • 7.5. South Asia
    • 7.6. Oceania
    • 7.7. MEA
  • 8. North America Market Analysis 2019 to 2023 and Forecast 2024 to 2034, By Country
  • 9. Latin America Market Analysis 2019 to 2023 and Forecast 2024 to 2034, By Country
  • 10. Europe Market Analysis 2019 to 2023 and Forecast 2024 to 2034, By Country
  • 11. East Asia Market Analysis 2019 to 2023 and Forecast 2024 to 2034, By Country
  • 12. South Asia Market Analysis 2019 to 2023 and Forecast 2024 to 2034, By Country
  • 13. Oceania Market Analysis 2019 to 2023 and Forecast 2024 to 2034, By Country
  • 14. MEA Market Analysis 2019 to 2023 and Forecast 2024 to 2034, By Country
  • 15. Key Countries Market Analysis
  • 16. Market Structure Analysis
  • 17. Competition Analysis
    • 17.1. Kronos Worldwide, Inc
    • 17.2. Venator Materials PLC
    • 17.3. The Chemours Company
    • 17.4. Organic Dyes and Pigments
    • 17.5. Huntsman International LLC
    • 17.6. Sunshine International Co., Ltd
    • 17.7. DyStar Singapore Pte Ltd
    • 17.8. Archroma
    • 17.9. BASF SE
    • 17.10. Others
  • 18. Assumptions & Acronyms Used
  • 19. Research Methodology

List of Tables

Table 1: Global Market Value (US$ Million) Forecast by Region, 2019 to 2034

Table 2: Global Market Volume (Tons) Forecast by Region, 2019 to 2034

Table 3: Global Market Value (US$ Million) Forecast by Type, 2019 to 2034

Table 4: Global Market Volume (Tons) Forecast by Type, 2019 to 2034

Table 5: Global Market Value (US$ Million) Forecast by END-USE INDUSTRY, 2019 to 2034

Table 6: Global Market Volume (Tons) Forecast by END-USE INDUSTRY, 2019 to 2034

Table 7: North America Market Value (US$ Million) Forecast by Country, 2019 to 2034

Table 8: North America Market Volume (Tons) Forecast by Country, 2019 to 2034

Table 9: North America Market Value (US$ Million) Forecast by Type, 2019 to 2034

Table 10: North America Market Volume (Tons) Forecast by Type, 2019 to 2034

Table 11: North America Market Value (US$ Million) Forecast by END-USE INDUSTRY, 2019 to 2034

Table 12: North America Market Volume (Tons) Forecast by END-USE INDUSTRY, 2019 to 2034

Table 13: Latin America Market Value (US$ Million) Forecast by Country, 2019 to 2034

Table 14: Latin America Market Volume (Tons) Forecast by Country, 2019 to 2034

Table 15: Latin America Market Value (US$ Million) Forecast by Type, 2019 to 2034

Table 16: Latin America Market Volume (Tons) Forecast by Type, 2019 to 2034

Table 17: Latin America Market Value (US$ Million) Forecast by END-USE INDUSTRY, 2019 to 2034

Table 18: Latin America Market Volume (Tons) Forecast by END-USE INDUSTRY, 2019 to 2034

Table 19: Europe Market Value (US$ Million) Forecast by Country, 2019 to 2034

Table 20: Europe Market Volume (Tons) Forecast by Country, 2019 to 2034

Table 21: Europe Market Value (US$ Million) Forecast by Type, 2019 to 2034

Table 22: Europe Market Volume (Tons) Forecast by Type, 2019 to 2034

Table 23: Europe Market Value (US$ Million) Forecast by END-USE INDUSTRY, 2019 to 2034

Table 24: Europe Market Volume (Tons) Forecast by END-USE INDUSTRY, 2019 to 2034

Table 25: East Asia Market Value (US$ Million) Forecast by Country, 2019 to 2034

Table 26: East Asia Market Volume (Tons) Forecast by Country, 2019 to 2034

Table 27: East Asia Market Value (US$ Million) Forecast by Type, 2019 to 2034

Table 28: East Asia Market Volume (Tons) Forecast by Type, 2019 to 2034

Table 29: East Asia Market Value (US$ Million) Forecast by END-USE INDUSTRY, 2019 to 2034

Table 30: East Asia Market Volume (Tons) Forecast by END-USE INDUSTRY, 2019 to 2034

Table 31: South Asia Market Value (US$ Million) Forecast by Country, 2019 to 2034

Table 32: South Asia Market Volume (Tons) Forecast by Country, 2019 to 2034

Table 33: South Asia Market Value (US$ Million) Forecast by Type, 2019 to 2034

Table 34: South Asia Market Volume (Tons) Forecast by Type, 2019 to 2034

Table 35: South Asia Market Value (US$ Million) Forecast by END-USE INDUSTRY, 2019 to 2034

Table 36: South Asia Market Volume (Tons) Forecast by END-USE INDUSTRY, 2019 to 2034

Table 37: Oceania Market Value (US$ Million) Forecast by Country, 2019 to 2034

Table 38: Oceania Market Volume (Tons) Forecast by Country, 2019 to 2034

Table 39: Oceania Market Value (US$ Million) Forecast by Type, 2019 to 2034

Table 40: Oceania Market Volume (Tons) Forecast by Type, 2019 to 2034

Table 41: Oceania Market Value (US$ Million) Forecast by END-USE INDUSTRY, 2019 to 2034

Table 42: Oceania Market Volume (Tons) Forecast by END-USE INDUSTRY, 2019 to 2034

Table 43: MEA Market Value (US$ Million) Forecast by Country, 2019 to 2034

Table 44: MEA Market Volume (Tons) Forecast by Country, 2019 to 2034

Table 45: MEA Market Value (US$ Million) Forecast by Type, 2019 to 2034

Table 46: MEA Market Volume (Tons) Forecast by Type, 2019 to 2034

Table 47: MEA Market Value (US$ Million) Forecast by END-USE INDUSTRY, 2019 to 2034

Table 48: MEA Market Volume (Tons) Forecast by END-USE INDUSTRY, 2019 to 2034

List of Figures

Figure 1: Global Market Value (US$ Million) by Type, 2024 to 2034

Figure 2: Global Market Value (US$ Million) by END-USE INDUSTRY, 2024 to 2034

Figure 3: Global Market Value (US$ Million) by Region, 2024 to 2034

Figure 4: Global Market Value (US$ Million) Analysis by Region, 2019 to 2034

Figure 5: Global Market Volume (Tons) Analysis by Region, 2019 to 2034

Figure 6: Global Market Value Share (%) and BPS Analysis by Region, 2024 to 2034

Figure 7: Global Market Y-o-Y Growth (%) Projections by Region, 2024 to 2034

Figure 8: Global Market Value (US$ Million) Analysis by Type, 2019 to 2034

Figure 9: Global Market Volume (Tons) Analysis by Type, 2019 to 2034

Figure 10: Global Market Value Share (%) and BPS Analysis by Type, 2024 to 2034

Figure 11: Global Market Y-o-Y Growth (%) Projections by Type, 2024 to 2034

Figure 12: Global Market Value (US$ Million) Analysis by END-USE INDUSTRY, 2019 to 2034

Figure 13: Global Market Volume (Tons) Analysis by END-USE INDUSTRY, 2019 to 2034

Figure 14: Global Market Value Share (%) and BPS Analysis by END-USE INDUSTRY, 2024 to 2034

Figure 15: Global Market Y-o-Y Growth (%) Projections by END-USE INDUSTRY, 2024 to 2034

Figure 16: Global Market Attractiveness by Type, 2024 to 2034

Figure 17: Global Market Attractiveness by END-USE INDUSTRY, 2024 to 2034

Figure 18: Global Market Attractiveness by Region, 2024 to 2034

Figure 19: North America Market Value (US$ Million) by Type, 2024 to 2034

Figure 20: North America Market Value (US$ Million) by END-USE INDUSTRY, 2024 to 2034

Figure 21: North America Market Value (US$ Million) by Country, 2024 to 2034

Figure 22: North America Market Value (US$ Million) Analysis by Country, 2019 to 2034

Figure 23: North America Market Volume (Tons) Analysis by Country, 2019 to 2034

Figure 24: North America Market Value Share (%) and BPS Analysis by Country, 2024 to 2034

Figure 25: North America Market Y-o-Y Growth (%) Projections by Country, 2024 to 2034

Figure 26: North America Market Value (US$ Million) Analysis by Type, 2019 to 2034

Figure 27: North America Market Volume (Tons) Analysis by Type, 2019 to 2034

Figure 28: North America Market Value Share (%) and BPS Analysis by Type, 2024 to 2034

Figure 29: North America Market Y-o-Y Growth (%) Projections by Type, 2024 to 2034

Figure 30: North America Market Value (US$ Million) Analysis by END-USE INDUSTRY, 2019 to 2034

Figure 31: North America Market Volume (Tons) Analysis by END-USE INDUSTRY, 2019 to 2034

Figure 32: North America Market Value Share (%) and BPS Analysis by END-USE INDUSTRY, 2024 to 2034

Figure 33: North America Market Y-o-Y Growth (%) Projections by END-USE INDUSTRY, 2024 to 2034

Figure 34: North America Market Attractiveness by Type, 2024 to 2034

Figure 35: North America Market Attractiveness by END-USE INDUSTRY, 2024 to 2034

Figure 36: North America Market Attractiveness by Country, 2024 to 2034

Figure 37: Latin America Market Value (US$ Million) by Type, 2024 to 2034

Figure 38: Latin America Market Value (US$ Million) by END-USE INDUSTRY, 2024 to 2034

Figure 39: Latin America Market Value (US$ Million) by Country, 2024 to 2034

Figure 40: Latin America Market Value (US$ Million) Analysis by Country, 2019 to 2034

Figure 41: Latin America Market Volume (Tons) Analysis by Country, 2019 to 2034

Figure 42: Latin America Market Value Share (%) and BPS Analysis by Country, 2024 to 2034

Figure 43: Latin America Market Y-o-Y Growth (%) Projections by Country, 2024 to 2034

Figure 44: Latin America Market Value (US$ Million) Analysis by Type, 2019 to 2034

Figure 45: Latin America Market Volume (Tons) Analysis by Type, 2019 to 2034

Figure 46: Latin America Market Value Share (%) and BPS Analysis by Type, 2024 to 2034

Figure 47: Latin America Market Y-o-Y Growth (%) Projections by Type, 2024 to 2034

Figure 48: Latin America Market Value (US$ Million) Analysis by END-USE INDUSTRY, 2019 to 2034

Figure 49: Latin America Market Volume (Tons) Analysis by END-USE INDUSTRY, 2019 to 2034

Figure 50: Latin America Market Value Share (%) and BPS Analysis by END-USE INDUSTRY, 2024 to 2034

Figure 51: Latin America Market Y-o-Y Growth (%) Projections by END-USE INDUSTRY, 2024 to 2034

Figure 52: Latin America Market Attractiveness by Type, 2024 to 2034

Figure 53: Latin America Market Attractiveness by END-USE INDUSTRY, 2024 to 2034

Figure 54: Latin America Market Attractiveness by Country, 2024 to 2034

Figure 55: Europe Market Value (US$ Million) by Type, 2024 to 2034

Figure 56: Europe Market Value (US$ Million) by END-USE INDUSTRY, 2024 to 2034

Figure 57: Europe Market Value (US$ Million) by Country, 2024 to 2034

Figure 58: Europe Market Value (US$ Million) Analysis by Country, 2019 to 2034

Figure 59: Europe Market Volume (Tons) Analysis by Country, 2019 to 2034

Figure 60: Europe Market Value Share (%) and BPS Analysis by Country, 2024 to 2034

Figure 61: Europe Market Y-o-Y Growth (%) Projections by Country, 2024 to 2034

Figure 62: Europe Market Value (US$ Million) Analysis by Type, 2019 to 2034

Figure 63: Europe Market Volume (Tons) Analysis by Type, 2019 to 2034

Figure 64: Europe Market Value Share (%) and BPS Analysis by Type, 2024 to 2034

Figure 65: Europe Market Y-o-Y Growth (%) Projections by Type, 2024 to 2034

Figure 66: Europe Market Value (US$ Million) Analysis by END-USE INDUSTRY, 2019 to 2034

Figure 67: Europe Market Volume (Tons) Analysis by END-USE INDUSTRY, 2019 to 2034

Figure 68: Europe Market Value Share (%) and BPS Analysis by END-USE INDUSTRY, 2024 to 2034

Figure 69: Europe Market Y-o-Y Growth (%) Projections by END-USE INDUSTRY, 2024 to 2034

Figure 70: Europe Market Attractiveness by Type, 2024 to 2034

Figure 71: Europe Market Attractiveness by END-USE INDUSTRY, 2024 to 2034

Figure 72: Europe Market Attractiveness by Country, 2024 to 2034

Figure 73: East Asia Market Value (US$ Million) by Type, 2024 to 2034

Figure 74: East Asia Market Value (US$ Million) by END-USE INDUSTRY, 2024 to 2034

Figure 75: East Asia Market Value (US$ Million) by Country, 2024 to 2034

Figure 76: East Asia Market Value (US$ Million) Analysis by Country, 2019 to 2034

Figure 77: East Asia Market Volume (Tons) Analysis by Country, 2019 to 2034

Figure 78: East Asia Market Value Share (%) and BPS Analysis by Country, 2024 to 2034

Figure 79: East Asia Market Y-o-Y Growth (%) Projections by Country, 2024 to 2034

Figure 80: East Asia Market Value (US$ Million) Analysis by Type, 2019 to 2034

Figure 81: East Asia Market Volume (Tons) Analysis by Type, 2019 to 2034

Figure 82: East Asia Market Value Share (%) and BPS Analysis by Type, 2024 to 2034

Figure 83: East Asia Market Y-o-Y Growth (%) Projections by Type, 2024 to 2034

Figure 84: East Asia Market Value (US$ Million) Analysis by END-USE INDUSTRY, 2019 to 2034

Figure 85: East Asia Market Volume (Tons) Analysis by END-USE INDUSTRY, 2019 to 2034

Figure 86: East Asia Market Value Share (%) and BPS Analysis by END-USE INDUSTRY, 2024 to 2034

Figure 87: East Asia Market Y-o-Y Growth (%) Projections by END-USE INDUSTRY, 2024 to 2034

Figure 88: East Asia Market Attractiveness by Type, 2024 to 2034

Figure 89: East Asia Market Attractiveness by END-USE INDUSTRY, 2024 to 2034

Figure 90: East Asia Market Attractiveness by Country, 2024 to 2034

Figure 91: South Asia Market Value (US$ Million) by Type, 2024 to 2034

Figure 92: South Asia Market Value (US$ Million) by END-USE INDUSTRY, 2024 to 2034

Figure 93: South Asia Market Value (US$ Million) by Country, 2024 to 2034

Figure 94: South Asia Market Value (US$ Million) Analysis by Country, 2019 to 2034

Figure 95: South Asia Market Volume (Tons) Analysis by Country, 2019 to 2034

Figure 96: South Asia Market Value Share (%) and BPS Analysis by Country, 2024 to 2034

Figure 97: South Asia Market Y-o-Y Growth (%) Projections by Country, 2024 to 2034

Figure 98: South Asia Market Value (US$ Million) Analysis by Type, 2019 to 2034

Figure 99: South Asia Market Volume (Tons) Analysis by Type, 2019 to 2034

Figure 100: South Asia Market Value Share (%) and BPS Analysis by Type, 2024 to 2034

Figure 101: South Asia Market Y-o-Y Growth (%) Projections by Type, 2024 to 2034

Figure 102: South Asia Market Value (US$ Million) Analysis by END-USE INDUSTRY, 2019 to 2034

Figure 103: South Asia Market Volume (Tons) Analysis by END-USE INDUSTRY, 2019 to 2034

Figure 104: South Asia Market Value Share (%) and BPS Analysis by END-USE INDUSTRY, 2024 to 2034

Figure 105: South Asia Market Y-o-Y Growth (%) Projections by END-USE INDUSTRY, 2024 to 2034

Figure 106: South Asia Market Attractiveness by Type, 2024 to 2034

Figure 107: South Asia Market Attractiveness by END-USE INDUSTRY, 2024 to 2034

Figure 108: South Asia Market Attractiveness by Country, 2024 to 2034

Figure 109: Oceania Market Value (US$ Million) by Type, 2024 to 2034

Figure 110: Oceania Market Value (US$ Million) by END-USE INDUSTRY, 2024 to 2034

Figure 111: Oceania Market Value (US$ Million) by Country, 2024 to 2034

Figure 112: Oceania Market Value (US$ Million) Analysis by Country, 2019 to 2034

Figure 113: Oceania Market Volume (Tons) Analysis by Country, 2019 to 2034

Figure 114: Oceania Market Value Share (%) and BPS Analysis by Country, 2024 to 2034

Figure 115: Oceania Market Y-o-Y Growth (%) Projections by Country, 2024 to 2034

Figure 116: Oceania Market Value (US$ Million) Analysis by Type, 2019 to 2034

Figure 117: Oceania Market Volume (Tons) Analysis by Type, 2019 to 2034

Figure 118: Oceania Market Value Share (%) and BPS Analysis by Type, 2024 to 2034

Figure 119: Oceania Market Y-o-Y Growth (%) Projections by Type, 2024 to 2034

Figure 120: Oceania Market Value (US$ Million) Analysis by END-USE INDUSTRY, 2019 to 2034

Figure 121: Oceania Market Volume (Tons) Analysis by END-USE INDUSTRY, 2019 to 2034

Figure 122: Oceania Market Value Share (%) and BPS Analysis by END-USE INDUSTRY, 2024 to 2034

Figure 123: Oceania Market Y-o-Y Growth (%) Projections by END-USE INDUSTRY, 2024 to 2034

Figure 124: Oceania Market Attractiveness by Type, 2024 to 2034

Figure 125: Oceania Market Attractiveness by END-USE INDUSTRY, 2024 to 2034

Figure 126: Oceania Market Attractiveness by Country, 2024 to 2034

Figure 127: MEA Market Value (US$ Million) by Type, 2024 to 2034

Figure 128: MEA Market Value (US$ Million) by END-USE INDUSTRY, 2024 to 2034

Figure 129: MEA Market Value (US$ Million) by Country, 2024 to 2034

Figure 130: MEA Market Value (US$ Million) Analysis by Country, 2019 to 2034

Figure 131: MEA Market Volume (Tons) Analysis by Country, 2019 to 2034

Figure 132: MEA Market Value Share (%) and BPS Analysis by Country, 2024 to 2034

Figure 133: MEA Market Y-o-Y Growth (%) Projections by Country, 2024 to 2034

Figure 134: MEA Market Value (US$ Million) Analysis by Type, 2019 to 2034

Figure 135: MEA Market Volume (Tons) Analysis by Type, 2019 to 2034

Figure 136: MEA Market Value Share (%) and BPS Analysis by Type, 2024 to 2034

Figure 137: MEA Market Y-o-Y Growth (%) Projections by Type, 2024 to 2034

Figure 138: MEA Market Value (US$ Million) Analysis by END-USE INDUSTRY, 2019 to 2034

Figure 139: MEA Market Volume (Tons) Analysis by END-USE INDUSTRY, 2019 to 2034

Figure 140: MEA Market Value Share (%) and BPS Analysis by END-USE INDUSTRY, 2024 to 2034

Figure 141: MEA Market Y-o-Y Growth (%) Projections by END-USE INDUSTRY, 2024 to 2034

Figure 142: MEA Market Attractiveness by Type, 2024 to 2034

Figure 143: MEA Market Attractiveness by END-USE INDUSTRY, 2024 to 2034

Figure 144: MEA Market Attractiveness by Country, 2024 to 2034

Frequently Asked Questions

How Big is the Synthetic Dye Market?

The size of the synthetic dye market is estimated to be USD 7.2 billion in 2024.

At What Rate is the Synthetic Dye Market Expected to Grow?

The market is expected to increase at a CAGR of 6.9% over the forecast period.

What is the Scope of Synthetic Dye Market in the United States?

The market is expected to register a CAGR of 7.2% in the United States from 2024 to 2034.

What is the Demand Forecast for Synthetic Dye?

The synthetic dye market is forecasted to have reached a size of USD 14.1 billion by 2034.

What are the Key Trends in the Synthetic Dye Industry?

Eco-friendly synthetic dyes and the use of synthetic dyes in the construction industry are two of the trends in the synthetic dye industry.

Explore Similar Insights

Future Market Insights

Synthetic Dye Market